本文简要介绍 python 语言中 scipy.stats.siegelslopes 的用法。
用法:
scipy.stats.siegelslopes(y, x=None, method='hierarchical')#计算一组点 (x, y) 的 Siegel 估计量。
siegelslopes实现了一种使用重复中值(参见 [1])来拟合点 (x, y) 的直线的稳健线性回归方法。该方法对于渐近崩溃点为 50% 的异常值具有鲁棒性。- y: array_like
因变量。
- x: 数组 或 None,可选
自变量。如果没有,请改用
arange(len(y))。- method: {‘hierarchical’, ‘separate’}
如果‘hierarchical’,使用估计的斜率
slope(默认选项)估计截距。如果‘separate’,估计与估计斜率无关的截距。有关详细信息,请参阅注释。
- result:
SiegelslopesResult实例 返回值是一个具有以下属性的对象:
- 坡 浮点数
回归线斜率的估计。
- 截距 浮点数
估计回归线的截距。
- result:
参数 ::
返回 ::
注意:
和
n = len(y), 计算m_j作为从该点开始的斜率的中位数(x[j], y[j])对所有其他n-1点。slope那么是所有斜率的中位数m_j.给出了两种估计截距的方法[1]可以通过参数选择method.分层方法使用估计的斜率slope并计算intercept作为中位数y - slope*x.另一种方法分别估计截距如下:对于每个点(x[j], y[j]),计算所有的截距n-1穿过其余点并取中位数i_j.intercept是中位数i_j.实现计算n乘以大小向量的中位数n对于大型向量,这可能会很慢。有更有效的算法(见[2]) 这里没有实现。
为了与旧版本的 SciPy 兼容,返回值的行为类似于长度为 2 的
namedtuple,其中包含字段slope和intercept,因此可以继续编写:slope, intercept = siegelslopes(y, x)参考:
[1] (1,2)A. Siegel,“使用重复中位数的稳健回归”,Biometrika,卷。 69,第 242-244 页,1982 年。
[2]A. Stein 和 M. Werman,“寻找重复中值回归线”,第三届年度 ACM-SIAM 离散算法研讨会论文集,第 409-413 页,1992 年。
例子:
>>> import numpy as np
>>> from scipy import stats
>>> import matplotlib.pyplot as plt
>>> x = np.linspace(-5, 5, num=150) >>> y = x + np.random.normal(size=x.size) >>> y[11:15] += 10 # add outliers >>> y[-5:] -= 7计算斜率和截距。为了进行比较,还可以使用
linregress计算最小二乘拟合:>>> res = stats.siegelslopes(y, x) >>> lsq_res = stats.linregress(x, y)绘制结果。西格尔回归线以红色显示。绿线显示用于比较的最小二乘拟合。
>>> fig = plt.figure()
>>> ax = fig.add_subplot(111)
>>> ax.plot(x, y, 'b.')
>>> ax.plot(x, res[1] + res[0] * x, 'r-')
>>> ax.plot(x, lsq_res[1] + lsq_res[0] * x, 'g-')
>>> plt.show()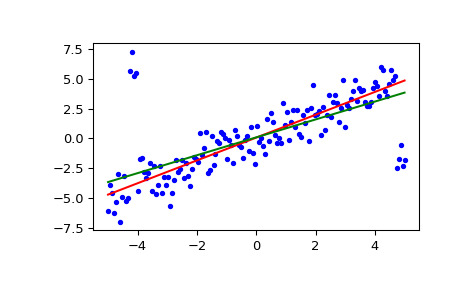
相关用法
- Python SciPy stats.sigmaclip用法及代码示例
- Python SciPy stats.skewnorm用法及代码示例
- Python SciPy stats.semicircular用法及代码示例
- Python SciPy stats.skellam用法及代码示例
- Python scipy.stats.somersd用法及代码示例
- Python SciPy stats.sem用法及代码示例
- Python SciPy stats.skewcauchy用法及代码示例
- Python SciPy stats.scoreatpercentile用法及代码示例
- Python SciPy stats.skew用法及代码示例
- Python SciPy stats.spearmanr用法及代码示例
- Python SciPy stats.shapiro用法及代码示例
- Python SciPy stats.studentized_range用法及代码示例
- Python SciPy stats.skewtest用法及代码示例
- Python SciPy stats.special_ortho_group用法及代码示例
- Python SciPy stats.sobol_indices用法及代码示例
- Python SciPy stats.anderson用法及代码示例
- Python SciPy stats.iqr用法及代码示例
- Python SciPy stats.genpareto用法及代码示例
- Python SciPy stats.cosine用法及代码示例
- Python SciPy stats.norminvgauss用法及代码示例
- Python SciPy stats.directional_stats用法及代码示例
- Python SciPy stats.invwishart用法及代码示例
- Python SciPy stats.bartlett用法及代码示例
- Python SciPy stats.levy_stable用法及代码示例
- Python SciPy stats.page_trend_test用法及代码示例
注:本文由纯净天空筛选整理自scipy.org大神的英文原创作品 scipy.stats.siegelslopes。非经特殊声明,原始代码版权归原作者所有,本译文未经允许或授权,请勿转载或复制。