本文简要介绍 python 语言中 scipy.stats.bartlett 的用法。
用法:
scipy.stats.bartlett(*samples)#对等方差执行 Bartlett 检验。
Bartlett 检验检验所有输入样本均来自方差相等的总体的原假设。对于来自显著非正态总体的样本,Levene 的检验
levene更加稳健。- sample1, sample2, …: array_like
样本数据数组。只接受一维数组,它们可能有不同的长度。
- statistic: 浮点数
检验统计量。
- pvalue: 浮点数
检验的 p 值。
参数 ::
返回 ::
注意:
康诺弗等人。 (1981) 通过广泛的模拟检查了许多现有的参数和非参数测试,他们得出结论,Fligner 和 Killeen (1976) 和 Levene (1960) 提出的测试在偏离正态性和功率的稳健性方面似乎更优越([ 3])。
参考:
[2]Snedecor, George W. 和 Cochran, William G. (1989),统计方法,第八版,爱荷华州立大学出版社。
[3]Park, C. 和 Lindsay, B. G. (1999)。基于二次推理函数的稳健尺度估计和假设检验。技术报告 #99-03,宾夕法尼亚州立大学可能性研究中心。
[4]巴特利特,M. S. (1937)。充分性和统计检验的性质。伦敦皇家学会会刊。系列 A,数学和物理科学,卷。 160,第 901 期,第 268-282 页。
[5]C.I. BLISS (1952),生物测定统计:特别参考维生素,第 499-503 页,DOI:10.1016/C2013-0-12584-6。
[6]B. Phipson 和 G. K. Smyth。 “排列 P 值不应该为零:随机抽取排列时计算精确的 P 值。”遗传学和分子生物学中的统计应用 9.1 (2010)。
[7]勒德布鲁克,J. 和达德利,H. (1998)。为什么排列检验在生物医学研究中优于 t 和 F 检验。 《美国统计学家》,52(2), 127-132。
例子:
文献[5]研究了维生素C对豚鼠牙齿生长的影响。在一项对照研究中,60 名受试者被分为小剂量组、中剂量组和大剂量组,分别每天服用 0.5、1.0 和 2.0 毫克维生素 C。 42天后,测量牙齿的生长情况。
下面的
small_dose、medium_dose和large_dose数组记录了三组的牙齿生长测量值(以微米为单位)。>>> import numpy as np >>> small_dose = np.array([ ... 4.2, 11.5, 7.3, 5.8, 6.4, 10, 11.2, 11.2, 5.2, 7, ... 15.2, 21.5, 17.6, 9.7, 14.5, 10, 8.2, 9.4, 16.5, 9.7 ... ]) >>> medium_dose = np.array([ ... 16.5, 16.5, 15.2, 17.3, 22.5, 17.3, 13.6, 14.5, 18.8, 15.5, ... 19.7, 23.3, 23.6, 26.4, 20, 25.2, 25.8, 21.2, 14.5, 27.3 ... ]) >>> large_dose = np.array([ ... 23.6, 18.5, 33.9, 25.5, 26.4, 32.5, 26.7, 21.5, 23.3, 29.5, ... 25.5, 26.4, 22.4, 24.5, 24.8, 30.9, 26.4, 27.3, 29.4, 23 ... ])bartlett统计量对样本之间的方差差异敏感。>>> from scipy import stats >>> res = stats.bartlett(small_dose, medium_dose, large_dose) >>> res.statistic 0.6654670663030519当方差差异较大时,统计量的值往往较高。
我们可以通过将统计量的观测值与零分布进行比较来测试组之间的方差不等性:零分布是在三组总体方差相等的零假设下得出的统计值的分布。
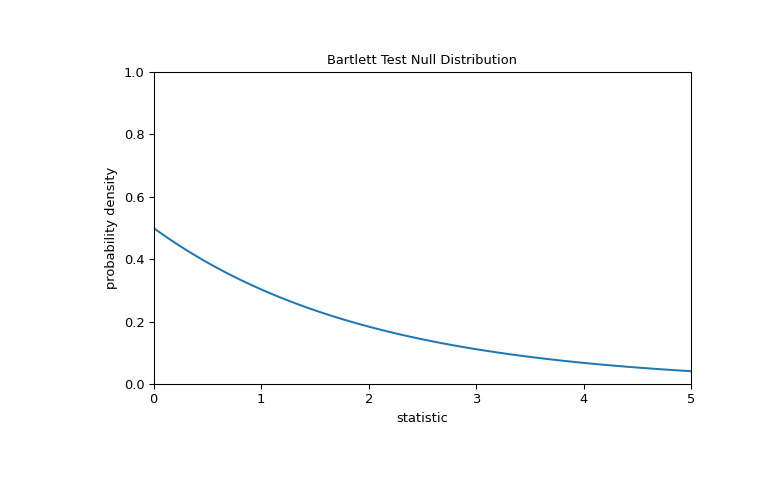
对于此检验,零分布遵循卡方分布,如下所示。
>>> import matplotlib.pyplot as plt
>>> k = 3  # number of samples
>>> dist = stats.chi2(df=k-1)
>>> val = np.linspace(0, 5, 100)
>>> pdf = dist.pdf(val)
>>> fig, ax = plt.subplots(figsize=(8, 5))
>>> def plot(ax):  # we'll re-use this
...     ax.plot(val, pdf, color='C0')
...     ax.set_title("Bartlett Test Null Distribution")
...     ax.set_xlabel("statistic")
...     ax.set_ylabel("probability density")
...     ax.set_xlim(0, 5)
...     ax.set_ylim(0, 1)
>>> plot(ax)
>>> plt.show()
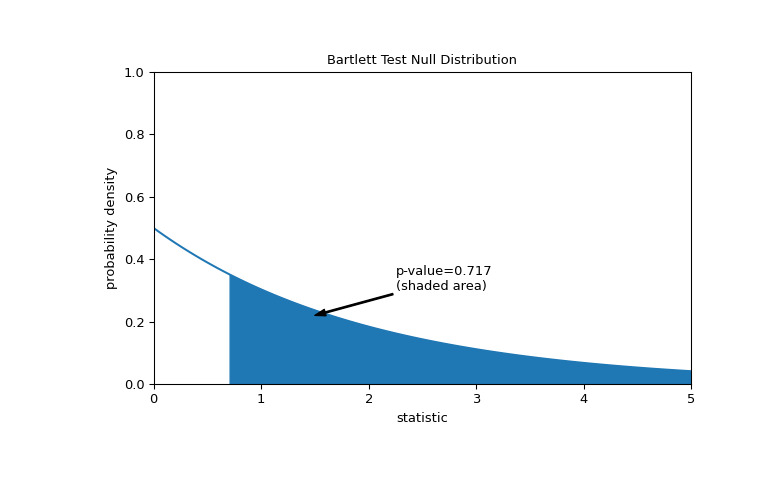
比较通过 p 值进行量化:零分布中大于或等于统计观测值的值的比例。
>>> fig, ax = plt.subplots(figsize=(8, 5))
>>> plot(ax)
>>> pvalue = dist.sf(res.statistic)
>>> annotation = (f'p-value={pvalue:.3f}\n(shaded area)')
>>> props = dict(facecolor='black', width=1, headwidth=5, headlength=8)
>>> _ = ax.annotate(annotation, (1.5, 0.22), (2.25, 0.3), arrowprops=props)
>>> i = val >= res.statistic
>>> ax.fill_between(val[i], y1=0, y2=pdf[i], color='C0')
>>> plt.show()
>>> res.pvalue
0.71696121509966
如果 p 值为 “small” - 也就是说,如果从具有相同方差的分布中采样数据产生统计量极值的概率较低 - 这可以作为反对零假设的证据另一种选择:各组的方差不相等。注意:
反之则不成立;也就是说,检验不用于为原假设提供证据。
将被视为“small”的值的阈值是在分析数据之前应做出的选择[6],同时考虑误报(错误地拒绝零假设)和漏报(未能拒绝假设)的风险。错误的原假设)。
p 值小并不能证明效果大;相反,它们只能为 “significant” 效应提供证据,这意味着它们不太可能在原假设下发生。
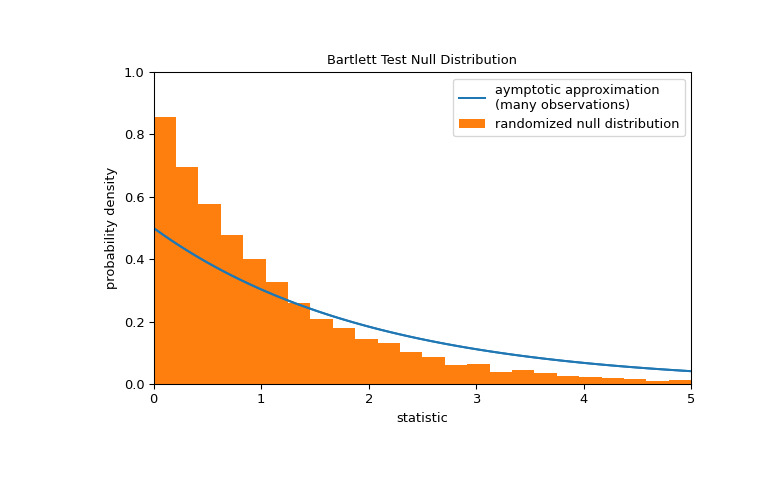
请注意,当观测值呈正态分布时,卡方分布提供零分布。对于从非正态总体中抽取的小样本,执行排列检验可能更合适:在所有三个样本均从同一总体中抽取的零假设下,每个测量值在任何一个中观察到的可能性是相同的。三个样本。因此,我们可以通过计算将观测值划分为三个样本的许多 randomly-generated 下的统计量来形成随机零分布。
>>> def statistic(*samples):
...     return stats.bartlett(*samples).statistic
>>> ref = stats.permutation_test(
...     (small_dose, medium_dose, large_dose), statistic,
...     permutation_type='independent', alternative='greater'
... )
>>> fig, ax = plt.subplots(figsize=(8, 5))
>>> plot(ax)
>>> bins = np.linspace(0, 5, 25)
>>> ax.hist(
...     ref.null_distribution, bins=bins, density=True, facecolor="C1"
... )
>>> ax.legend(['aymptotic approximation\n(many observations)',
...            'randomized null distribution'])
>>> plot(ax)
>>> plt.show()
>>> ref.pvalue  # randomized test p-value
0.5387  # may vary
请注意,此处计算的 p 值与上面
bartlett返回的渐近近似值之间存在显著差异。从排列检验中严格得出的统计推论是有限的;尽管如此,在许多情况下它们可能是首选方法 [7]。以下是另一个一般示例,其中原假设将被拒绝。
测试列表 a、b 和 c 是否来自具有相等方差的总体。
>>> a = [8.88, 9.12, 9.04, 8.98, 9.00, 9.08, 9.01, 8.85, 9.06, 8.99]
>>> b = [8.88, 8.95, 9.29, 9.44, 9.15, 9.58, 8.36, 9.18, 8.67, 9.05]
>>> c = [8.95, 9.12, 8.95, 8.85, 9.03, 8.84, 9.07, 8.98, 8.86, 8.98]
>>> stat, p = stats.bartlett(a, b, c)
>>> p
1.1254782518834628e-05
非常小的 p 值表明总体方差不相等。
这并不奇怪,因为 b 的样本方差远大于 a 和 c 的样本方差:
>>> [np.var(x, ddof=1) for x in [a, b, c]]
[0.007054444444444413, 0.13073888888888888, 0.008890000000000002]
相关用法
- Python SciPy stats.barnard_exact用法及代码示例
- Python SciPy stats.bayes_mvs用法及代码示例
- Python SciPy stats.boltzmann用法及代码示例
- Python SciPy stats.brunnermunzel用法及代码示例
- Python SciPy stats.betaprime用法及代码示例
- Python SciPy stats.betabinom用法及代码示例
- Python SciPy stats.boxcox_normplot用法及代码示例
- Python SciPy stats.boxcox用法及代码示例
- Python SciPy stats.binned_statistic_2d用法及代码示例
- Python SciPy stats.binned_statistic用法及代码示例
- Python SciPy stats.boxcox_normmax用法及代码示例
- Python SciPy stats.burr12用法及代码示例
- Python SciPy stats.boschloo_exact用法及代码示例
- Python SciPy stats.bootstrap用法及代码示例
- Python SciPy stats.binom用法及代码示例
- Python SciPy stats.burr用法及代码示例
- Python SciPy stats.bws_test用法及代码示例
- Python SciPy stats.beta用法及代码示例
- Python SciPy stats.bradford用法及代码示例
- Python SciPy stats.binomtest用法及代码示例
- Python SciPy stats.binned_statistic_dd用法及代码示例
- Python SciPy stats.boxcox_llf用法及代码示例
- Python SciPy stats.binom_test用法及代码示例
- Python SciPy stats.bernoulli用法及代码示例
- Python SciPy stats.anderson用法及代码示例
注:本文由纯净天空筛选整理自scipy.org大神的英文原创作品 scipy.stats.bartlett。非经特殊声明,原始代码版权归原作者所有,本译文未经允许或授权,请勿转载或复制。
