本文简要介绍 python 语言中 scipy.stats.binned_statistic_dd 的用法。
用法:
scipy.stats.binned_statistic_dd(sample, values, statistic='mean', bins=10, range=None, expand_binnumbers=False, binned_statistic_result=None)#计算一组数据的多维分箱统计量。
这是 histogramdd 函数的概括。直方图将空间划分为多个 bin,并返回每个 bin 中的点数。此函数允许计算每个 bin 内的值的总和、平均值、中位数或其他统计量。
- sample: array_like
直方图的数据作为长度为 D 的 N 个数组的序列或作为 (N,D) 数组传递。
- values: (N,) 数组 或 (N,) 数组 列表
将根据其计算统计数据的数据。这必须与样本的形状相同,或者是一个序列列表——每个序列的形状都与样本相同。如果 values 是这样一个列表,则将独立计算每个值的统计信息。
- statistic: 字符串或可调用,可选
要计算的统计数据(默认为‘mean’)。可用的统计数据如下:
‘mean’ : compute the mean of values for points within each bin. Empty bins will be represented by NaN.
‘median’ : compute the median of values for points within each bin. Empty bins will be represented by NaN.
‘count’ : compute the count of points within each bin. This is identical to an unweighted histogram. values array is not referenced.
‘sum’ : compute the sum of values for points within each bin. This is identical to a weighted histogram.
‘std’ : compute the standard deviation within each bin. This is implicitly calculated with ddof=0. If the number of values within a given bin is 0 or 1, the computed standard deviation value will be 0 for the bin.
‘min’ : compute the minimum of values for points within each bin. Empty bins will be represented by NaN.
‘max’ : compute the maximum of values for point within each bin. Empty bins will be represented by NaN.
function : a user-defined function which takes a 1D array of values, and outputs a single numerical statistic. This function will be called on the values in each bin. Empty bins will be represented by function([]), or NaN if this returns an error.
- bins: 序列或正整数,可选
bin 规范必须采用以下形式之一:
A sequence of arrays describing the bin edges along each dimension.
The number of bins for each dimension (nx, ny, … = bins).
The number of bins for all dimensions (nx = ny = … = bins).
- range: 顺序,可选
如果边没有在 bin 中明确给出,则使用一系列较低和较高的 bin 边。默认为每个维度的最小值和最大值。
- expand_binnumbers: 布尔型,可选
‘False’(默认):返回的二进制数是线性化 bin 索引的形状 (N,) 数组。 ‘True’:返回的二进制数将 ‘unraveled’ 转换为形状 (D,N) ndarray,其中每一行给出相应维度中的 bin 编号。见二进制数返回值,以及例子部分scipy.stats.binned_statistic_2d.
- binned_statistic_result: binnedStatisticddResult
先前调用函数的结果,以便重新使用具有新值和/或不同统计信息的 bin 边和 bin 编号。要重复使用 bin 编号,expand_binnumbers 必须已设置为 False(默认值)
- statistic: ndarray,形状(nx1,nx2,nx3,…)
每个二维 bin 中所选统计数据的值。
- bin_edges: ndarrays 列表
说明每个维度的 (nxi + 1) 个 bin 边的 D 数组列表。
- binnumber: (N,) 整数数组或 (D,N) 整数数组
这会为样本的每个元素分配一个整数,该整数表示该观测值所在的 bin。表示取决于expand_binnumbers 参数。有关详细信息,请参阅注释。
参数 ::
返回 ::
注意:
Binedges:除了最后一个 (righthand-most) bin,所有的 bin 在每个维度上都是半开的。换句话说,如果箱子是
[1, 2, 3, 4],那么第一个 bin 是[1, 2)(包括1个,但不包括2个)和第二个[2, 3).然而,最后一个箱子是[3, 4], 哪一个包括 4.binnumber:这个返回的参数为 sample 的每个元素分配一个整数,表示它所属的 bin。表示取决于expand_binnumbers 参数。如果“False”(默认):返回的 binnumber 是一个线性化索引的形状 (N,) 数组,将样本的每个元素映射到其对应的 bin(使用行优先排序)。如果“真”:返回的 binnumber 是一个形状 (D,N) ndarray,其中每一行分别表示每个维度的 bin 位置。在每个维度中,i 的 bin 数表示对应的值在 (bin_edges[D][i-1], bin_edges[D][i]) 之间,对于每个维度“D”。
例子:
>>> import numpy as np
>>> from scipy import stats
>>> import matplotlib.pyplot as plt
>>> from mpl_toolkits.mplot3d import Axes3D
以一个 600 (x, y) 坐标的数组为例。
binned_statistic_dd可以处理更高维度的数组D.但是一个维度的情节D+1是必须的。>>> mu = np.array([0., 1.]) >>> sigma = np.array([[1., -0.5],[-0.5, 1.5]]) >>> multinormal = stats.multivariate_normal(mu, sigma) >>> data = multinormal.rvs(size=600, random_state=235412) >>> data.shape (600, 2)创建 bin 并计算每个 bin 中有多少数组:
>>> N = 60
>>> x = np.linspace(-3, 3, N)
>>> y = np.linspace(-3, 4, N)
>>> ret = stats.binned_statistic_dd(data, np.arange(600), bins=[x, y],
...                                 statistic='count')
>>> bincounts = ret.statistic
设置条形的音量和位置:
>>> dx = x[1] - x[0]
>>> dy = y[1] - y[0]
>>> x, y = np.meshgrid(x[:-1]+dx/2, y[:-1]+dy/2)
>>> z = 0
>>> bincounts = bincounts.ravel() >>> x = x.ravel() >>> y = y.ravel()>>> fig = plt.figure() >>> ax = fig.add_subplot(111, projection='3d') >>> with np.errstate(divide='ignore'): # silence random axes3d warning ... ax.bar3d(x, y, z, dx, dy, bincounts)使用新值重用 bin 编号和 bin 边:
>>> ret2 = stats.binned_statistic_dd(data, -np.arange(600),
...                                  binned_statistic_result=ret,
...                                  statistic='mean')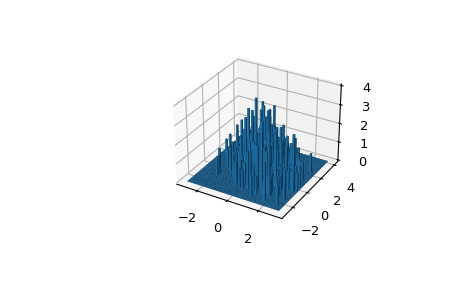
相关用法
- Python SciPy stats.binned_statistic_2d用法及代码示例
- Python SciPy stats.binned_statistic用法及代码示例
- Python SciPy stats.binom用法及代码示例
- Python SciPy stats.binomtest用法及代码示例
- Python SciPy stats.binom_test用法及代码示例
- Python SciPy stats.bartlett用法及代码示例
- Python SciPy stats.boltzmann用法及代码示例
- Python SciPy stats.brunnermunzel用法及代码示例
- Python SciPy stats.betaprime用法及代码示例
- Python SciPy stats.betabinom用法及代码示例
- Python SciPy stats.boxcox_normplot用法及代码示例
- Python SciPy stats.boxcox用法及代码示例
- Python SciPy stats.bayes_mvs用法及代码示例
- Python SciPy stats.boxcox_normmax用法及代码示例
- Python SciPy stats.burr12用法及代码示例
- Python SciPy stats.boschloo_exact用法及代码示例
- Python SciPy stats.bootstrap用法及代码示例
- Python SciPy stats.burr用法及代码示例
- Python SciPy stats.bws_test用法及代码示例
- Python SciPy stats.beta用法及代码示例
- Python SciPy stats.bradford用法及代码示例
- Python SciPy stats.boxcox_llf用法及代码示例
- Python SciPy stats.bernoulli用法及代码示例
- Python SciPy stats.barnard_exact用法及代码示例
- Python SciPy stats.anderson用法及代码示例
注:本文由纯净天空筛选整理自scipy.org大神的英文原创作品 scipy.stats.binned_statistic_dd。非经特殊声明,原始代码版权归原作者所有,本译文未经允许或授权,请勿转载或复制。