本文简要介绍 python 语言中 scipy.stats.binned_statistic 的用法。
用法:
scipy.stats.binned_statistic(x, values, statistic='mean', bins=10, range=None)#计算一组或多组数据的分箱统计量。
这是直方图函数的推广。直方图将空间划分为多个 bin,并返回每个 bin 中的点数。此函数允许计算每个 bin 内的值(或值集)的总和、平均值、中位数或其他统计量。
- x: (N,) 数组
要分箱的一系列值。
- values: (N,) 数组 或 (N,) 数组 列表
将根据其计算统计数据的数据。这必须与 x 具有相同的形状,或者是一组序列 - 每个都与 x 具有相同的形状。如果 values 是一组序列,则将独立计算每个序列的统计量。
- statistic: 字符串或可调用,可选
要计算的统计数据(默认为‘mean’)。可用的统计数据如下:
‘mean’ : compute the mean of values for points within each bin. Empty bins will be represented by NaN.
‘std’ : compute the standard deviation within each bin. This is implicitly calculated with ddof=0.
‘median’ : compute the median of values for points within each bin. Empty bins will be represented by NaN.
‘count’ : compute the count of points within each bin. This is identical to an unweighted histogram. values array is not referenced.
‘sum’ : compute the sum of values for points within each bin. This is identical to a weighted histogram.
‘min’ : compute the minimum of values for points within each bin. Empty bins will be represented by NaN.
‘max’ : compute the maximum of values for point within each bin. Empty bins will be represented by NaN.
function : a user-defined function which takes a 1D array of values, and outputs a single numerical statistic. This function will be called on the values in each bin. Empty bins will be represented by function([]), or NaN if this returns an error.
- bins: int 或标量序列,可选
如果箱子是一个 int,它定义了给定范围内的equal-width bin 的数量(默认为 10)。如果箱子是一个序列,它定义了 bin 边,包括最右边的边,允许不均匀的 bin 宽度。值x小于最低 bin 边的被分配给 bin 编号 0,超出最高 bin 的值被分配给
bins[-1].如果指定了 bin 边,则 bin 的数量将为 (nx = len(bins)-1)。- range: (float, float) 或 [(float, float)], 可选
bin 的下限和上限范围。如果未提供,范围只是
(x.min(), x.max())。超出范围的值将被忽略。
- statistic: 数组
每个 bin 中所选统计数据的值。
- bin_edges: dtype 浮点数组
返回 bin 边
(length(statistic)+1)。- binnumber:一维整数数组
x 的每个值所属的 bin 的索引(对应于bin_edges)。与值的长度相同。 binnumber 为 i 表示对应的值介于 (bin_edges[i-1], bin_edges[i]) 之间。
参数 ::
返回 ::
注意:
除了最后一个 (righthand-most) 箱子之外的所有箱子都是半开的。换句话说,如果箱子是
[1, 2, 3, 4],那么第一个 bin 是[1, 2)(包括1个,但不包括2个)和第二个[2, 3).然而,最后一个箱子是[3, 4], 哪一个包括 4.例子:
>>> import numpy as np
>>> from scipy import stats
>>> import matplotlib.pyplot as plt
首先是一些基本的例子:
在给定样本的范围内创建两个均匀间隔的 bin,并对每个 bin 中的相应值求和:
>>> values = [1.0, 1.0, 2.0, 1.5, 3.0]
>>> stats.binned_statistic([1, 1, 2, 5, 7], values, 'sum', bins=2)
BinnedStatisticResult(statistic=array([4. , 4.5]),
        bin_edges=array([1., 4., 7.]), binnumber=array([1, 1, 1, 2, 2]))
也可以传递多个值数组。统计量是在每个集合上独立计算的:
>>> values = [[1.0, 1.0, 2.0, 1.5, 3.0], [2.0, 2.0, 4.0, 3.0, 6.0]]
>>> stats.binned_statistic([1, 1, 2, 5, 7], values, 'sum', bins=2)
BinnedStatisticResult(statistic=array([[4. , 4.5],
       [8. , 9. ]]), bin_edges=array([1., 4., 7.]),
       binnumber=array([1, 1, 1, 2, 2]))
>>> stats.binned_statistic([1, 2, 1, 2, 4], np.arange(5), statistic='mean', ... bins=3) BinnedStatisticResult(statistic=array([1., 2., 4.]), bin_edges=array([1., 2., 3., 4.]), binnumber=array([1, 2, 1, 2, 3]))作为第二个例子,我们现在生成一些作为风速函数的帆船速度的随机数据,然后确定我们的船在特定风速下的速度:
>>> rng = np.random.default_rng()
>>> windspeed = 8 * rng.random(500)
>>> boatspeed = .3 * windspeed**.5 + .2 * rng.random(500)
>>> bin_means, bin_edges, binnumber = stats.binned_statistic(windspeed,
...                 boatspeed, statistic='median', bins=[1,2,3,4,5,6,7])
>>> plt.figure()
>>> plt.plot(windspeed, boatspeed, 'b.', label='raw data')
>>> plt.hlines(bin_means, bin_edges[:-1], bin_edges[1:], colors='g', lw=5,
...            label='binned statistic of data')
>>> plt.legend()
现在我们可以使用
binnumber来选择风速低于 1 的所有数据点:>>> low_boatspeed = boatspeed[binnumber == 0]作为最后一个示例,我们将使用
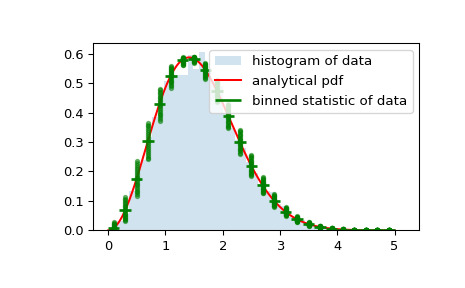
bin_edges和binnumber在常规直方图和概率分布函数之上绘制一个分布图,显示每个 bin 的平均值和围绕该平均值的分布:>>> x = np.linspace(0, 5, num=500) >>> x_pdf = stats.maxwell.pdf(x) >>> samples = stats.maxwell.rvs(size=10000)>>> bin_means, bin_edges, binnumber = stats.binned_statistic(x, x_pdf, ... statistic='mean', bins=25) >>> bin_width = (bin_edges[1] - bin_edges[0]) >>> bin_centers = bin_edges[1:] - bin_width/2>>> plt.figure() >>> plt.hist(samples, bins=50, density=True, histtype='stepfilled', ... alpha=0.2, label='histogram of data') >>> plt.plot(x, x_pdf, 'r-', label='analytical pdf') >>> plt.hlines(bin_means, bin_edges[:-1], bin_edges[1:], colors='g', lw=2, ... label='binned statistic of data') >>> plt.plot((binnumber - 0.5) * bin_width, x_pdf, 'g.', alpha=0.5) >>> plt.legend(fontsize=10) >>> plt.show()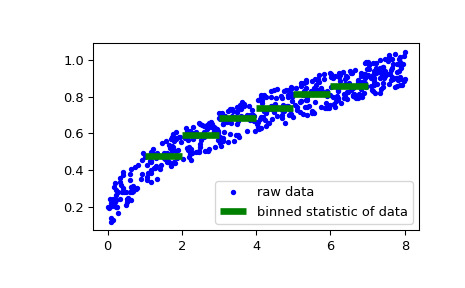
相关用法
- Python SciPy stats.binned_statistic_2d用法及代码示例
- Python SciPy stats.binned_statistic_dd用法及代码示例
- Python SciPy stats.binom用法及代码示例
- Python SciPy stats.binomtest用法及代码示例
- Python SciPy stats.binom_test用法及代码示例
- Python SciPy stats.bartlett用法及代码示例
- Python SciPy stats.boltzmann用法及代码示例
- Python SciPy stats.brunnermunzel用法及代码示例
- Python SciPy stats.betaprime用法及代码示例
- Python SciPy stats.betabinom用法及代码示例
- Python SciPy stats.boxcox_normplot用法及代码示例
- Python SciPy stats.boxcox用法及代码示例
- Python SciPy stats.bayes_mvs用法及代码示例
- Python SciPy stats.boxcox_normmax用法及代码示例
- Python SciPy stats.burr12用法及代码示例
- Python SciPy stats.boschloo_exact用法及代码示例
- Python SciPy stats.bootstrap用法及代码示例
- Python SciPy stats.burr用法及代码示例
- Python SciPy stats.bws_test用法及代码示例
- Python SciPy stats.beta用法及代码示例
- Python SciPy stats.bradford用法及代码示例
- Python SciPy stats.boxcox_llf用法及代码示例
- Python SciPy stats.bernoulli用法及代码示例
- Python SciPy stats.barnard_exact用法及代码示例
- Python SciPy stats.anderson用法及代码示例
注:本文由纯净天空筛选整理自scipy.org大神的英文原创作品 scipy.stats.binned_statistic。非经特殊声明,原始代码版权归原作者所有,本译文未经允许或授权,请勿转载或复制。