本文简要介绍 python 语言中 scipy.stats.linregress 的用法。
用法:
scipy.stats.linregress(x, y=None, alternative='two-sided')#计算两组测量值的线性最小二乘回归。
- x, y: array_like
两组测量。两个数组应该具有相同的长度。要是x给出(和
y=None),那么它必须是一个二维数组,其中一维的长度为 2。然后通过沿长度为 2 的维度拆分数组来找到两组测量值。在这种情况下y=None和x是一个 2x2 数组,linregress(x)相当于linregress(x[0], x[1]).- alternative: {‘双面’,‘less’, ‘greater’},可选
定义备择假设。默认为“双面”。可以使用以下选项:
“双面”:回归线的斜率不为零
‘less’:回归线的斜率小于零
‘greater’:回归线的斜率大于零
- result:
LinregressResult实例 返回值是一个具有以下属性的对象:
- 坡 浮点数
回归线的斜率。
- 截距 浮点数
回归线的截距。
- 右值 浮点数
皮尔逊相关系数。
rvalue的平方等于决定系数。- p值 浮点数
假设检验的 p 值,其原假设是斜率为零,使用带有检验统计量 t 分布的 Wald 检验。有关替代假设,请参阅上面的替代方案。
- 标准错误 浮点数
在残差正态性假设下,估计斜率(梯度)的标准误差。
- intercept_stderr 浮点数
在残差正态性假设下,估计截距的标准误差。
- result:
参数 ::
返回 ::
注意:
缺失值被视为成对的:如果 x 中缺失某个值,则 y 中的对应值将被屏蔽。
为了与旧版本的 SciPy 兼容,返回值的作用类似于长度为 5 的
namedtuple,带有字段slope、intercept、rvalue、pvalue和stderr,因此可以继续编写:slope, intercept, r, p, se = linregress(x, y)然而,使用这种风格,截距的标准误差不可用。要访问所有计算值,包括截距的标准误差,请将返回值用作具有属性的对象,例如:
result = linregress(x, y) print(result.intercept, result.intercept_stderr)例子:
>>> import numpy as np
>>> import matplotlib.pyplot as plt
>>> from scipy import stats
>>> rng = np.random.default_rng()
生成一些数据:
>>> x = rng.random(10)
>>> y = 1.6*x + rng.random(10)
执行线性回归:
>>> res = stats.linregress(x, y)确定系数(R-squared):
>>> print(f"R-squared: {res.rvalue**2:.6f}")
R-squared: 0.717533
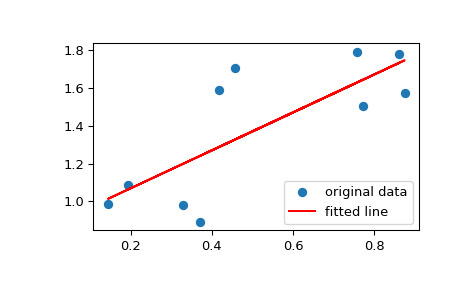
将数据与拟合线一起绘制:
>>> plt.plot(x, y, 'o', label='original data')
>>> plt.plot(x, res.intercept + res.slope*x, 'r', label='fitted line')
>>> plt.legend()
>>> plt.show()
计算斜率和截距的 95% 置信区间:
>>> # Two-sided inverse Students t-distribution
>>> # p - probability, df - degrees of freedom
>>> from scipy.stats import t
>>> tinv = lambda p, df: abs(t.ppf(p/2, df))
>>> ts = tinv(0.05, len(x)-2) >>> print(f"slope (95%): {res.slope:.6f} +/- {ts*res.stderr:.6f}") slope (95%): 1.453392 +/- 0.743465 >>> print(f"intercept (95%): {res.intercept:.6f}" ... f" +/- {ts*res.intercept_stderr:.6f}") intercept (95%): 0.616950 +/- 0.544475
相关用法
- Python SciPy stats.levy_stable用法及代码示例
- Python SciPy stats.lognorm用法及代码示例
- Python SciPy stats.logrank用法及代码示例
- Python SciPy stats.loglaplace用法及代码示例
- Python SciPy stats.laplace用法及代码示例
- Python SciPy stats.levy_l用法及代码示例
- Python SciPy stats.loguniform用法及代码示例
- Python SciPy stats.logistic用法及代码示例
- Python SciPy stats.levene用法及代码示例
- Python SciPy stats.levy用法及代码示例
- Python SciPy stats.logser用法及代码示例
- Python SciPy stats.loggamma用法及代码示例
- Python SciPy stats.lomax用法及代码示例
- Python SciPy stats.laplace_asymmetric用法及代码示例
- Python SciPy stats.anderson用法及代码示例
- Python SciPy stats.iqr用法及代码示例
- Python SciPy stats.genpareto用法及代码示例
- Python SciPy stats.skewnorm用法及代码示例
- Python SciPy stats.cosine用法及代码示例
- Python SciPy stats.norminvgauss用法及代码示例
- Python SciPy stats.directional_stats用法及代码示例
- Python SciPy stats.invwishart用法及代码示例
- Python SciPy stats.bartlett用法及代码示例
- Python SciPy stats.page_trend_test用法及代码示例
- Python SciPy stats.itemfreq用法及代码示例
注:本文由纯净天空筛选整理自scipy.org大神的英文原创作品 scipy.stats.linregress。非经特殊声明,原始代码版权归原作者所有,本译文未经允许或授权,请勿转载或复制。
