scale_x_continuous() 和 scale_y_continuous() 是连续 x 和 y 美学的默认比例。可以通过三种变体为常用转换设置 trans 参数: scale_*_log10() 、 scale_*_sqrt() 和 scale_*_reverse() 。
用法
scale_x_continuous(
  name = waiver(),
  breaks = waiver(),
  minor_breaks = waiver(),
  n.breaks = NULL,
  labels = waiver(),
  limits = NULL,
  expand = waiver(),
  oob = censor,
  na.value = NA_real_,
  trans = "identity",
  guide = waiver(),
  position = "bottom",
  sec.axis = waiver()
)

scale_y_continuous(
  name = waiver(),
  breaks = waiver(),
  minor_breaks = waiver(),
  n.breaks = NULL,
  labels = waiver(),
  limits = NULL,
  expand = waiver(),
  oob = censor,
  na.value = NA_real_,
  trans = "identity",
  guide = waiver(),
  position = "left",
  sec.axis = waiver()
)

scale_x_log10(...)

scale_y_log10(...)

scale_x_reverse(...)

scale_y_reverse(...)

scale_x_sqrt(...)

scale_y_sqrt(...)
参数
- name
-
秤的名称。用作轴或图例标题。如果
waiver()(默认值),则比例名称取自用于该美学的第一个映射。如果是NULL,则图例标题将被省略。 - breaks
-
之一:
-
NULL不间断 -
waiver()用于由 transformation object 计算的默认中断 -
位置的数值向量
-
将限制作为输入并返回中断作为输出的函数(例如
scales::extended_breaks()返回的函数)。还接受 rlang lambda 函数表示法。
-
- minor_breaks
-
之一:
- n.breaks
-
指导主要中断次数的整数。该算法可能会选择稍微不同的数字以确保良好的中断标签。仅在
breaks = waiver()时有效。使用NULL使用转换给出的默认中断数。 - labels
-
之一:
- limits
-
之一:
-
NULL使用默认比例范围 -
长度为 2 的数值向量,提供尺度限制。使用
NA来引用现有的最小值或最大值 -
接受现有(自动)限制并返回新限制的函数。还接受 rlang lambda 函数表示法。请注意,对位置比例设置限制将删除限制之外的数据。如果目的是缩放,请使用坐标系中的 limit 参数(请参阅
coord_cartesian())。
-
- expand
-
对于位置刻度,范围扩展常量的向量,用于在数据周围添加一些填充,以确保它们放置在距轴一定距离的位置。使用便捷函数
expansion()生成expand参数的值。默认情况下,对于连续变量,每侧扩展 5%,对于离散变量,每侧扩展 0.6 个单位。 - oob
-
之一:
-
处理超出范围限制(越界)的函数。还接受 rlang lambda 函数表示法。
-
默认值 (
scales::censor()) 将超出范围的值替换为NA。 -
scales::squish()用于将超出范围的值压缩到范围内。 -
scales::squish_infinite()用于将无限值压缩到范围内。
-
- na.value
-
缺失值将替换为该值。
- trans
-
对于连续比例,变换对象的名称或对象本身。内置转换包括"asn"、"atanh"、"boxcox"、"date"、"exp"、"hms"、"identity"、"log"、"log10"、"log1p","log2","logit"、"modulus"、"probability"、"probit"、"pseudo_log"、"reciprocal"、"reverse"、"sqrt" 和 "time"。
变换对象将变换、其逆变换以及用于生成中断和标签的方法捆绑在一起。转换对象在 scales 包中定义,称为
<name>_trans(例如scales::boxcox_trans())。您可以使用scales::trans_new()创建自己的转换。 - guide
-
用于创建指南或其名称的函数。有关详细信息,请参阅
guides()。 - position
-
对于位置刻度,轴的位置。
left或right表示 y 轴,top或bottom表示 x 轴。 - sec.axis
-
sec_axis()用于指定辅助轴。 - ...
-
其他参数传递给
scale_(x|y)_continuous()
也可以看看
其他位置刻度:scale_x_binned()、scale_x_date()、scale_x_discrete()
例子
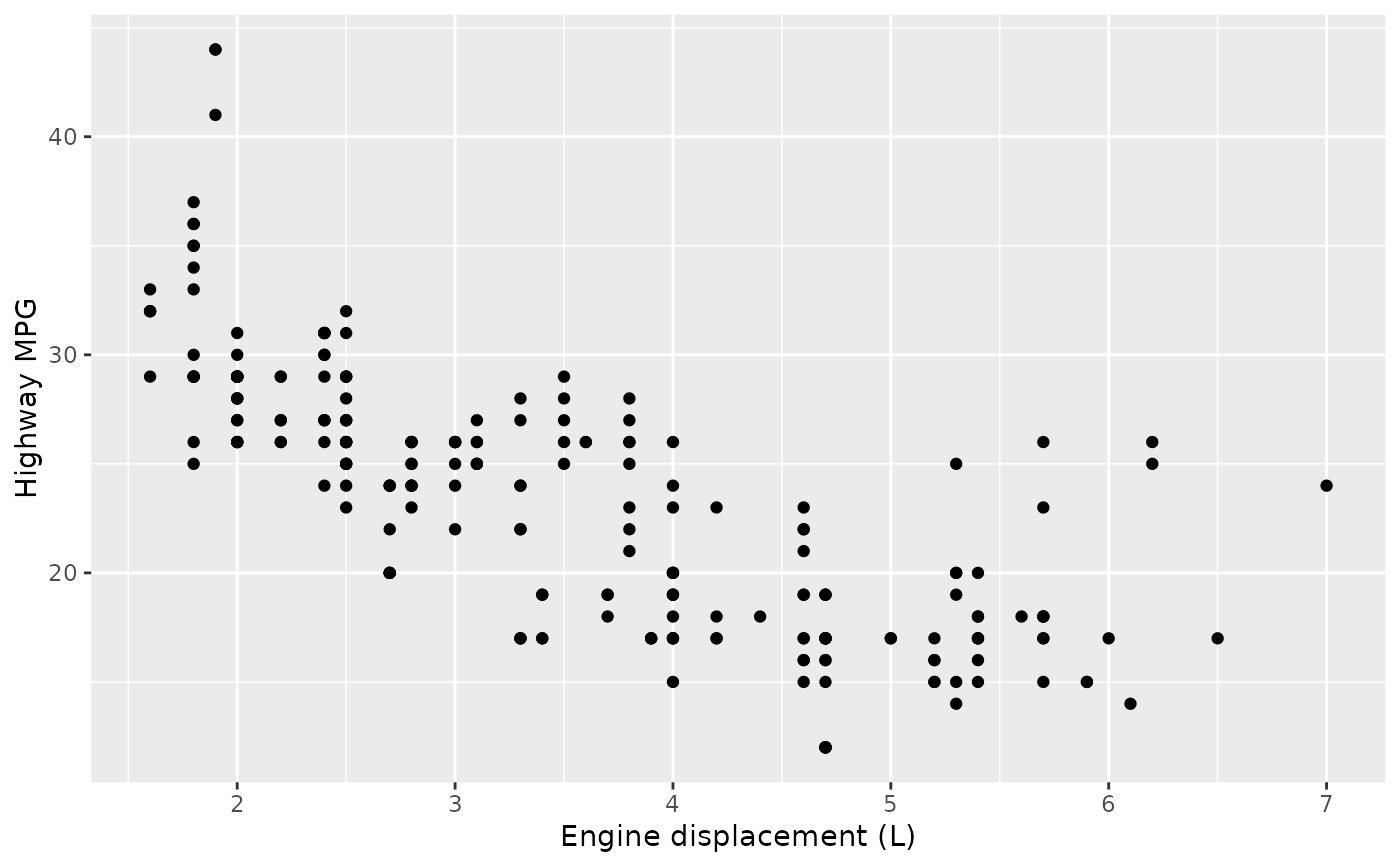
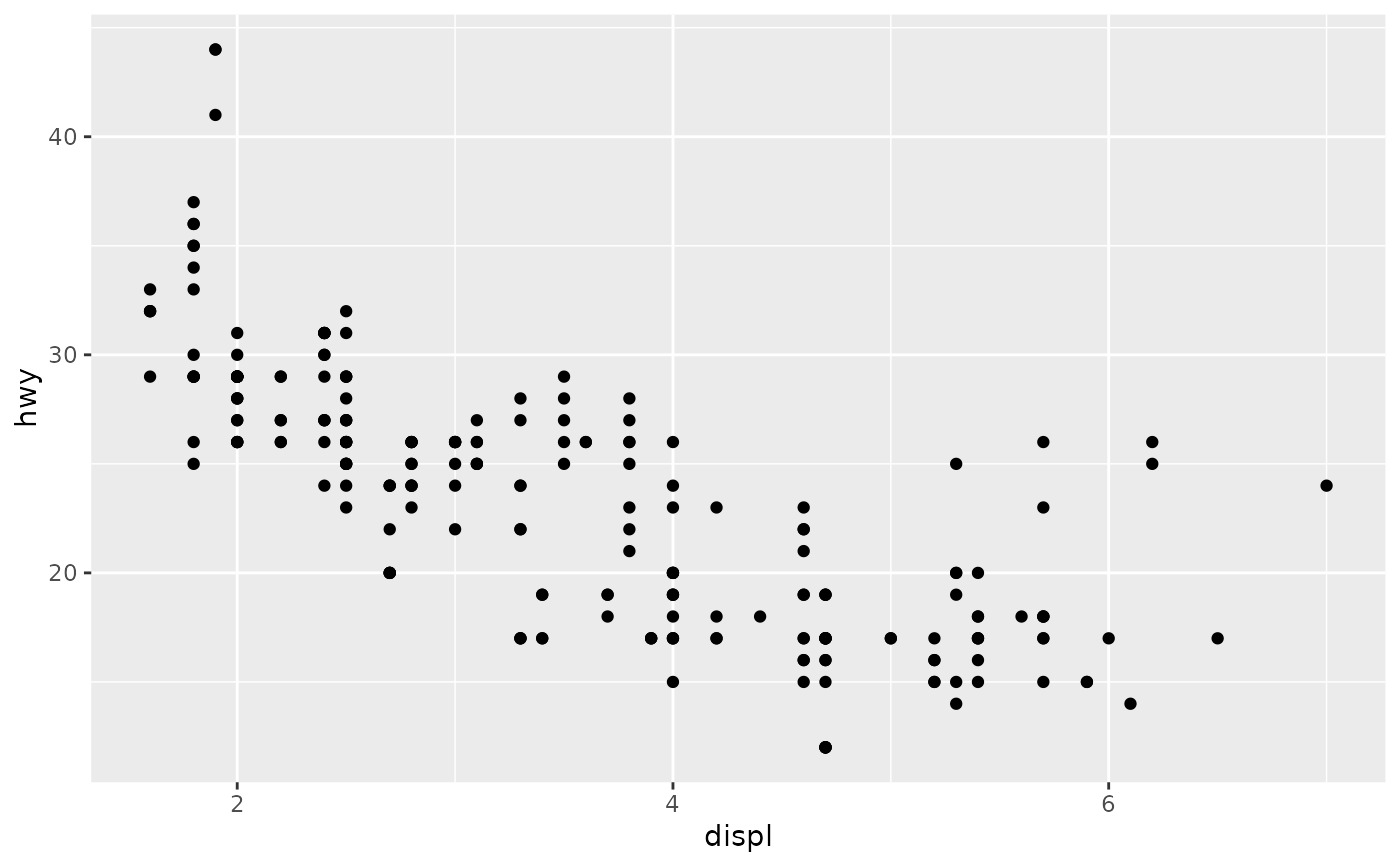
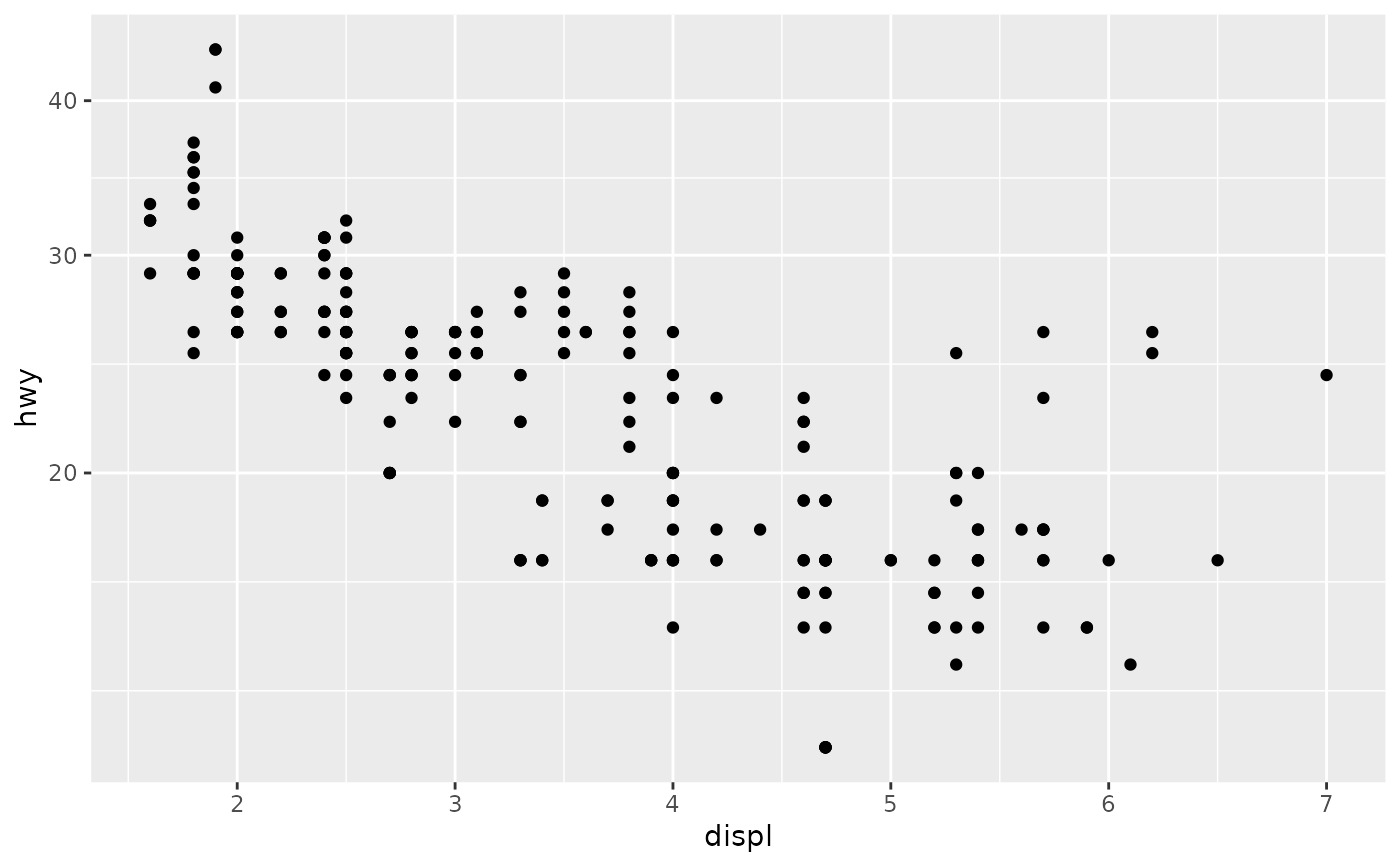
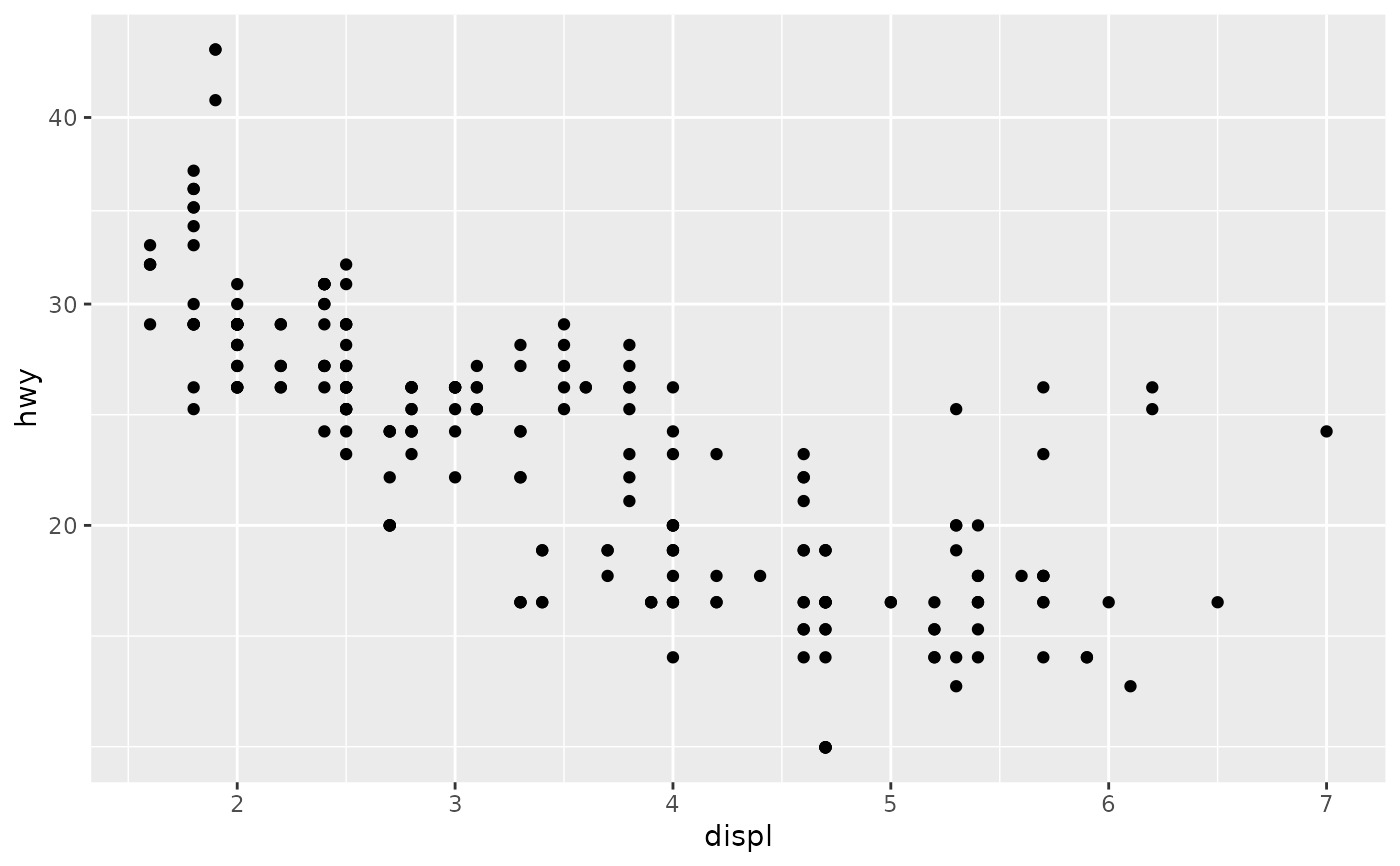
p1 <- ggplot(mpg, aes(displ, hwy)) +
geom_point()
p1
 # Manipulating the default position scales lets you:
# * change the axis labels
p1 +
scale_x_continuous("Engine displacement (L)") +
scale_y_continuous("Highway MPG")
# Manipulating the default position scales lets you:
# * change the axis labels
p1 +
scale_x_continuous("Engine displacement (L)") +
scale_y_continuous("Highway MPG")
 # You can also use the short-cut labs().
# Use NULL to suppress axis labels
p1 + labs(x = NULL, y = NULL)
# You can also use the short-cut labs().
# Use NULL to suppress axis labels
p1 + labs(x = NULL, y = NULL)
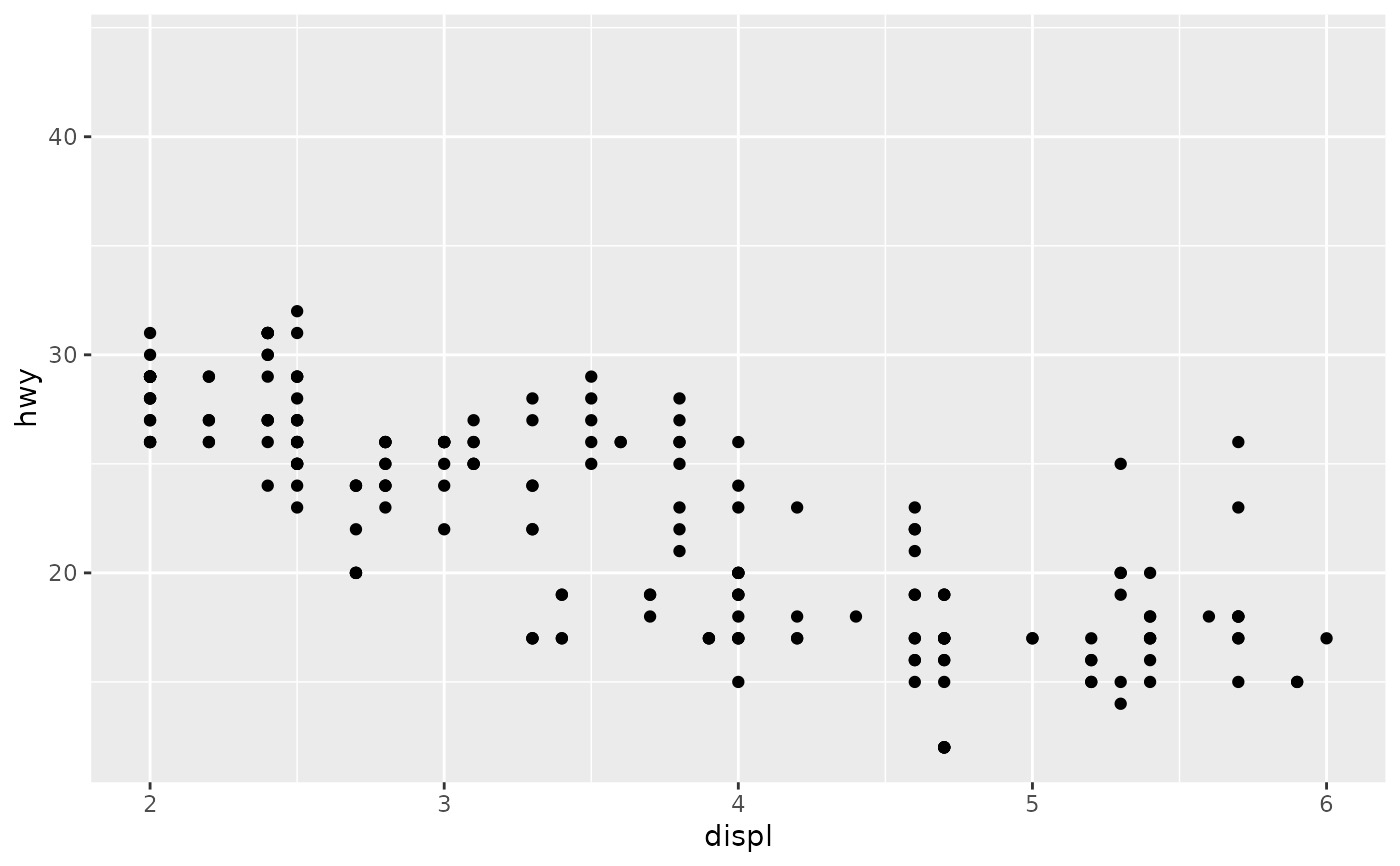
 # * modify the axis limits
p1 + scale_x_continuous(limits = c(2, 6))
#> Warning: Removed 27 rows containing missing values (`geom_point()`).
# * modify the axis limits
p1 + scale_x_continuous(limits = c(2, 6))
#> Warning: Removed 27 rows containing missing values (`geom_point()`).
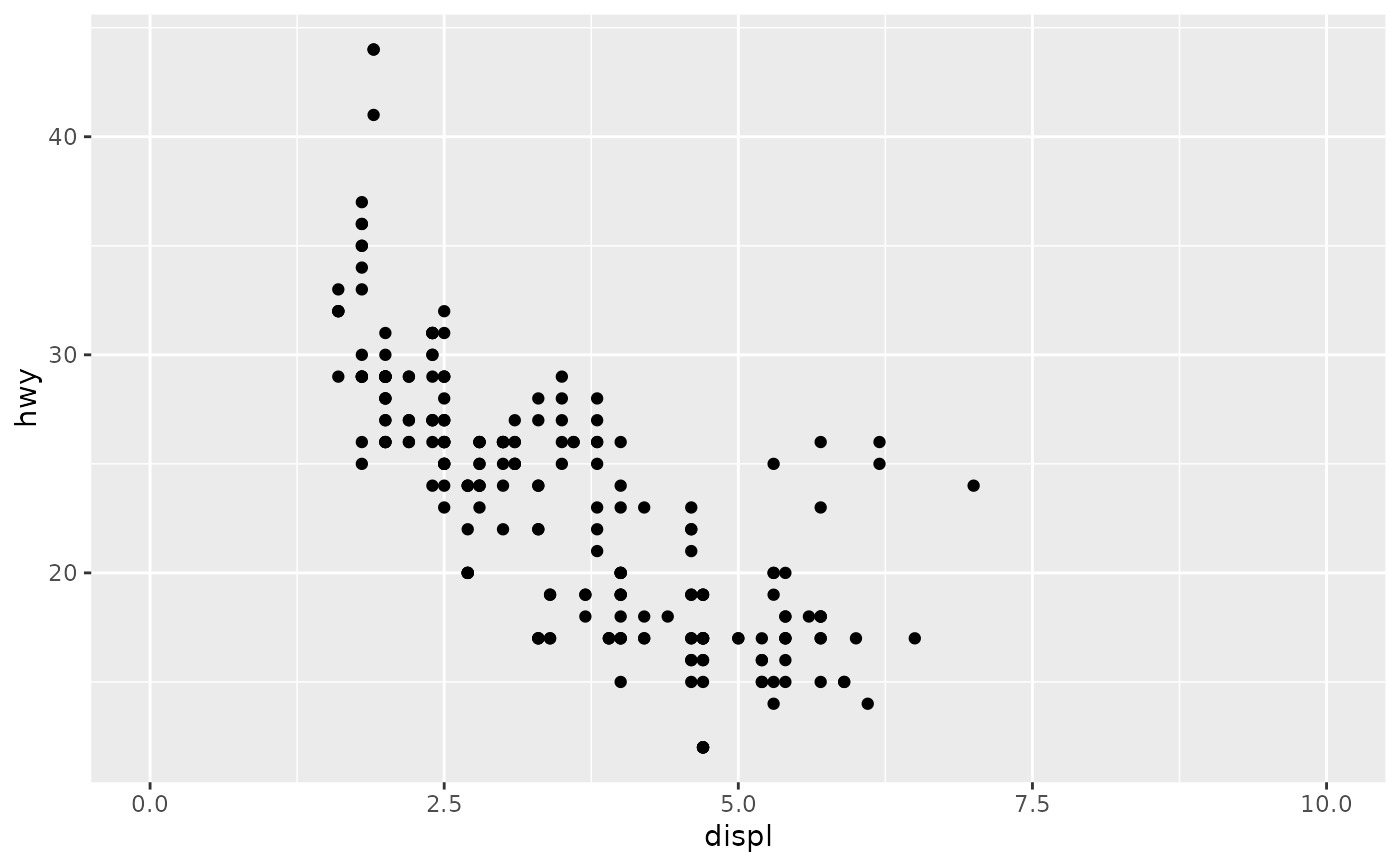
 p1 + scale_x_continuous(limits = c(0, 10))
 # you can also use the short hand functions `xlim()` and `ylim()`
p1 + xlim(2, 6)
#> Warning: Removed 27 rows containing missing values (`geom_point()`).
# you can also use the short hand functions `xlim()` and `ylim()`
p1 + xlim(2, 6)
#> Warning: Removed 27 rows containing missing values (`geom_point()`).
 # * choose where the ticks appear
p1 + scale_x_continuous(breaks = c(2, 4, 6))
# * choose where the ticks appear
p1 + scale_x_continuous(breaks = c(2, 4, 6))
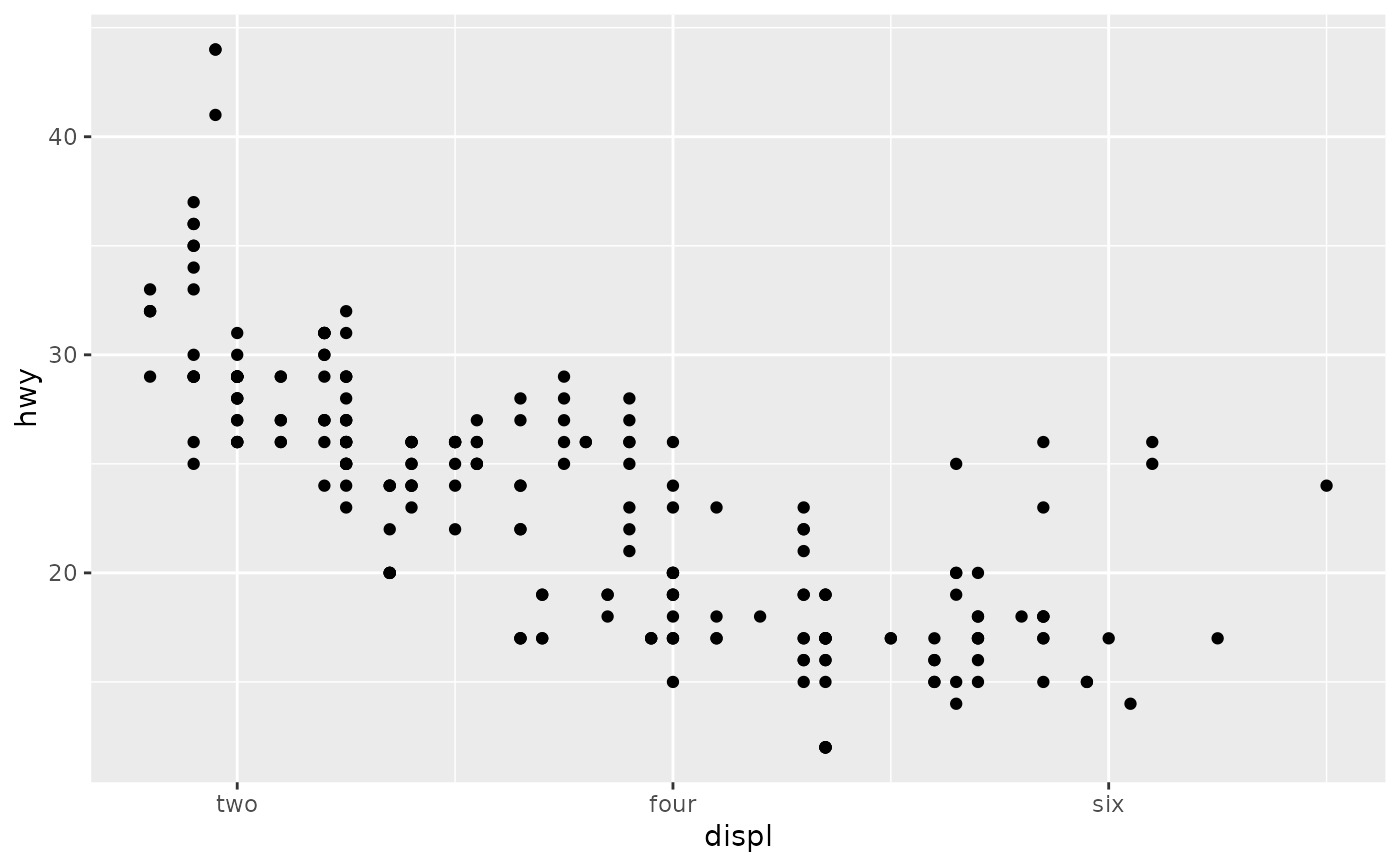
 # * choose your own labels
p1 + scale_x_continuous(
breaks = c(2, 4, 6),
label = c("two", "four", "six")
)
# * choose your own labels
p1 + scale_x_continuous(
breaks = c(2, 4, 6),
label = c("two", "four", "six")
)
 # Typically you'll pass a function to the `labels` argument.
# Some common formats are built into the scales package:
set.seed(1)
df <- data.frame(
x = rnorm(10) * 100000,
y = seq(0, 1, length.out = 10)
)
p2 <- ggplot(df, aes(x, y)) + geom_point()
p2 + scale_y_continuous(labels = scales::percent)
# Typically you'll pass a function to the `labels` argument.
# Some common formats are built into the scales package:
set.seed(1)
df <- data.frame(
x = rnorm(10) * 100000,
y = seq(0, 1, length.out = 10)
)
p2 <- ggplot(df, aes(x, y)) + geom_point()
p2 + scale_y_continuous(labels = scales::percent)
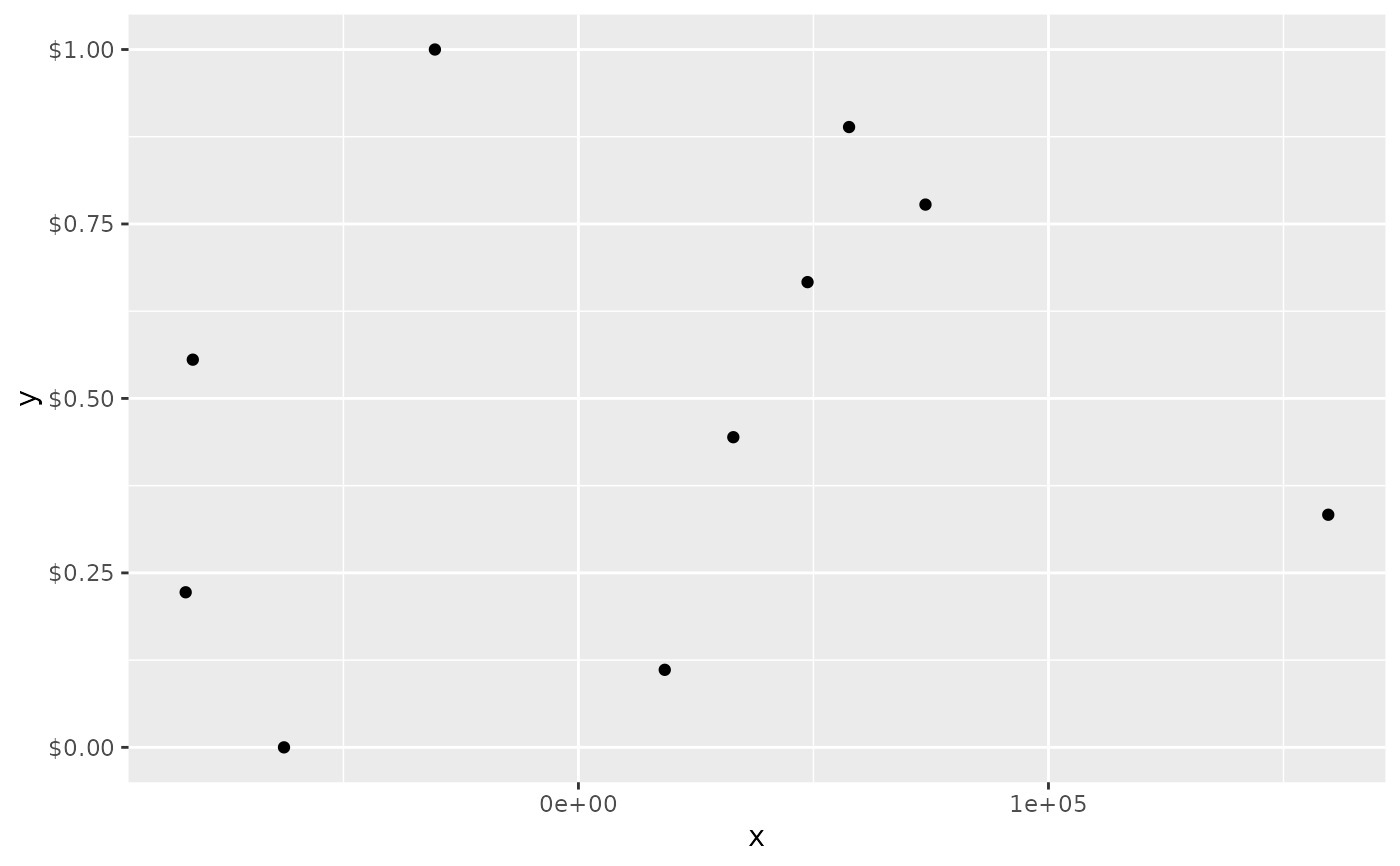
 p2 + scale_y_continuous(labels = scales::dollar)
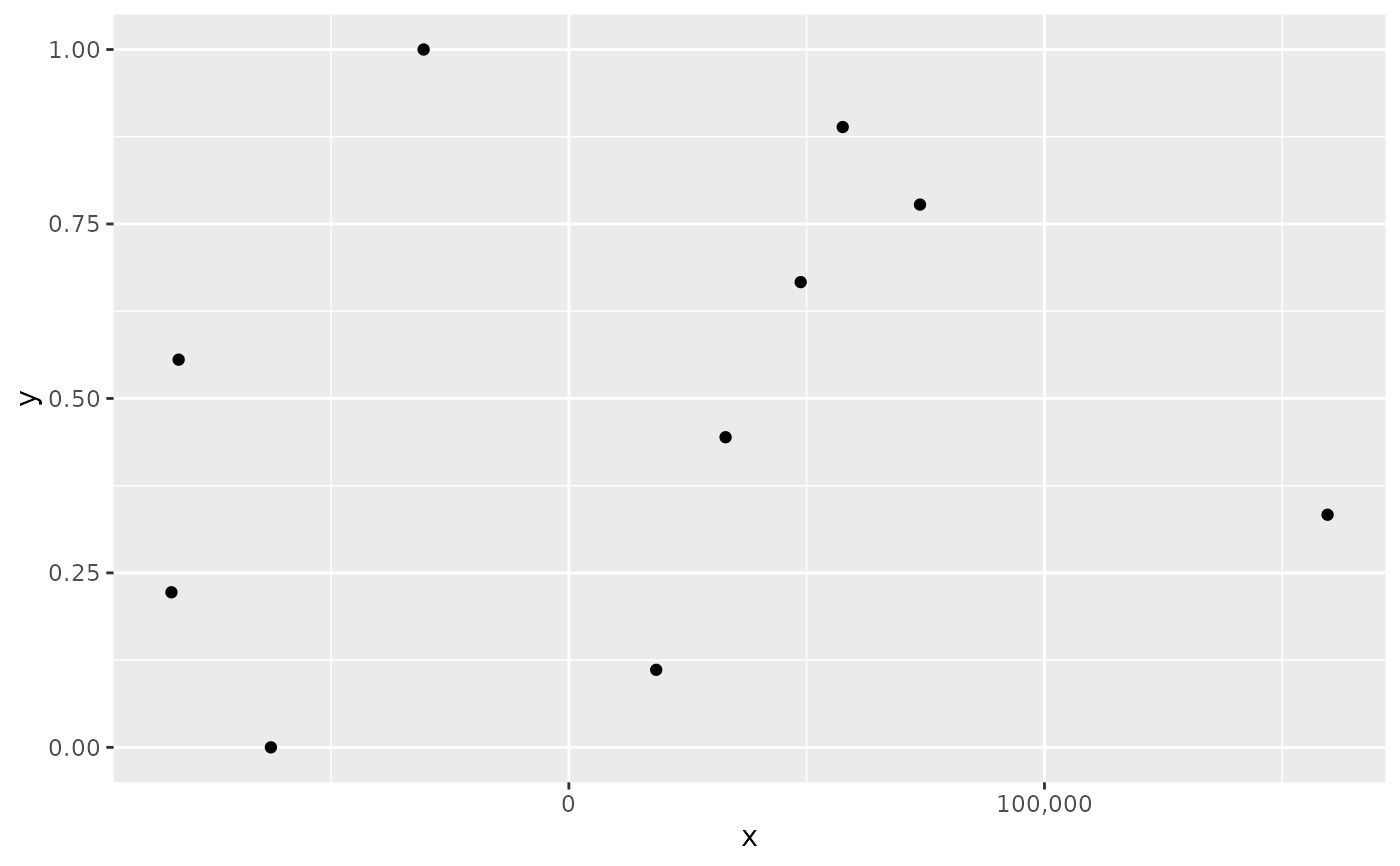
 p2 + scale_x_continuous(labels = scales::comma)
 # You can also override the default linear mapping by using a
# transformation. There are three shortcuts:
p1 + scale_y_log10()
# You can also override the default linear mapping by using a
# transformation. There are three shortcuts:
p1 + scale_y_log10()
 p1 + scale_y_sqrt()
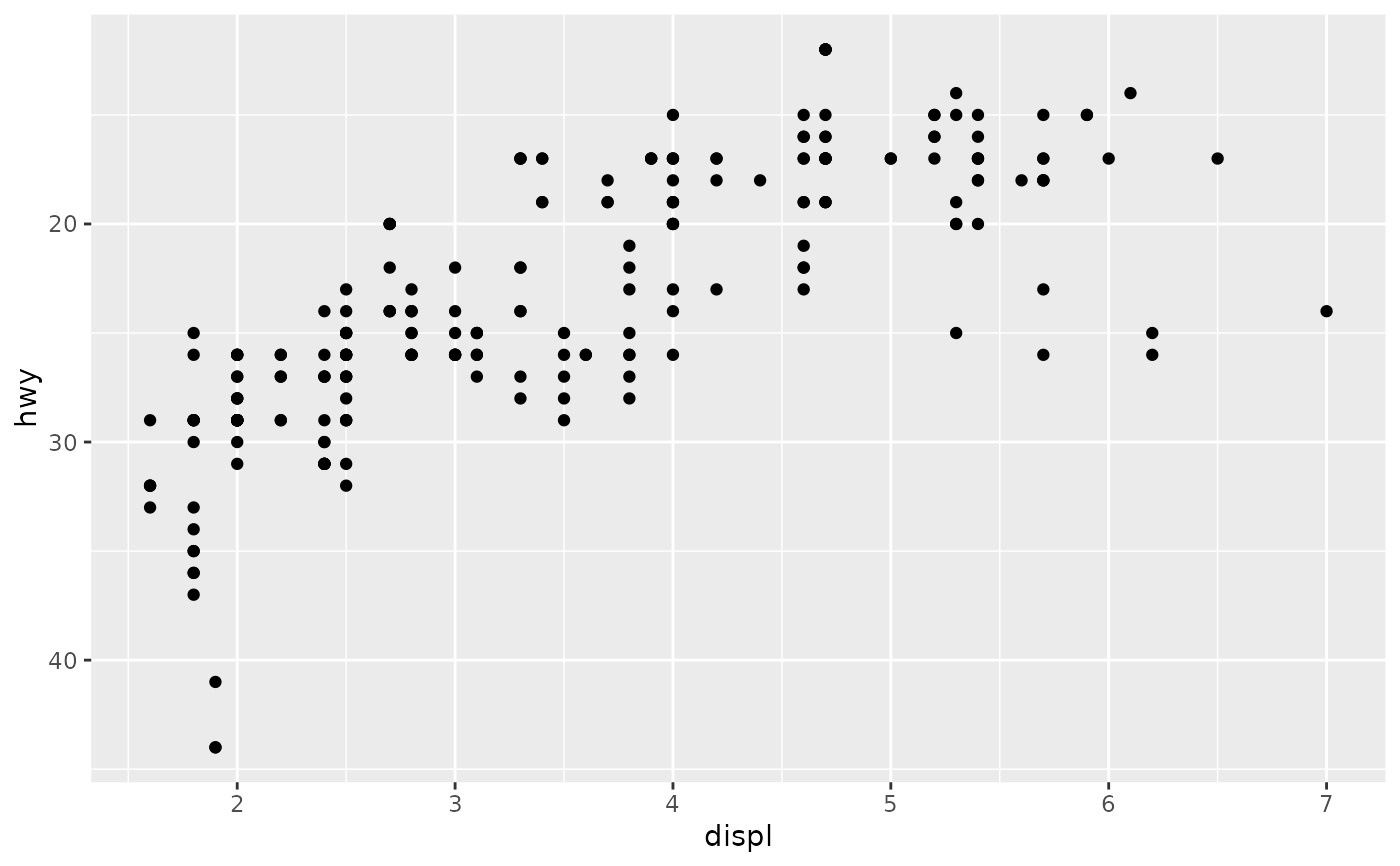
 p1 + scale_y_reverse()
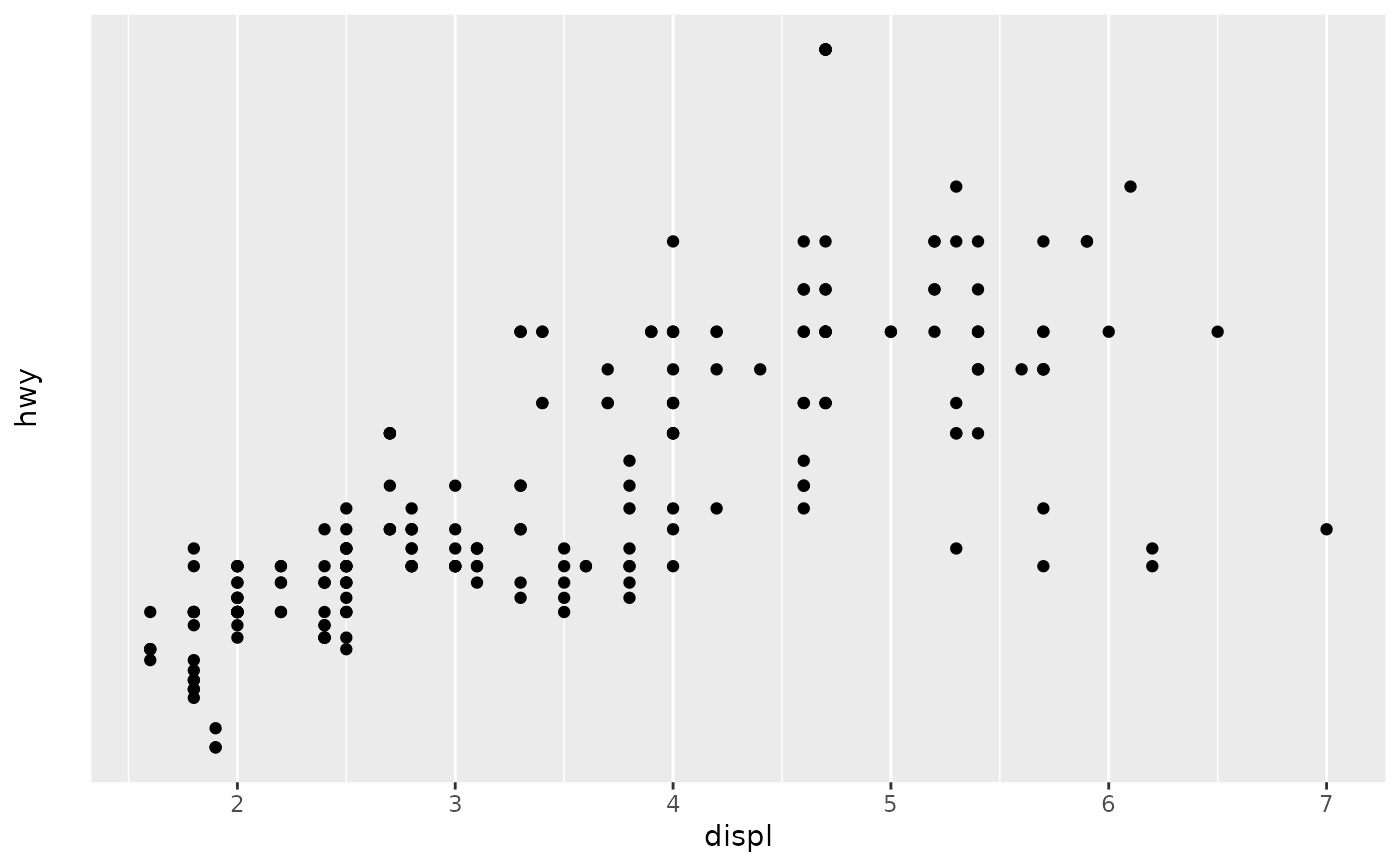
 # Or you can supply a transformation in the `trans` argument:
p1 + scale_y_continuous(trans = scales::reciprocal_trans())
# Or you can supply a transformation in the `trans` argument:
p1 + scale_y_continuous(trans = scales::reciprocal_trans())
 # You can also create your own. See ?scales::trans_new
相关用法
- R ggplot2 scale_colour_discrete 离散色阶
- R ggplot2 scale_colour_continuous 连续色标和分级色标
- R ggplot2 scale_gradient 渐变色阶
- R ggplot2 scale_shape 形状比例,又称字形
- R ggplot2 scale_viridis 来自 viridisLite 的 Viridis 色标
- R ggplot2 scale_grey 连续灰度色阶
- R ggplot2 scale_linetype 线条图案的比例
- R ggplot2 scale_discrete 离散数据的位置尺度
- R ggplot2 scale_manual 创建您自己的离散尺度
- R ggplot2 scale_steps 分级渐变色标
- R ggplot2 scale_size 面积或半径比例
- R ggplot2 scale_date 日期/时间数据的位置刻度
- R ggplot2 scale_binned 用于对连续数据进行装箱的位置比例(x 和 y)
- R ggplot2 scale_alpha Alpha 透明度比例
- R ggplot2 scale_identity 使用不缩放的值
- R ggplot2 scale_linewidth 线宽比例
- R ggplot2 scale_hue 离散数据的均匀间隔颜色
- R ggplot2 scale_brewer ColorBrewer 的连续、发散和定性色标
- R ggplot2 stat_ellipse 计算法行数据椭圆
- R ggplot2 stat_identity 保留数据原样
- R ggplot2 stat_summary_2d 以二维形式进行分类和汇总(矩形和六边形)
- R ggplot2 should_stop 在示例中用于说明何时应该发生错误。
- R ggplot2 stat_summary 总结唯一/分箱 x 处的 y 值
- R ggplot2 stat_sf_coordinates 从“sf”对象中提取坐标
- R ggplot2 stat_unique 删除重复项
注:本文由纯净天空筛选整理自Hadley Wickham等大神的英文原创作品 Position scales for continuous data (x & y)。非经特殊声明,原始代码版权归原作者所有,本译文未经允许或授权,请勿转载或复制。