stat_summary() 对唯一的 x 或 y 进行操作; stat_summary_bin() 对分箱的 x 或 y 进行操作。它们是 stat_bin() 的更灵活版本:它们不仅可以计算,还可以计算任何聚合。
用法
stat_summary_bin(
  mapping = NULL,
  data = NULL,
  geom = "pointrange",
  position = "identity",
  ...,
  fun.data = NULL,
  fun = NULL,
  fun.max = NULL,
  fun.min = NULL,
  fun.args = list(),
  bins = 30,
  binwidth = NULL,
  breaks = NULL,
  na.rm = FALSE,
  orientation = NA,
  show.legend = NA,
  inherit.aes = TRUE,
  fun.y = deprecated(),
  fun.ymin = deprecated(),
  fun.ymax = deprecated()
)

stat_summary(
  mapping = NULL,
  data = NULL,
  geom = "pointrange",
  position = "identity",
  ...,
  fun.data = NULL,
  fun = NULL,
  fun.max = NULL,
  fun.min = NULL,
  fun.args = list(),
  na.rm = FALSE,
  orientation = NA,
  show.legend = NA,
  inherit.aes = TRUE,
  fun.y = deprecated(),
  fun.ymin = deprecated(),
  fun.ymax = deprecated()
)
参数
- mapping
-
由
aes()创建的一组美学映射。如果指定且inherit.aes = TRUE(默认),它将与绘图顶层的默认映射组合。如果没有绘图映射,则必须提供mapping。 - data
-
该层要显示的数据。有以下三种选择:
如果默认为
NULL,则数据继承自ggplot()调用中指定的绘图数据。data.frame或其他对象将覆盖绘图数据。所有对象都将被强化以生成 DataFrame 。请参阅fortify()将为其创建变量。将使用单个参数(绘图数据)调用
function。返回值必须是data.frame,并将用作图层数据。可以从formula创建function(例如~ head(.x, 10))。 - geom
-
用于显示数据的几何对象,可以作为
ggprotoGeom子类,也可以作为命名去除geom_前缀的几何对象的字符串(例如"point"而不是"geom_point") - position
-
位置调整,可以是命名调整的字符串(例如
"jitter"使用position_jitter),也可以是调用位置调整函数的结果。如果需要更改调整设置,请使用后者。 - ...
-
其他参数传递给
layer()。这些通常是美学,用于将美学设置为固定值,例如colour = "red"或size = 3。它们也可能是配对的 geom/stat 的参数。 - fun.data
-
给出完整数据的函数,应返回包含变量
ymin、y和ymax的数据帧。 - fun.min, fun, fun.max
-
或者,提供三个单独的函数,每个函数都传递一个值向量并应返回一个数字。
- fun.args
-
传递给函数的可选附加参数。
- bins
-
箱子数量。被
binwidth覆盖。默认为 30。 - binwidth
-
箱子的宽度。可以指定为数值或根据未缩放的 x 计算宽度的函数。这里,"unscaled x" 指的是应用任何尺度变换之前数据中的原始 x 值。当指定函数和分组结构时,每个组将调用该函数一次。默认是使用
bins中的 bin 数量,覆盖数据范围。您应该始终覆盖此值,探索多个宽度以找到最能说明数据中的故事的宽度。日期变量的 bin 宽度是每个时间的天数;时间变量的 bin 宽度是秒数。
- breaks
-
或者,您可以提供给出 bin 边界的数值向量。覆盖
binwidth、bins、center和boundary。 - na.rm
-
如果
FALSE,则默认缺失值将被删除并带有警告。如果TRUE,缺失值将被静默删除。 - orientation
-
层的方向。默认值 (
NA) 自动根据美学映射确定方向。万一失败,可以通过将orientation设置为"x"或"y"来显式给出。有关更多详细信息,请参阅方向部分。 - show.legend
-
合乎逻辑的。该层是否应该包含在图例中?
NA(默认值)包括是否映射了任何美学。FALSE从不包含,而TRUE始终包含。它也可以是一个命名的逻辑向量,以精细地选择要显示的美学。 - inherit.aes
-
如果
FALSE,则覆盖默认美学,而不是与它们组合。这对于定义数据和美观的辅助函数最有用,并且不应继承默认绘图规范的行为,例如borders()。 - fun.ymin, fun.y, fun.ymax
-
请改用上面指定的版本。
方向
该几何体以不同的方式对待每个轴,因此可以有两个方向。通常,方向很容易从给定映射和使用的位置比例类型的组合中推断出来。因此,ggplot2 默认情况下会尝试猜测图层应具有哪个方向。在极少数情况下,方向不明确,猜测可能会失败。在这种情况下,可以直接使用 orientation 参数指定方向,该参数可以是 "x" 或 "y" 。该值给出了几何图形应沿着的轴,"x" 是您期望的几何图形的默认方向。
函数汇总
您可以单独提供汇总函数( fun 、 fun.max 、 fun.min ),也可以作为单个函数( fun.data )提供:
- fun.data
-
完整的汇总函数。应该以数值向量作为输入并返回数据帧作为输出
- fun.min
-
最小汇总函数(应采用数值向量并返回单个数字)
- fun
-
主要摘要函数(应采用数值向量并返回单个数字)
- fun.max
-
最大汇总函数(应采用数值向量并返回单个数字)
简单的向量函数最容易使用,因为您可以返回单个数字,但灵活性稍差。如果您的汇总函数一次计算多个值(例如最小值和最大值),请使用 fun.data 。
fun.data 将接收数据,就好像数据沿 x 轴定向一样,并应返回与该方向相对应的 data.frame。如果该层沿 y 轴定向,则该层将负责翻转输入和输出。
如果未提供聚合函数,则默认为 mean_se() 。
也可以看看
geom_errorbar() , geom_pointrange() , geom_linerange() , geom_crossbar() 用于geoms显示汇总数据
例子
d <- ggplot(mtcars, aes(cyl, mpg)) + geom_point()
d + stat_summary(fun.data = "mean_cl_boot", colour = "red", linewidth = 2, size = 3)
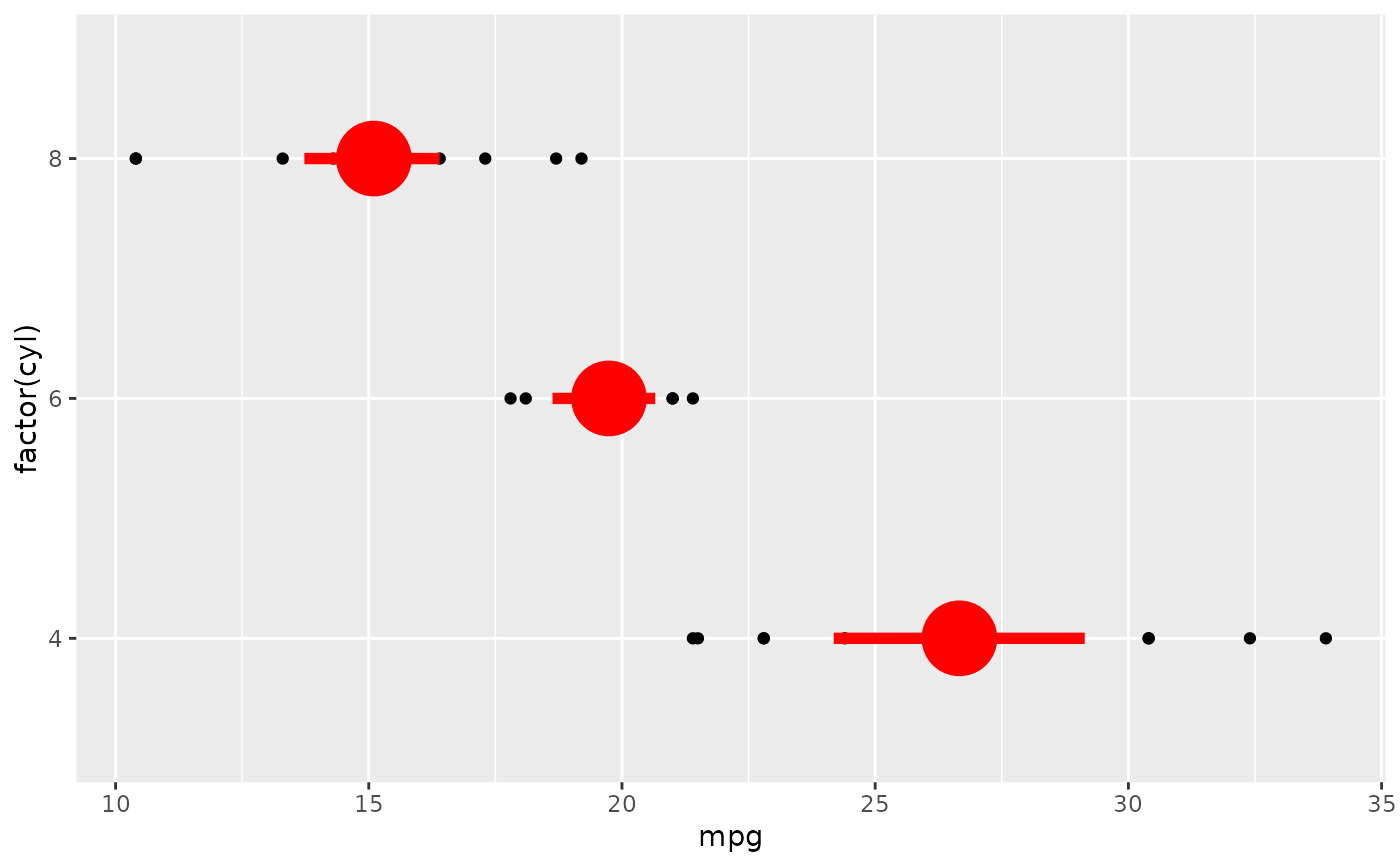
 # Orientation follows the discrete axis
ggplot(mtcars, aes(mpg, factor(cyl))) +
geom_point() +
stat_summary(fun.data = "mean_cl_boot", colour = "red", linewidth = 2, size = 3)
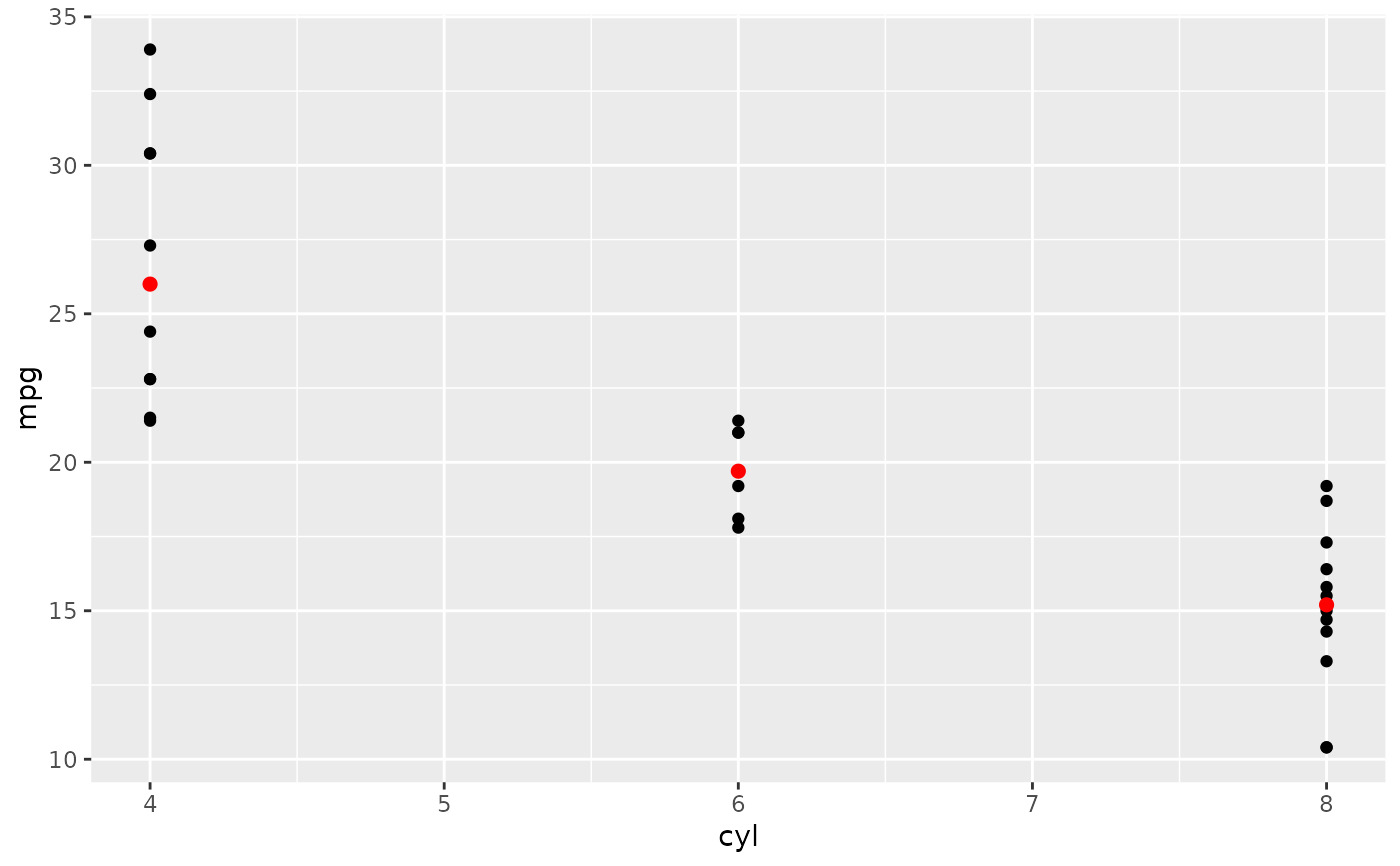
 # You can supply individual functions to summarise the value at
# each x:
d + stat_summary(fun = "median", colour = "red", size = 2, geom = "point")
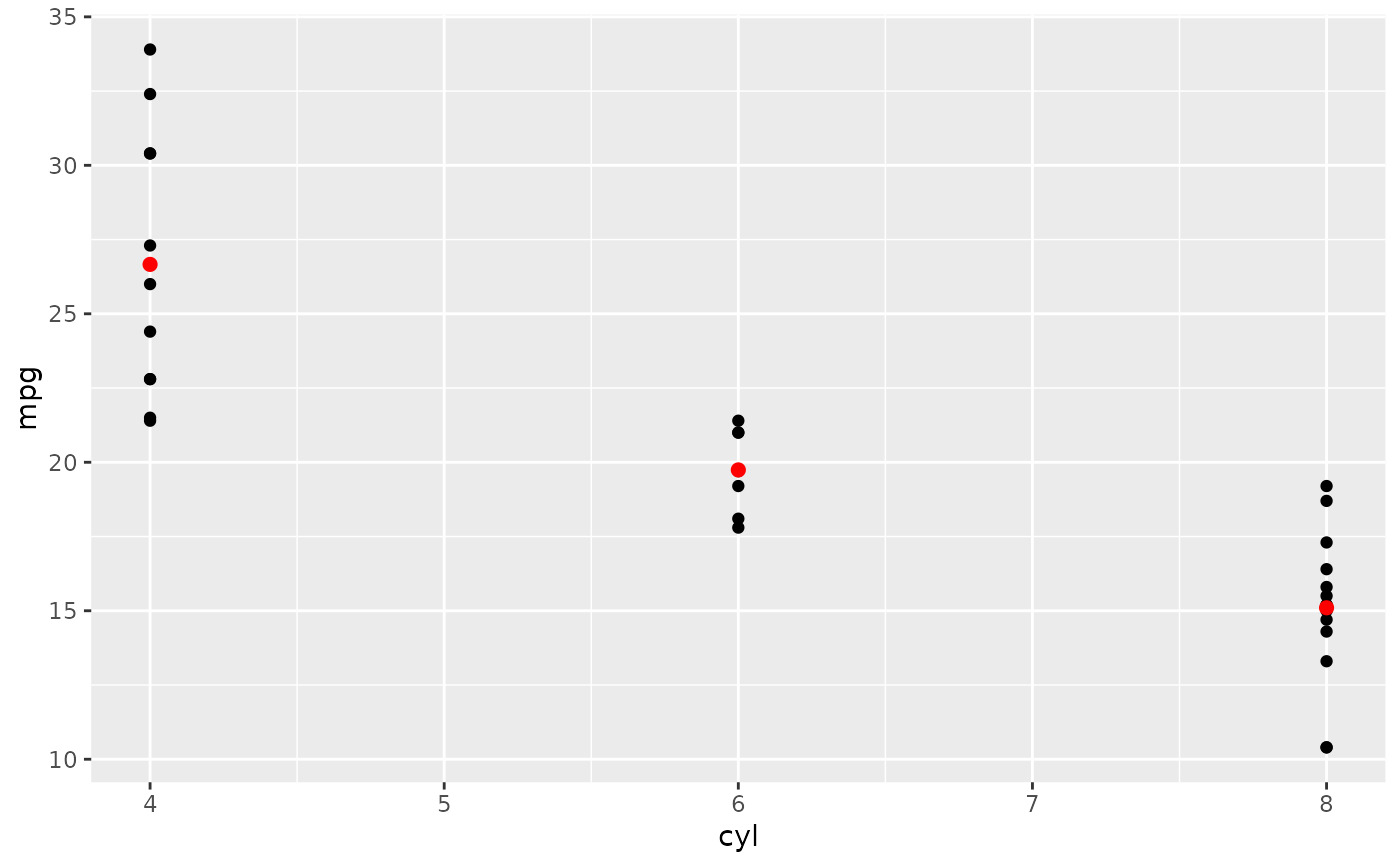
 d + stat_summary(fun = "mean", colour = "red", size = 2, geom = "point")
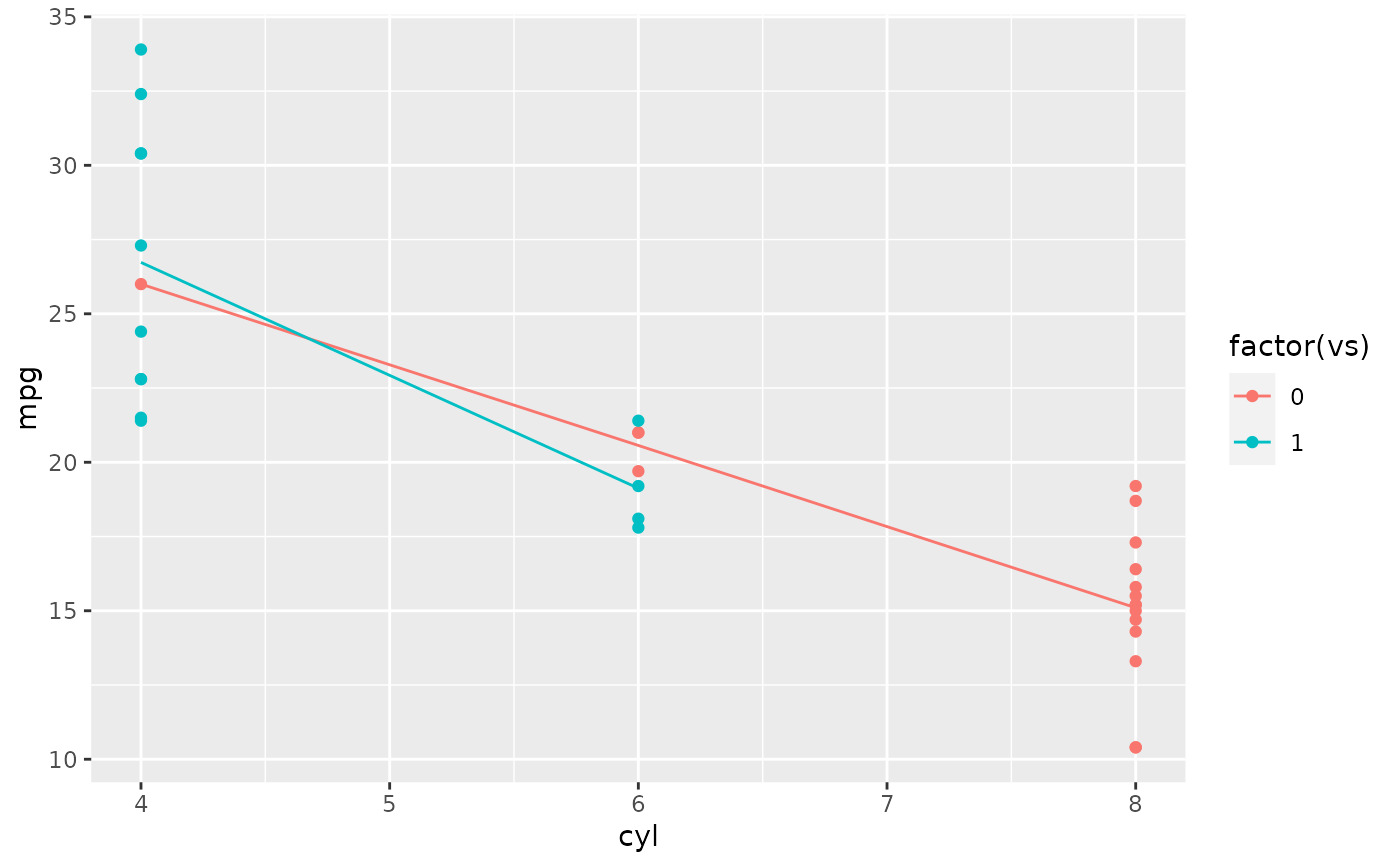
 d + aes(colour = factor(vs)) + stat_summary(fun = mean, geom="line")
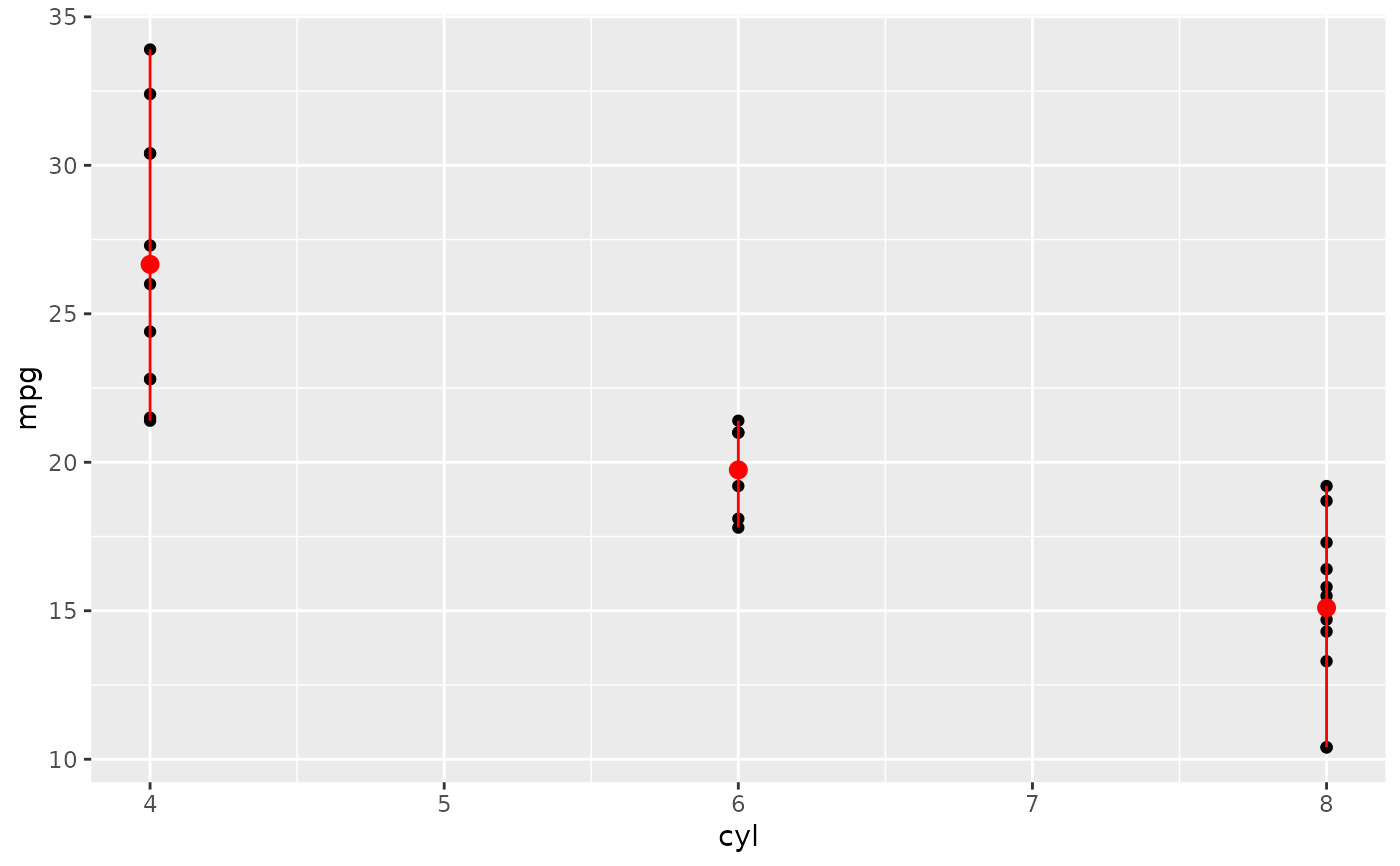
 d + stat_summary(fun = mean, fun.min = min, fun.max = max, colour = "red")
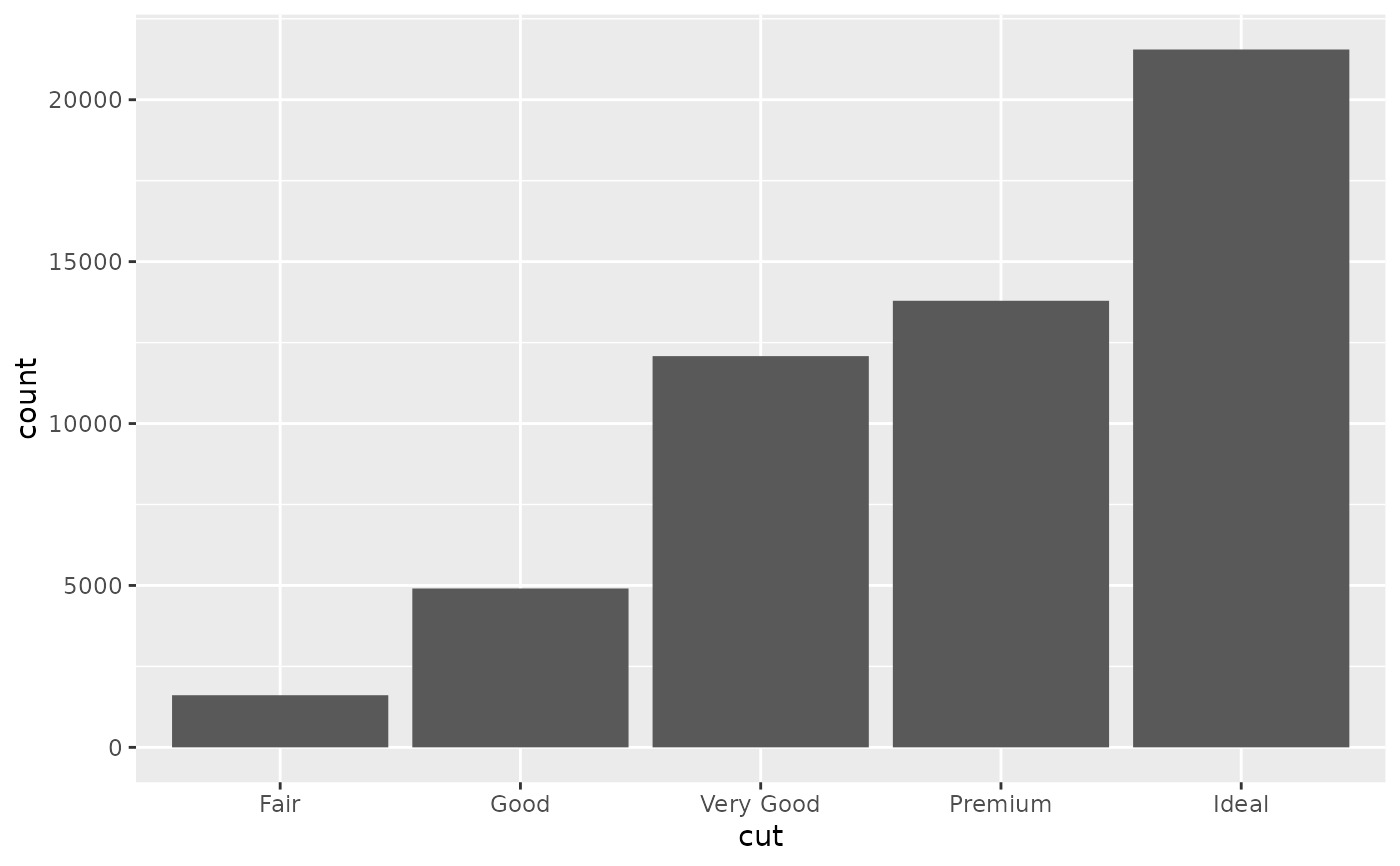
 d <- ggplot(diamonds, aes(cut))
d + geom_bar()
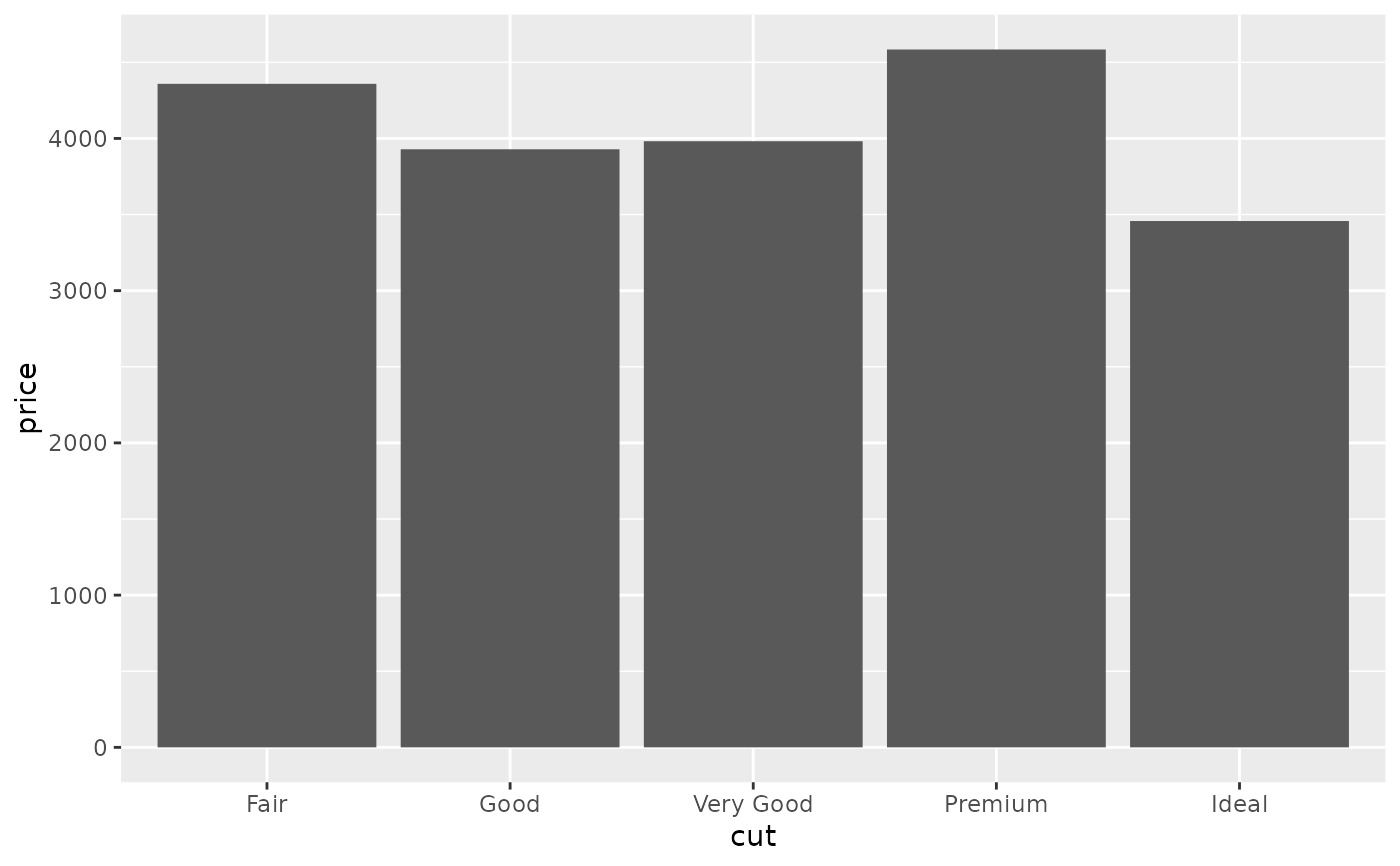
 d + stat_summary(aes(y = price), fun = "mean", geom = "bar")
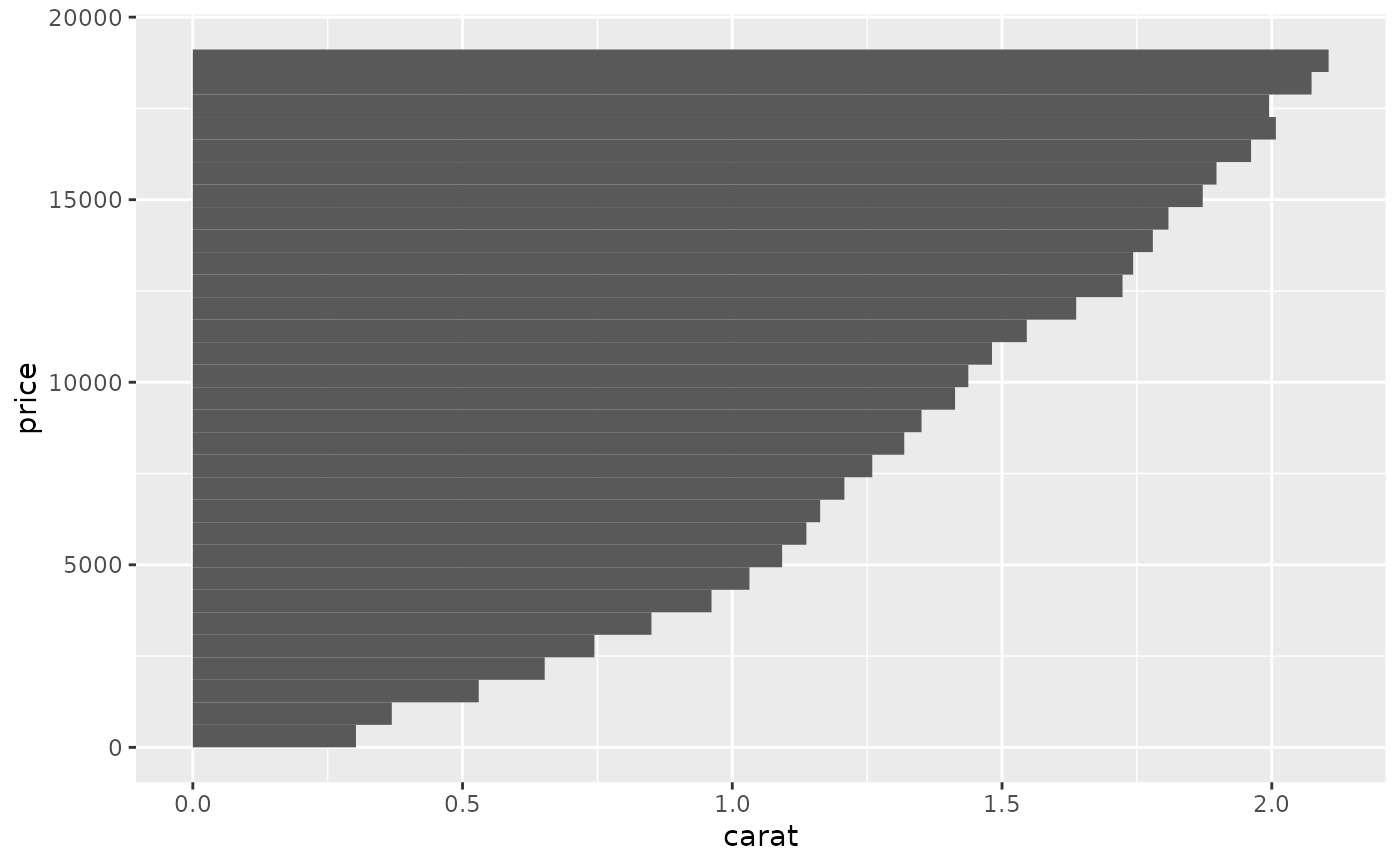
 # Orientation of stat_summary_bin is ambiguous and must be specified directly
ggplot(diamonds, aes(carat, price)) +
stat_summary_bin(fun = "mean", geom = "bar", orientation = 'y')
 # \donttest{
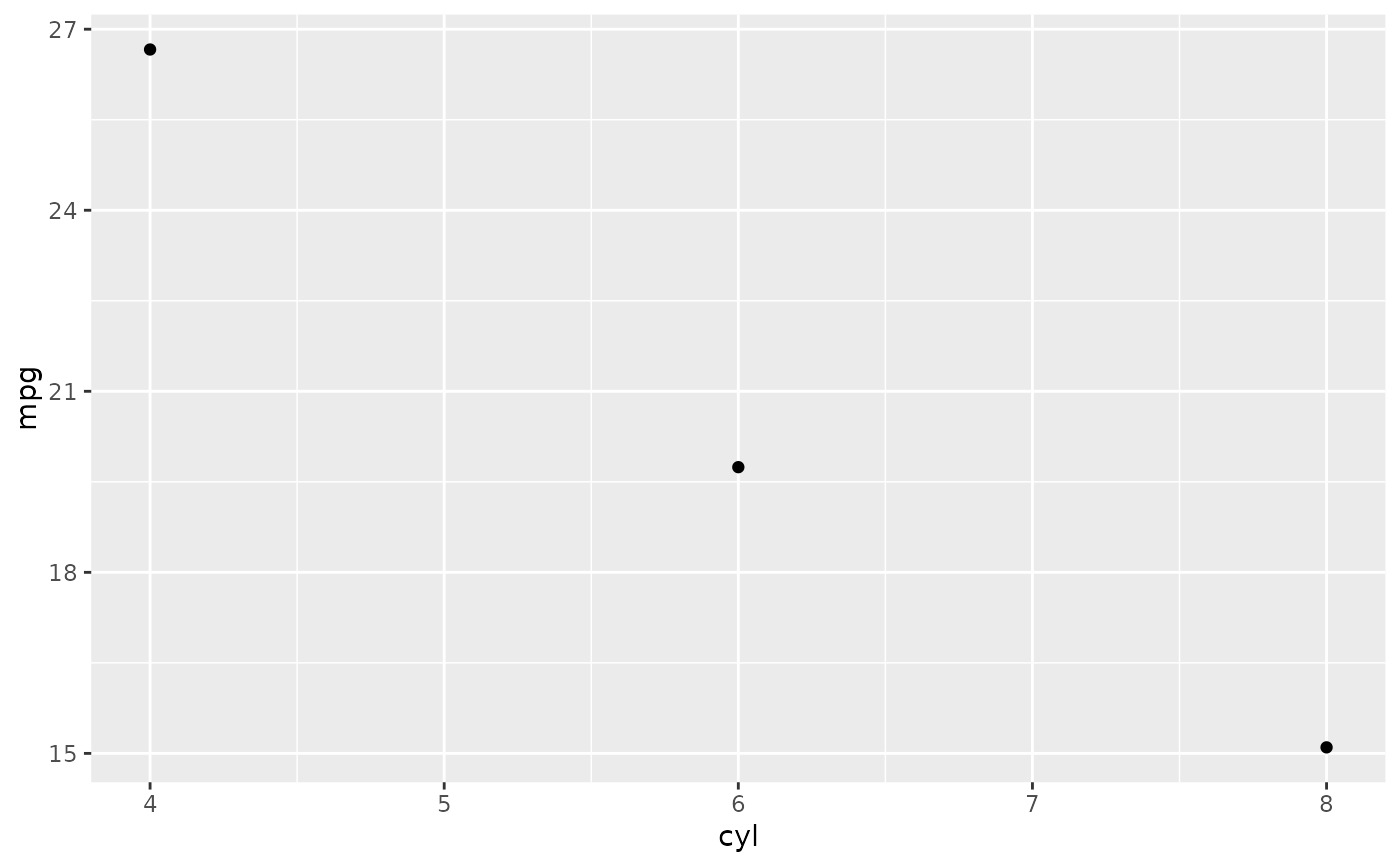
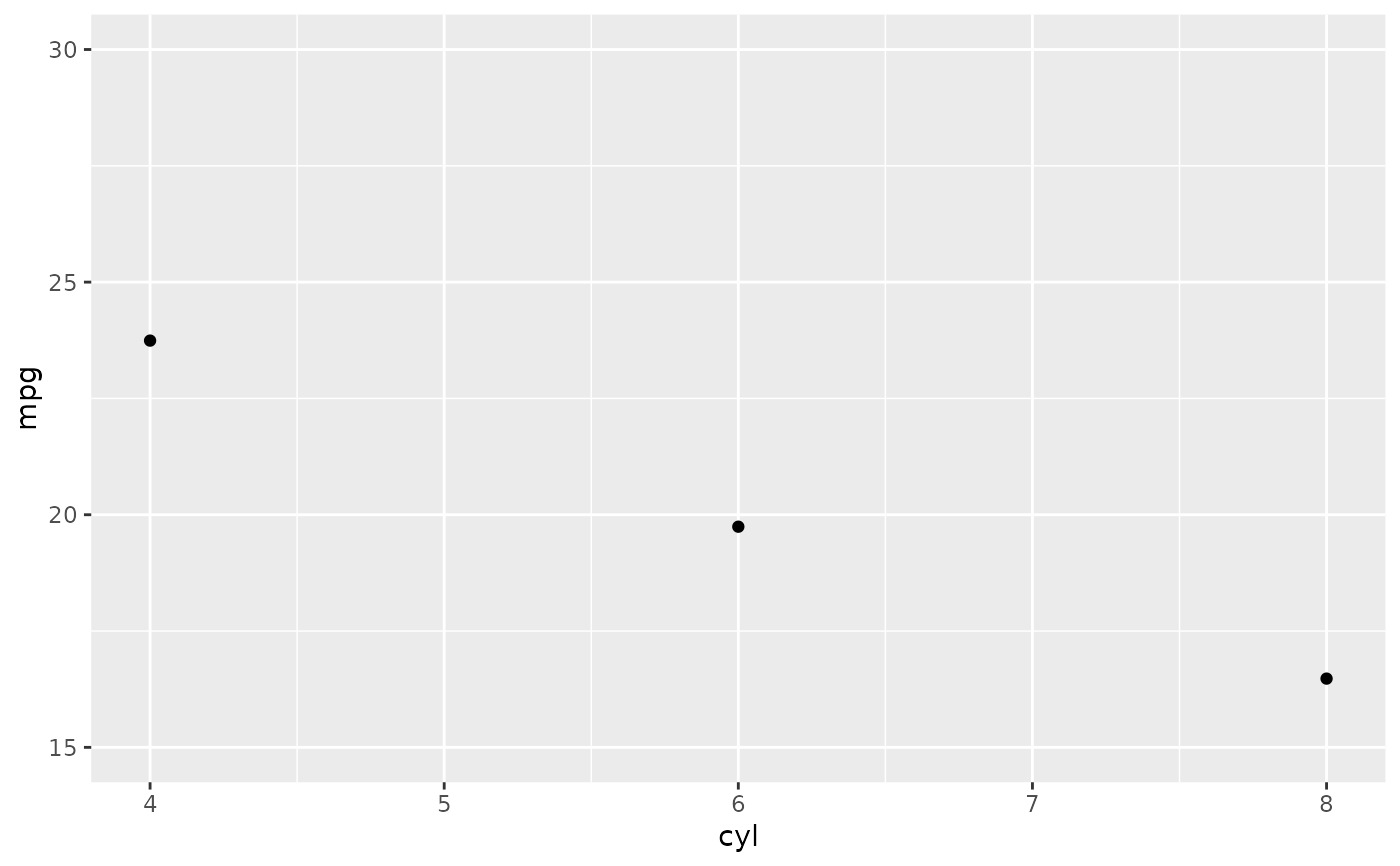
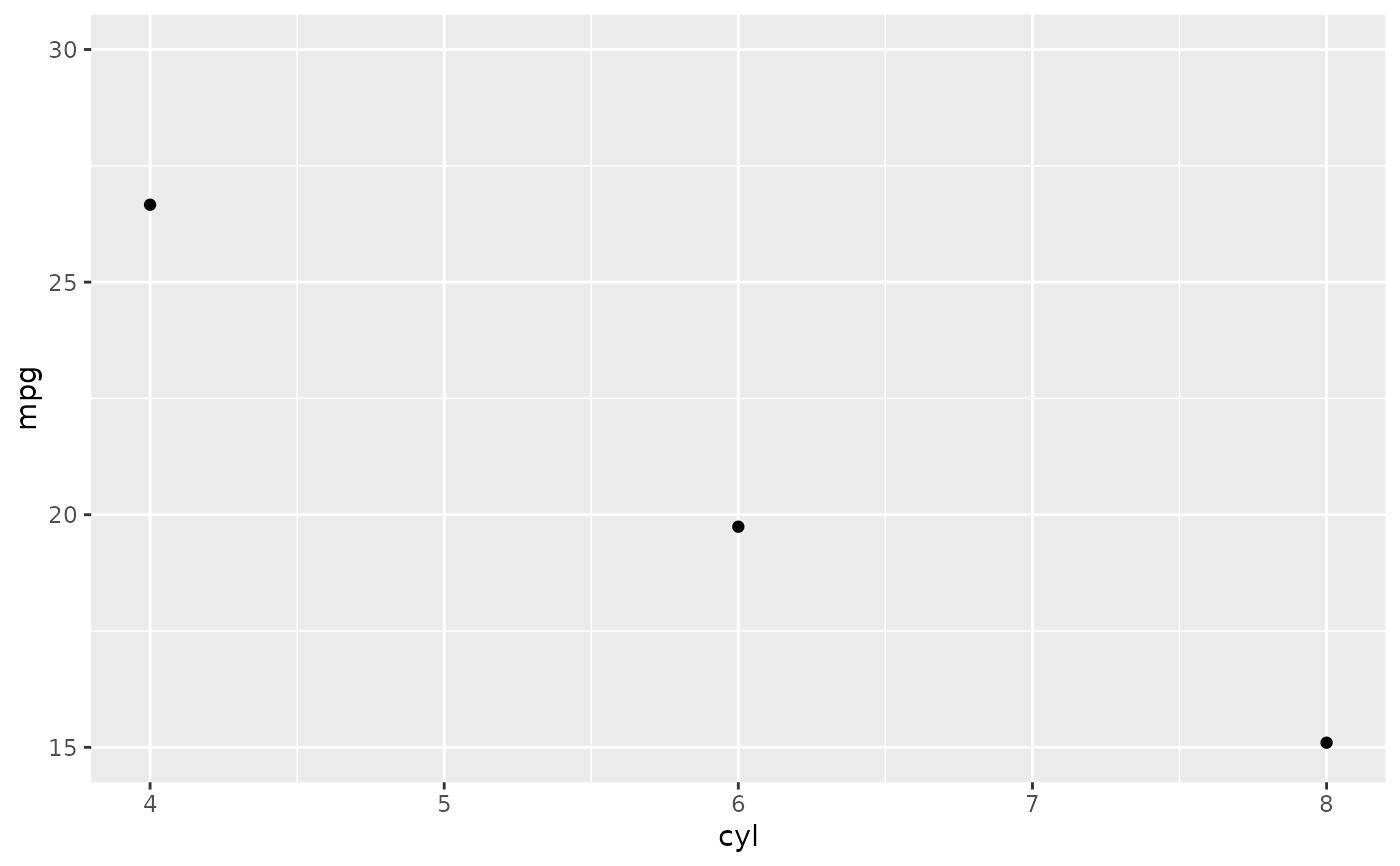
# Don't use ylim to zoom into a summary plot - this throws the
# data away
p <- ggplot(mtcars, aes(cyl, mpg)) +
stat_summary(fun = "mean", geom = "point")
p
 p + ylim(15, 30)
#> Warning: Removed 9 rows containing non-finite values (`stat_summary()`).
 # Instead use coord_cartesian
p + coord_cartesian(ylim = c(15, 30))
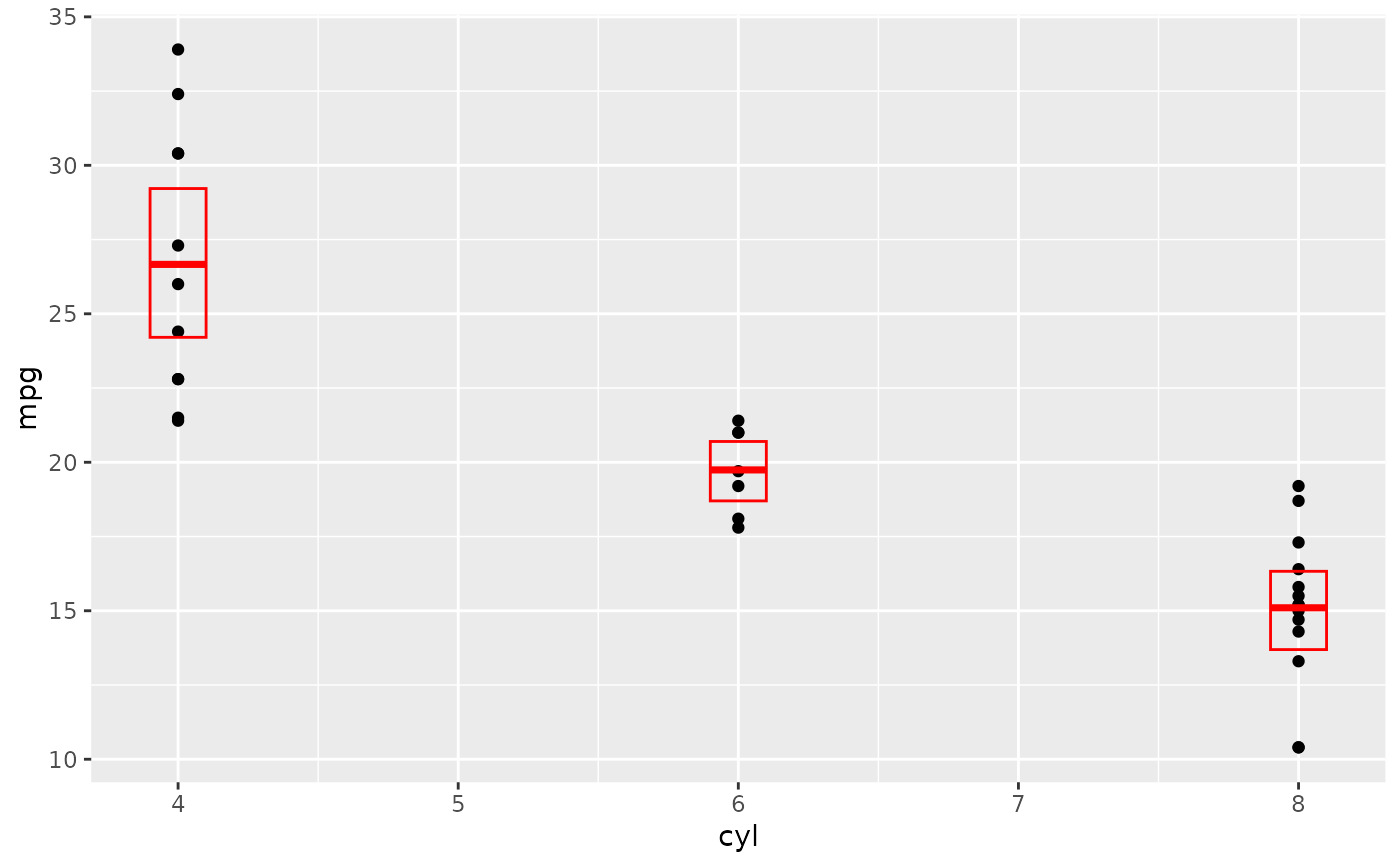
 # A set of useful summary functions is provided from the Hmisc package:
stat_sum_df <- function(fun, geom="crossbar", ...) {
stat_summary(fun.data = fun, colour = "red", geom = geom, width = 0.2, ...)
}
d <- ggplot(mtcars, aes(cyl, mpg)) + geom_point()
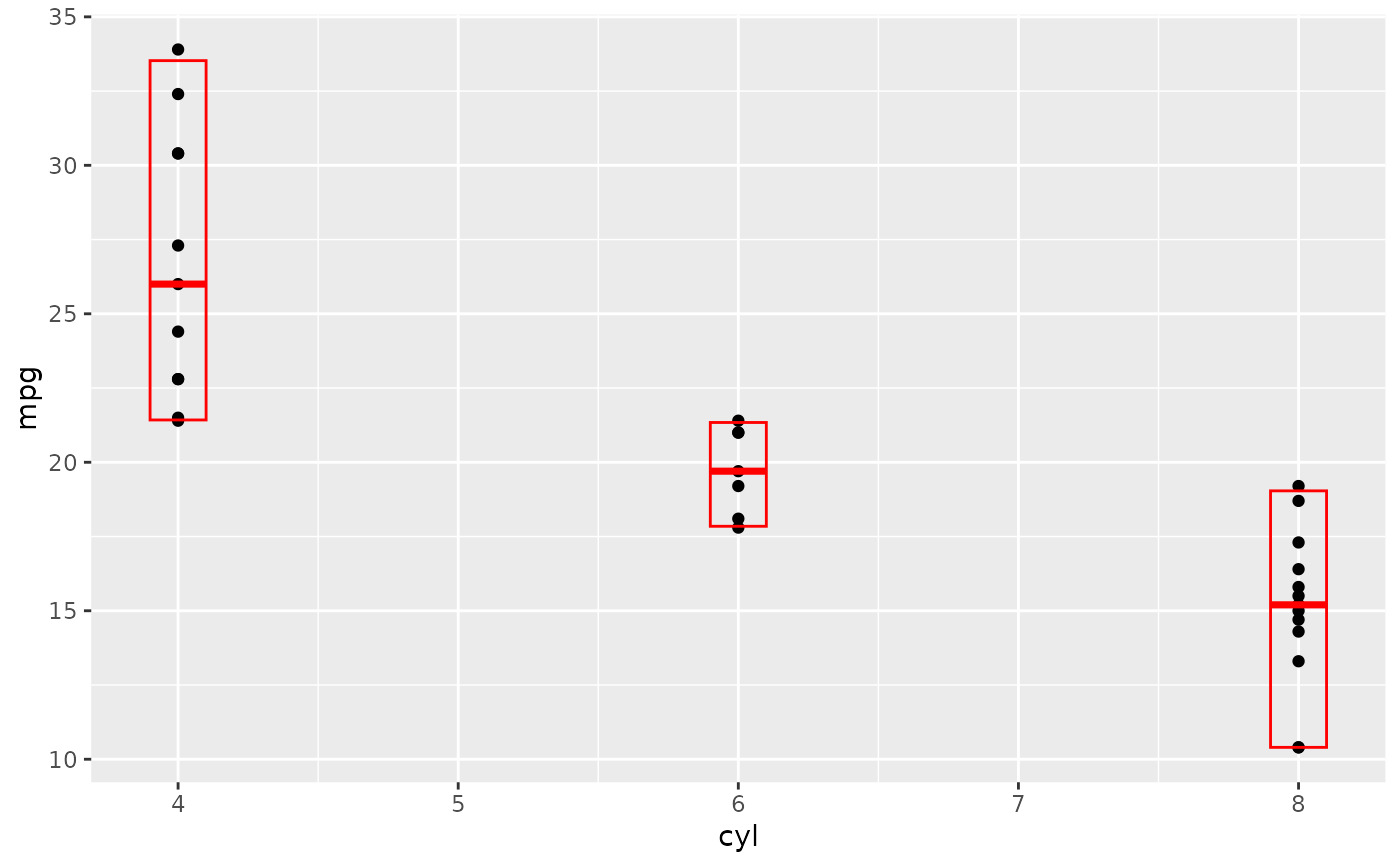
# The crossbar geom needs grouping to be specified when used with
# a continuous x axis.
d + stat_sum_df("mean_cl_boot", mapping = aes(group = cyl))
 d + stat_sum_df("mean_sdl", mapping = aes(group = cyl))
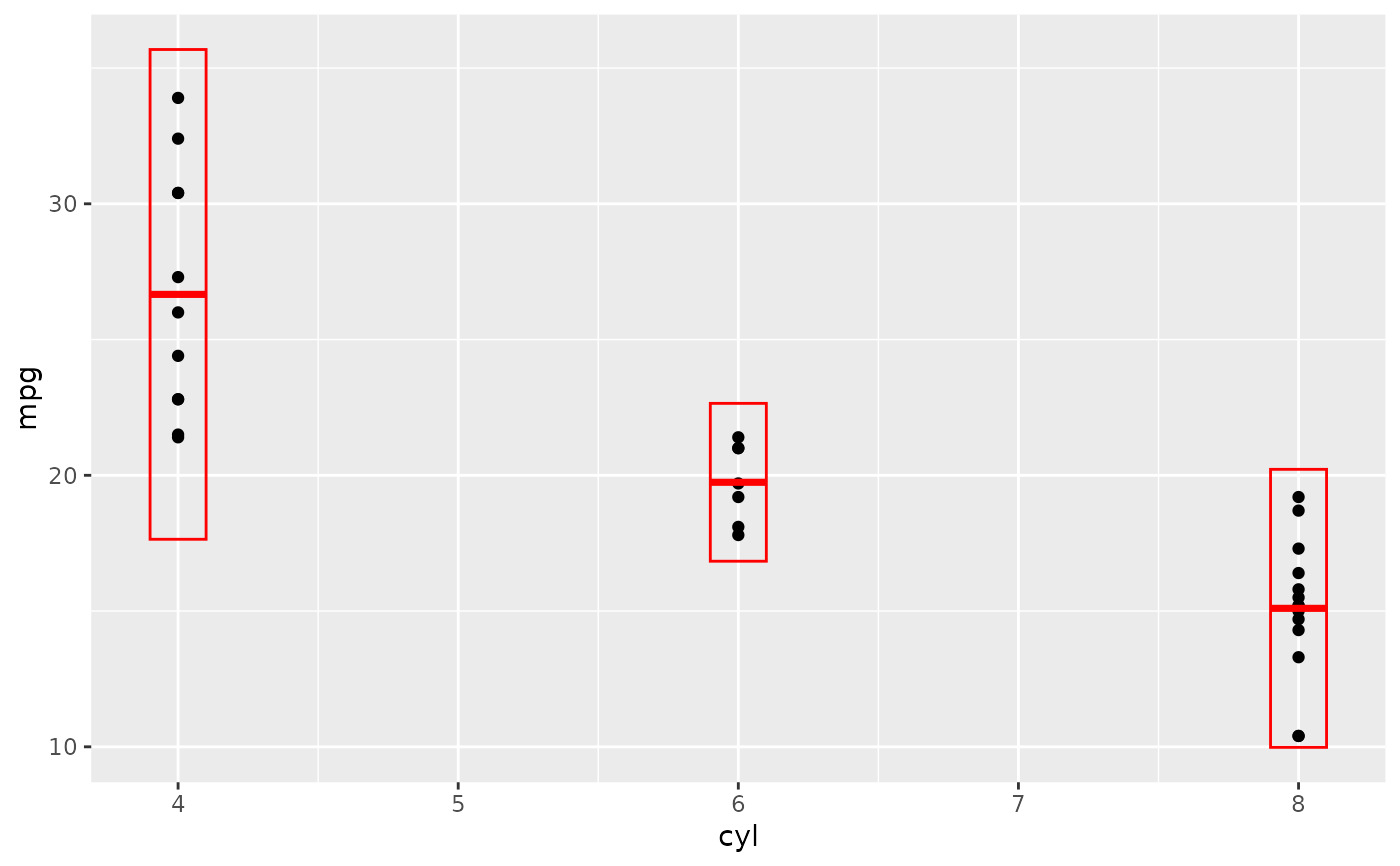 d + stat_sum_df("mean_sdl", fun.args = list(mult = 1), mapping = aes(group = cyl))
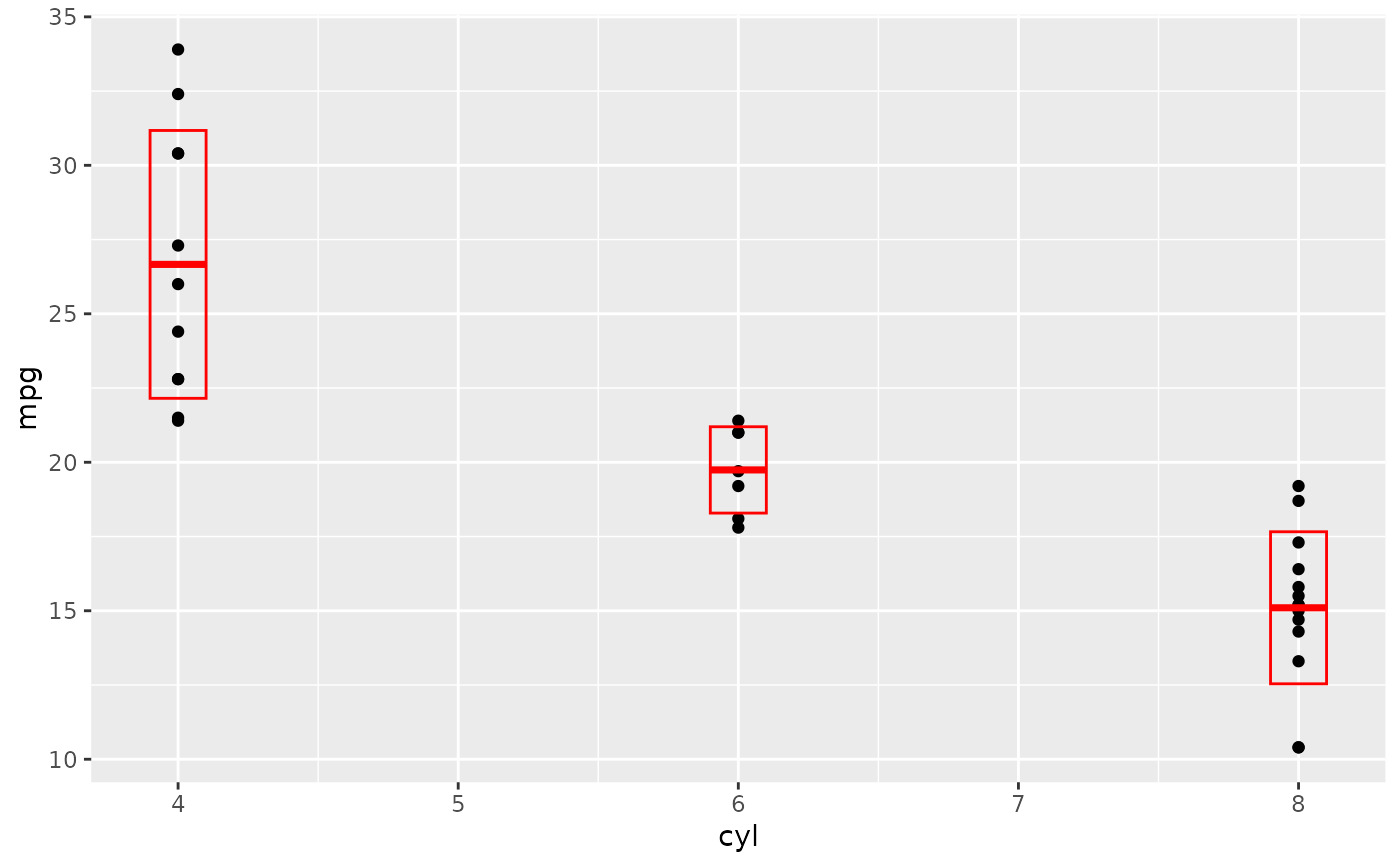 d + stat_sum_df("median_hilow", mapping = aes(group = cyl))
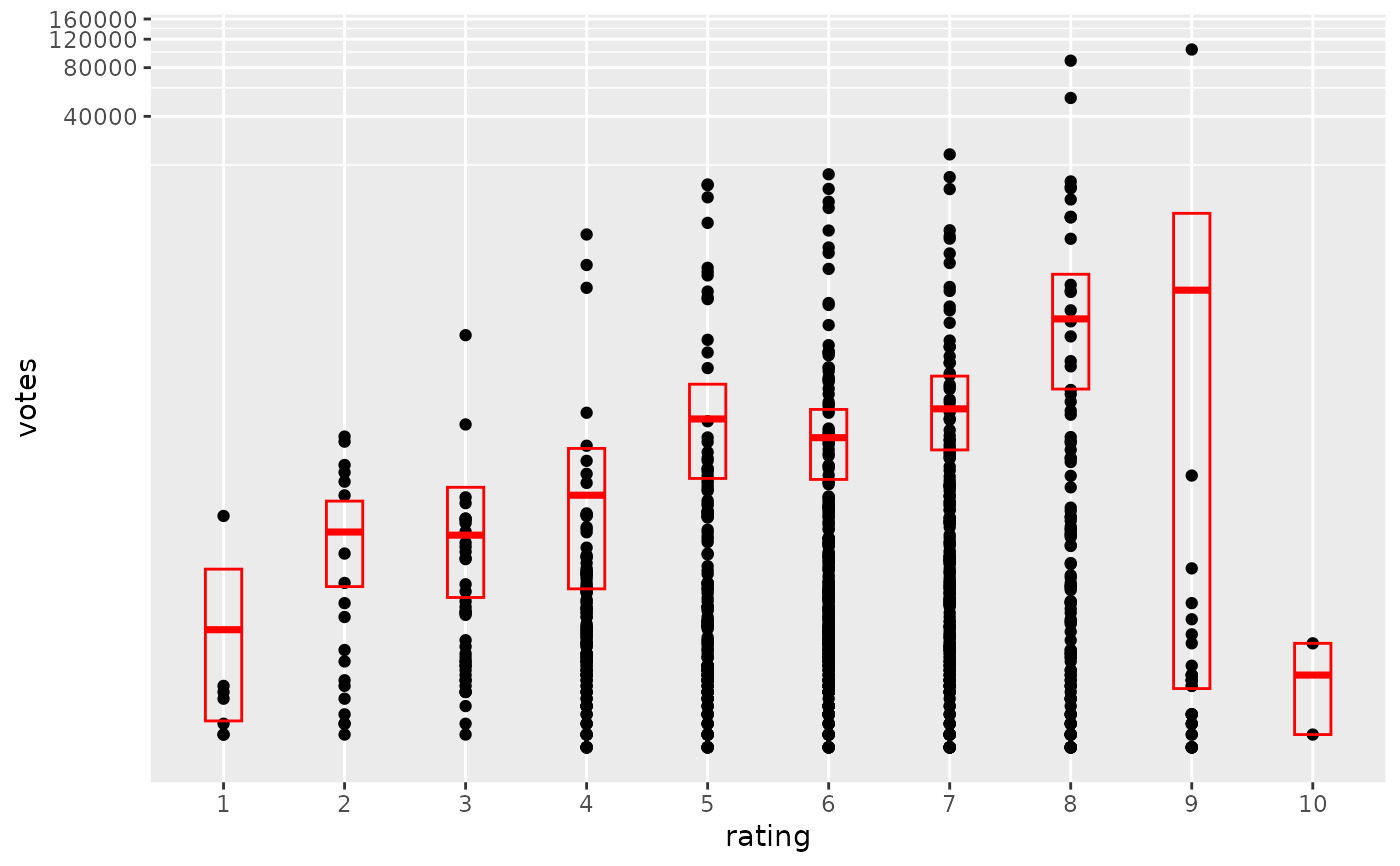
 # An example with highly skewed distributions:
if (require("ggplot2movies")) {
set.seed(596)
mov <- movies[sample(nrow(movies), 1000), ]
m2 <-
ggplot(mov, aes(x = factor(round(rating)), y = votes)) +
geom_point()
m2 <-
m2 +
stat_summary(
fun.data = "mean_cl_boot",
geom = "crossbar",
colour = "red", width = 0.3
) +
xlab("rating")
m2
# Notice how the overplotting skews off visual perception of the mean
# supplementing the raw data with summary statistics is _very_ important
# Next, we'll look at votes on a log scale.
# Transforming the scale means the data are transformed
# first, after which statistics are computed:
m2 + scale_y_log10()
# Transforming the coordinate system occurs after the
# statistic has been computed. This means we're calculating the summary on the raw data
# and stretching the geoms onto the log scale. Compare the widths of the
# standard errors.
m2 + coord_trans(y="log10")
}
 # }
# }
相关用法
- R ggplot2 stat_summary_2d 以二维形式进行分类和汇总(矩形和六边形)
- R ggplot2 stat_sf_coordinates 从“sf”对象中提取坐标
- R ggplot2 stat_ellipse 计算法行数据椭圆
- R ggplot2 stat_identity 保留数据原样
- R ggplot2 stat_unique 删除重复项
- R ggplot2 stat_ecdf 计算经验累积分布
- R ggplot2 scale_gradient 渐变色阶
- R ggplot2 scale_shape 形状比例,又称字形
- R ggplot2 scale_viridis 来自 viridisLite 的 Viridis 色标
- R ggplot2 scale_grey 连续灰度色阶
- R ggplot2 scale_linetype 线条图案的比例
- R ggplot2 scale_discrete 离散数据的位置尺度
- R ggplot2 scale_manual 创建您自己的离散尺度
- R ggplot2 scale_colour_discrete 离散色阶
- R ggplot2 scale_steps 分级渐变色标
- R ggplot2 should_stop 在示例中用于说明何时应该发生错误。
- R ggplot2 scale_size 面积或半径比例
- R ggplot2 scale_date 日期/时间数据的位置刻度
- R ggplot2 scale_continuous 连续数据的位置比例(x 和 y)
- R ggplot2 scale_binned 用于对连续数据进行装箱的位置比例(x 和 y)
- R ggplot2 sec_axis 指定辅助轴
- R ggplot2 scale_alpha Alpha 透明度比例
- R ggplot2 scale_colour_continuous 连续色标和分级色标
- R ggplot2 scale_identity 使用不缩放的值
- R ggplot2 scale_linewidth 线宽比例
注:本文由纯净天空筛选整理自Hadley Wickham等大神的英文原创作品 Summarise y values at unique/binned x。非经特殊声明,原始代码版权归原作者所有,本译文未经允许或授权,请勿转载或复制。
