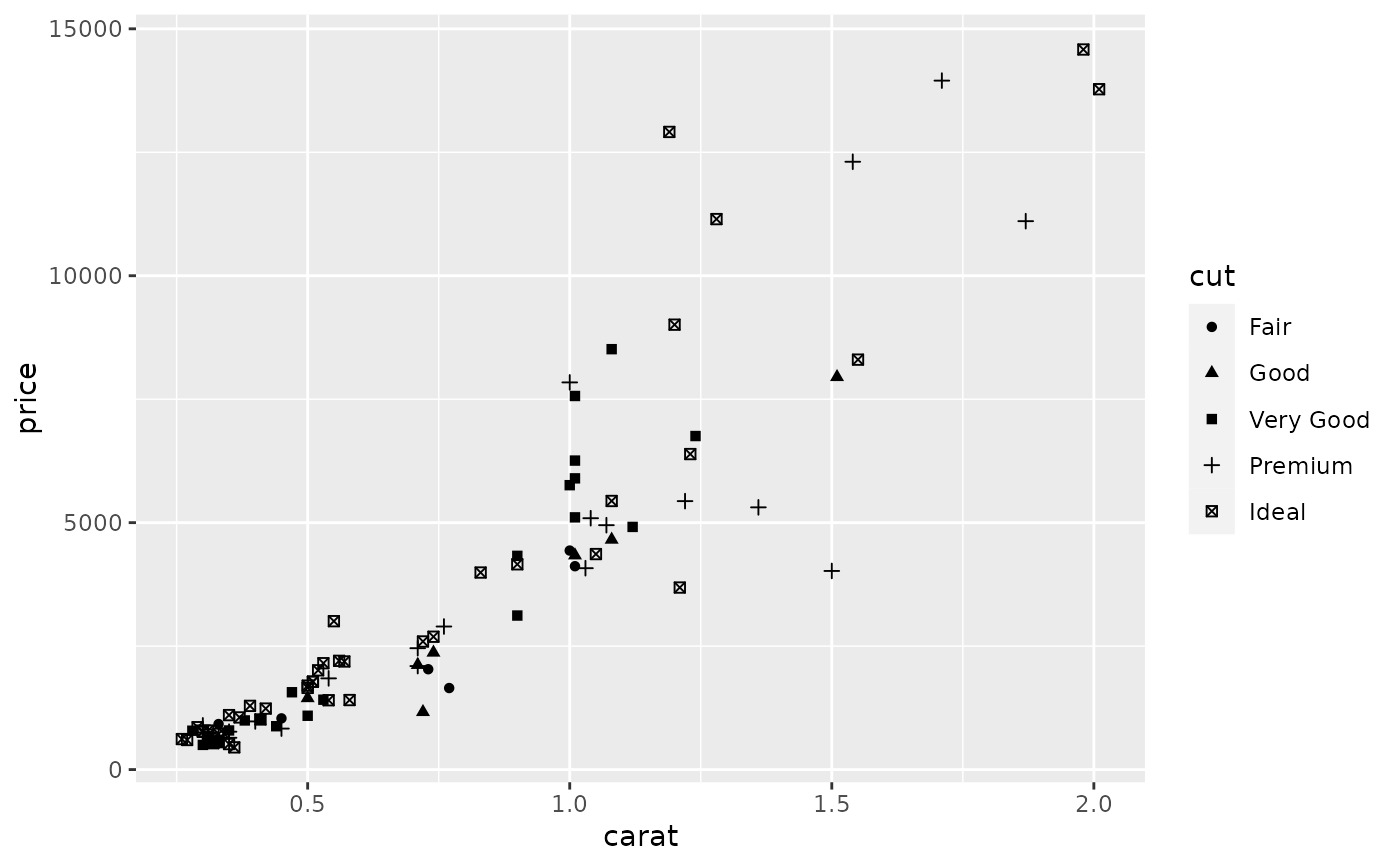
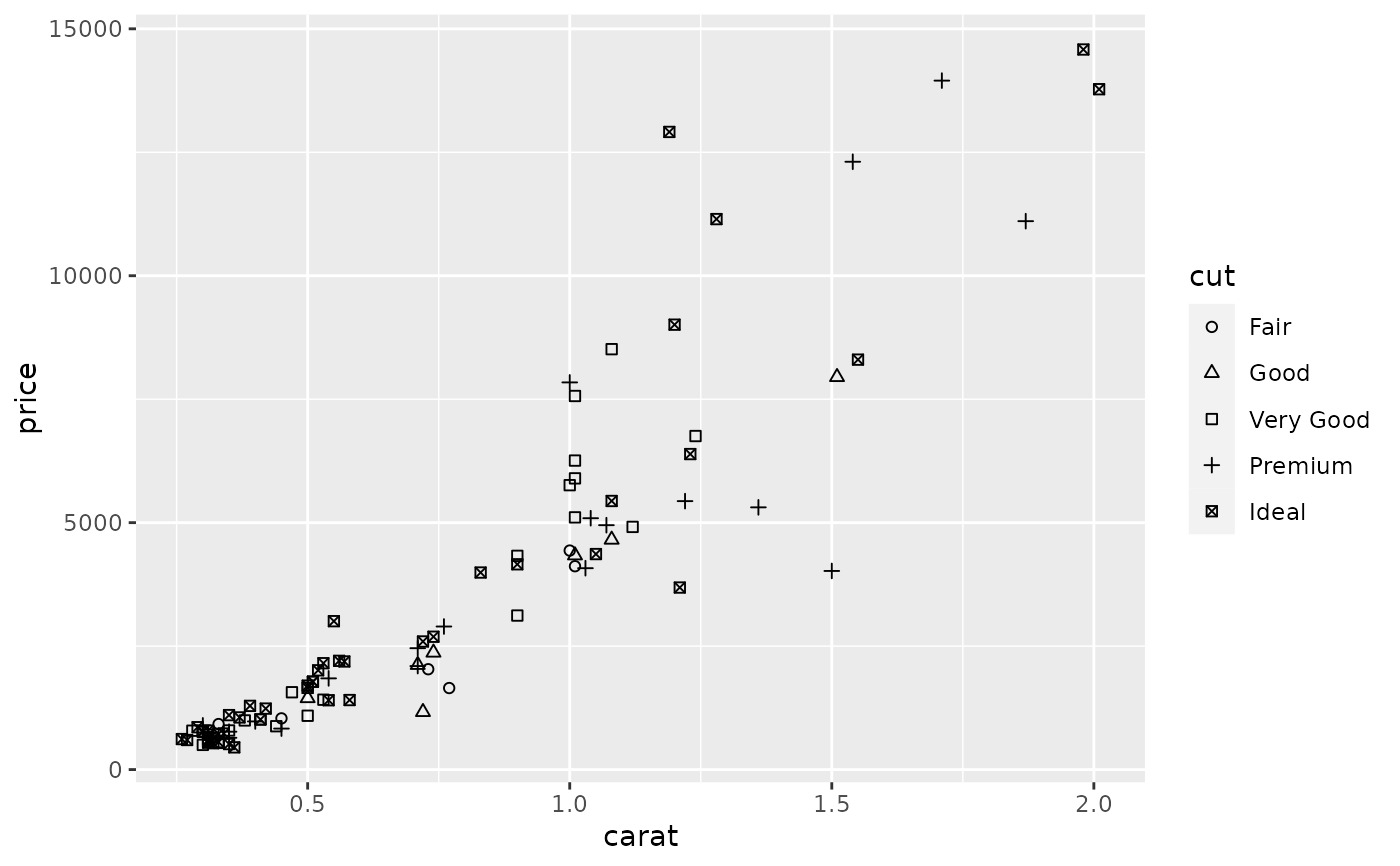
scale_shape() 将离散变量映射到六个易于辨别的形状。如果你的关卡超过六个,你会收到一条警告消息,第七个及后续关卡将不会出现在情节上。使用scale_shape_manual() 提供您自己的值。除非使用scale_shape_binned(),否则无法将连续变量映射到形状。不过,由于形状没有固有的顺序,因此不建议使用此方法。
参数
- ...
-
参数传递给
discrete_scalepalette-
调色板函数,当使用单个整数参数(比例中的级别数)调用时,返回它们应采用的值(例如
scales::hue_pal())。 breaks-
之一:
limits-
之一:
-
NULL使用默认比例值 -
定义可能的比例值及其顺序的字符向量
-
接受现有(自动)值并返回新值的函数。还接受 rlang lambda 函数表示法。
-
drop-
是否应该从量表中省略未使用的因子水平?默认值
TRUE使用数据中出现的级别;FALSE使用因子中的所有级别。 na.translate-
与连续尺度不同,离散尺度可以轻松显示缺失值,并且默认情况下会这样做。如果要从离散尺度中删除缺失值,请指定
na.translate = FALSE。 na.value-
如果
na.translate = TRUE,缺失值应该显示为什么美学值?不适用于NA始终位于最右侧的位置比例。 aesthetics-
该量表所适用的美学名称。
scale_name-
应用于与该比例关联的错误消息的比例名称。
name-
秤的名称。用作轴或图例标题。如果
waiver()(默认值),则比例名称取自用于该美学的第一个映射。如果是NULL,则图例标题将被省略。 labels-
之一:
guide-
用于创建指南或其名称的函数。有关详细信息,请参阅
guides()。 super-
用于构造比例的超类
- solid
-
形状应该是实心的
TRUE,还是空心的FALSE?
例子
set.seed(596)
dsmall <- diamonds[sample(nrow(diamonds), 100), ]

(d <- ggplot(dsmall, aes(carat, price)) + geom_point(aes(shape = cut)))
#> Warning: Using shapes for an ordinal variable is not advised

d + scale_shape(solid = TRUE) # the default

d + scale_shape(solid = FALSE)

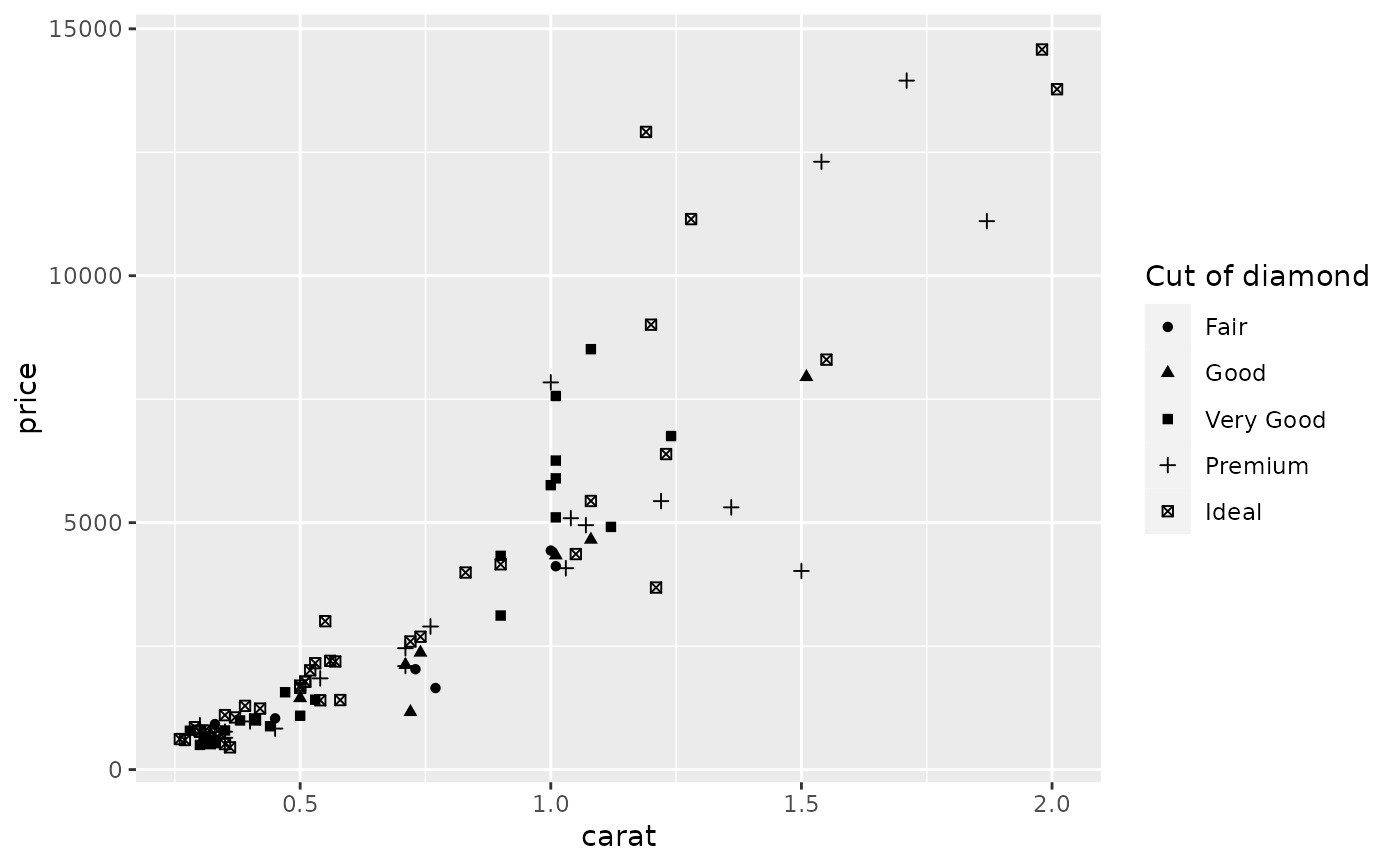
d + scale_shape(name = "Cut of diamond")


# To change order of levels, change order of
# underlying factor
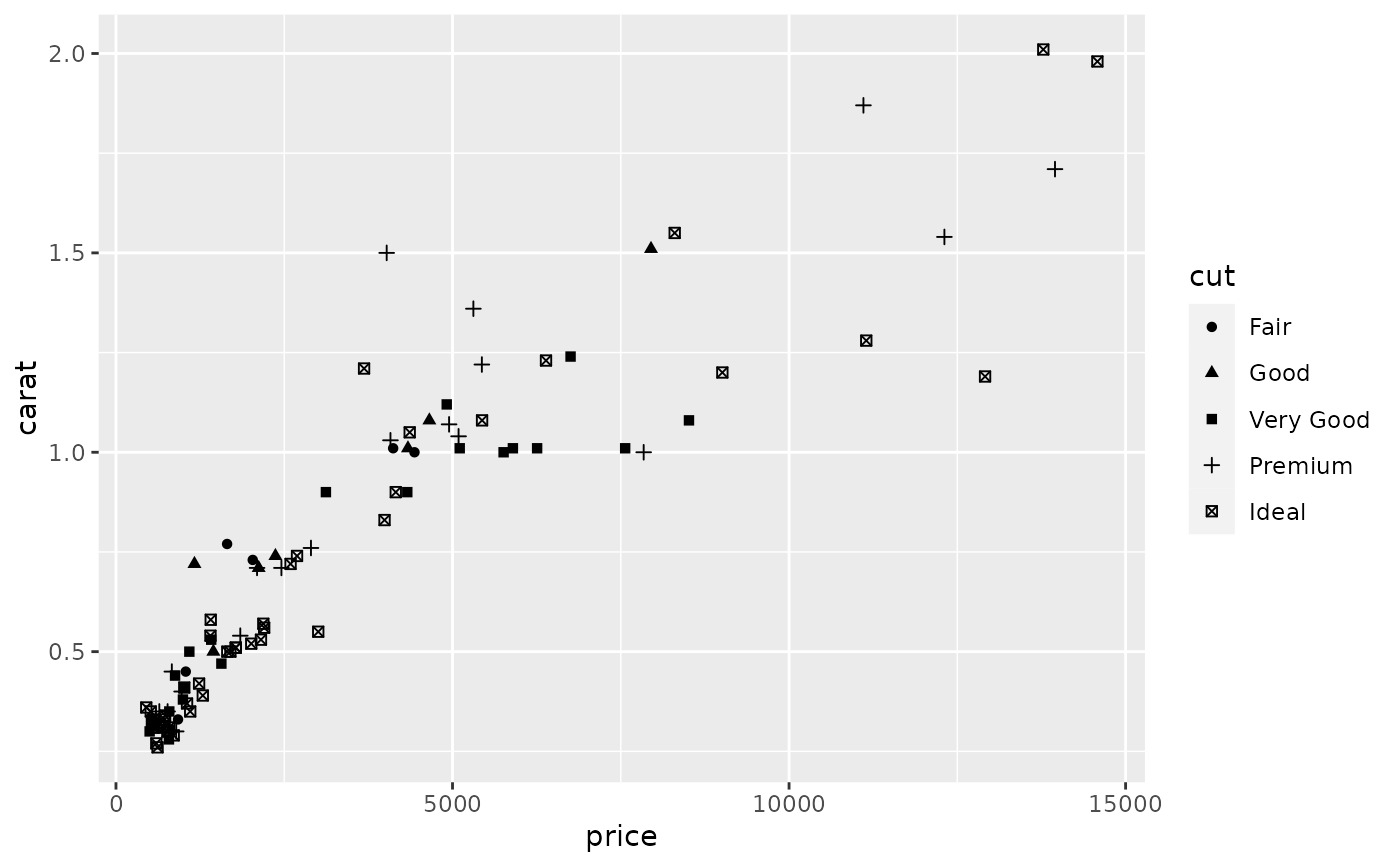
levels(dsmall$cut) <- c("Fair", "Good", "Very Good", "Premium", "Ideal")

# Need to recreate plot to pick up new data
ggplot(dsmall, aes(price, carat)) + geom_point(aes(shape = cut))
#> Warning: Using shapes for an ordinal variable is not advised


# Show a list of available shapes
df_shapes <- data.frame(shape = 0:24)
ggplot(df_shapes, aes(0, 0, shape = shape)) +
  geom_point(aes(shape = shape), size = 5, fill = 'red') +
  scale_shape_identity() +
  facet_wrap(~shape) +
  theme_void()

相关用法
- R ggplot2 scale_steps 分级渐变色标
- R ggplot2 scale_size 面积或半径比例
- R ggplot2 scale_gradient 渐变色阶
- R ggplot2 scale_viridis 来自 viridisLite 的 Viridis 色标
- R ggplot2 scale_grey 连续灰度色阶
- R ggplot2 scale_linetype 线条图案的比例
- R ggplot2 scale_discrete 离散数据的位置尺度
- R ggplot2 scale_manual 创建您自己的离散尺度
- R ggplot2 scale_colour_discrete 离散色阶
- R ggplot2 scale_date 日期/时间数据的位置刻度
- R ggplot2 scale_continuous 连续数据的位置比例(x 和 y)
- R ggplot2 scale_binned 用于对连续数据进行装箱的位置比例(x 和 y)
- R ggplot2 scale_alpha Alpha 透明度比例
- R ggplot2 scale_colour_continuous 连续色标和分级色标
- R ggplot2 scale_identity 使用不缩放的值
- R ggplot2 scale_linewidth 线宽比例
- R ggplot2 scale_hue 离散数据的均匀间隔颜色
- R ggplot2 scale_brewer ColorBrewer 的连续、发散和定性色标
- R ggplot2 stat_ellipse 计算法行数据椭圆
- R ggplot2 stat_identity 保留数据原样
- R ggplot2 stat_summary_2d 以二维形式进行分类和汇总(矩形和六边形)
- R ggplot2 should_stop 在示例中用于说明何时应该发生错误。
- R ggplot2 stat_summary 总结唯一/分箱 x 处的 y 值
- R ggplot2 stat_sf_coordinates 从“sf”对象中提取坐标
- R ggplot2 stat_unique 删除重复项
注:本文由纯净天空筛选整理自Hadley Wickham等大神的英文原创作品 Scales for shapes, aka glyphs。非经特殊声明,原始代码版权归原作者所有,本译文未经允许或授权,请勿转载或复制。
