这些是三个日期/时间类的默认比例。这些通常会自动添加。要手动覆盖,请使用 scale_*_date 表示日期(类 Date ),使用 scale_*_datetime 表示日期时间(类 POSIXct ),使用 scale_*_time 表示时间(类 hms )。
用法
scale_x_date(
  name = waiver(),
  breaks = waiver(),
  date_breaks = waiver(),
  labels = waiver(),
  date_labels = waiver(),
  minor_breaks = waiver(),
  date_minor_breaks = waiver(),
  limits = NULL,
  expand = waiver(),
  oob = censor,
  guide = waiver(),
  position = "bottom",
  sec.axis = waiver()
)

scale_y_date(
  name = waiver(),
  breaks = waiver(),
  date_breaks = waiver(),
  labels = waiver(),
  date_labels = waiver(),
  minor_breaks = waiver(),
  date_minor_breaks = waiver(),
  limits = NULL,
  expand = waiver(),
  oob = censor,
  guide = waiver(),
  position = "left",
  sec.axis = waiver()
)

scale_x_datetime(
  name = waiver(),
  breaks = waiver(),
  date_breaks = waiver(),
  labels = waiver(),
  date_labels = waiver(),
  minor_breaks = waiver(),
  date_minor_breaks = waiver(),
  timezone = NULL,
  limits = NULL,
  expand = waiver(),
  oob = censor,
  guide = waiver(),
  position = "bottom",
  sec.axis = waiver()
)

scale_y_datetime(
  name = waiver(),
  breaks = waiver(),
  date_breaks = waiver(),
  labels = waiver(),
  date_labels = waiver(),
  minor_breaks = waiver(),
  date_minor_breaks = waiver(),
  timezone = NULL,
  limits = NULL,
  expand = waiver(),
  oob = censor,
  guide = waiver(),
  position = "left",
  sec.axis = waiver()
)

scale_x_time(
  name = waiver(),
  breaks = waiver(),
  minor_breaks = waiver(),
  labels = waiver(),
  limits = NULL,
  expand = waiver(),
  oob = censor,
  na.value = NA_real_,
  guide = waiver(),
  position = "bottom",
  sec.axis = waiver()
)

scale_y_time(
  name = waiver(),
  breaks = waiver(),
  minor_breaks = waiver(),
  labels = waiver(),
  limits = NULL,
  expand = waiver(),
  oob = censor,
  na.value = NA_real_,
  guide = waiver(),
  position = "left",
  sec.axis = waiver()
)
参数
- name
-
秤的名称。用作轴或图例标题。如果
waiver()(默认值),则比例名称取自用于该美学的第一个映射。如果是NULL,则图例标题将被省略。 - breaks
-
之一:
-
NULL不间断 -
waiver()用于date_breaks指定的中断 -
给出中断位置的
Date/POSIXct向量 -
将限制作为输入并返回中断作为输出的函数
-
- date_breaks
-
给出中断之间距离的字符串,例如“2 周”或“10 年”。如果同时指定了
breaks和date_breaks,则date_breaks获胜。有效规范为'sec', 'min', 'hour', 'day', 'week', 'month' 或'year',可选地后跟's'。 - labels
-
之一:
- date_labels
-
给出标签格式规范的字符串。代码在
strftime()中定义。如果同时指定了labels和date_labels,则date_labels获胜。 - minor_breaks
-
之一:
-
NULL不间断 -
waiver()用于date_minor_breaks指定的中断 -
给出小中断位置的
Date/POSIXct向量 -
将限制作为输入并返回次要中断作为输出的函数
-
- date_minor_breaks
-
给出小中断之间距离的字符串,例如“2 周”或“10 年”。如果同时指定了
minor_breaks和date_minor_breaks,则date_minor_breaks获胜。有效规范为'sec', 'min', 'hour', 'day', 'week', 'month' 或'year',可选地后跟's'。 - limits
-
之一:
-
NULL使用默认比例范围 -
长度为 2 的数值向量,提供尺度限制。使用
NA来引用现有的最小值或最大值 -
接受现有(自动)限制并返回新限制的函数。还接受 rlang lambda 函数表示法。请注意,对位置比例设置限制将删除限制之外的数据。如果目的是缩放,请使用坐标系中的 limit 参数(请参阅
coord_cartesian())。
-
- expand
-
对于位置刻度,范围扩展常量的向量,用于在数据周围添加一些填充,以确保它们放置在距轴一定距离的位置。使用便捷函数
expansion()生成expand参数的值。默认情况下,对于连续变量,每侧扩展 5%,对于离散变量,每侧扩展 0.6 个单位。 - oob
-
之一:
-
处理超出范围限制(越界)的函数。还接受 rlang lambda 函数表示法。
-
默认值 (
scales::censor()) 将超出范围的值替换为NA。 -
scales::squish()用于将超出范围的值压缩到范围内。 -
scales::squish_infinite()用于将无限值压缩到范围内。
-
- guide
-
用于创建指南或其名称的函数。有关详细信息,请参阅
guides()。 - position
-
对于位置刻度,轴的位置。
left或right表示 y 轴,top或bottom表示 x 轴。 - sec.axis
-
sec_axis()用于指定辅助轴。 - timezone
-
用于在轴上显示的时区。默认值 (
NULL) 使用数据中编码的时区。 - na.value
-
缺失值将替换为该值。
也可以看看
sec_axis() 了解如何指定辅助轴
其他位置刻度:scale_x_binned()、scale_x_continuous()、scale_x_discrete()
例子
last_month <- Sys.Date() - 0:29
set.seed(1)
df <- data.frame(
date = last_month,
price = runif(30)
)
base <- ggplot(df, aes(date, price)) +
geom_line()
# The date scale will attempt to pick sensible defaults for
# major and minor tick marks. Override with date_breaks, date_labels
# date_minor_breaks arguments.
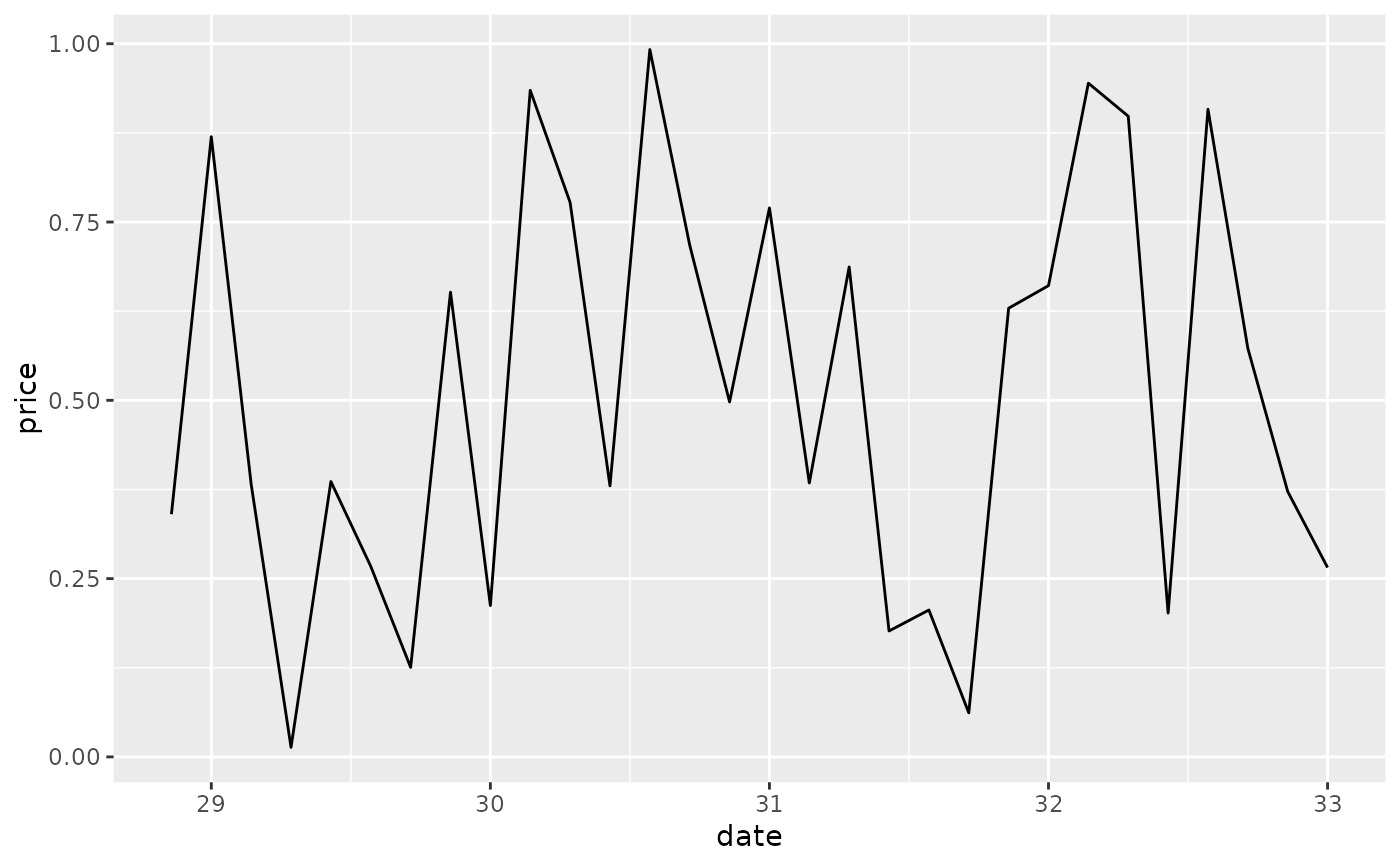
base + scale_x_date(date_labels = "%b %d")
 base + scale_x_date(date_breaks = "1 week", date_labels = "%W")
 base + scale_x_date(date_minor_breaks = "1 day")
 # Set limits
base + scale_x_date(limits = c(Sys.Date() - 7, NA))
#> Warning: Removed 22 rows containing missing values (`geom_line()`).
# Set limits
base + scale_x_date(limits = c(Sys.Date() - 7, NA))
#> Warning: Removed 22 rows containing missing values (`geom_line()`).

相关用法
- R ggplot2 scale_discrete 离散数据的位置尺度
- R ggplot2 scale_gradient 渐变色阶
- R ggplot2 scale_shape 形状比例,又称字形
- R ggplot2 scale_viridis 来自 viridisLite 的 Viridis 色标
- R ggplot2 scale_grey 连续灰度色阶
- R ggplot2 scale_linetype 线条图案的比例
- R ggplot2 scale_manual 创建您自己的离散尺度
- R ggplot2 scale_colour_discrete 离散色阶
- R ggplot2 scale_steps 分级渐变色标
- R ggplot2 scale_size 面积或半径比例
- R ggplot2 scale_continuous 连续数据的位置比例(x 和 y)
- R ggplot2 scale_binned 用于对连续数据进行装箱的位置比例(x 和 y)
- R ggplot2 scale_alpha Alpha 透明度比例
- R ggplot2 scale_colour_continuous 连续色标和分级色标
- R ggplot2 scale_identity 使用不缩放的值
- R ggplot2 scale_linewidth 线宽比例
- R ggplot2 scale_hue 离散数据的均匀间隔颜色
- R ggplot2 scale_brewer ColorBrewer 的连续、发散和定性色标
- R ggplot2 stat_ellipse 计算法行数据椭圆
- R ggplot2 stat_identity 保留数据原样
- R ggplot2 stat_summary_2d 以二维形式进行分类和汇总(矩形和六边形)
- R ggplot2 should_stop 在示例中用于说明何时应该发生错误。
- R ggplot2 stat_summary 总结唯一/分箱 x 处的 y 值
- R ggplot2 stat_sf_coordinates 从“sf”对象中提取坐标
- R ggplot2 stat_unique 删除重复项
注:本文由纯净天空筛选整理自Hadley Wickham等大神的英文原创作品 Position scales for date/time data。非经特殊声明,原始代码版权归原作者所有,本译文未经允许或授权,请勿转载或复制。