笛卡尔坐标系是最熟悉也是最常见的坐标系类型。在坐标系上设置限制将缩放绘图(就像您用放大镜查看它一样),并且不会像在比例上设置限制那样改变基础数据。
参数
- xlim, ylim
-
x 轴和 y 轴的限制。
- expand
-
如果
TRUE(默认值)会在限制中添加一个小的扩展因子,以确保数据和轴不重叠。如果FALSE,则完全从数据或xlim/ylim中获取限制。 - default
-
这是默认的坐标系吗?如果
FALSE(默认值),则将此坐标系替换为另一个坐标系会创建一条消息,提醒用户坐标系正在被替换。如果TRUE,则该警告被抑制。 - clip
-
是否应该将绘图裁剪到绘图面板的范围内?设置
"on"(默认)表示是,设置"off"表示否。在大多数情况下,不应更改"on"的默认值,因为设置clip = "off"可能会导致意外结果。它允许在绘图上的任何位置绘制数据点,包括绘图边。如果通过xlim和ylim设置限制,并且某些数据点超出这些限制,则这些数据点可能会显示在轴、图例、绘图标题或绘图边距等位置。
例子
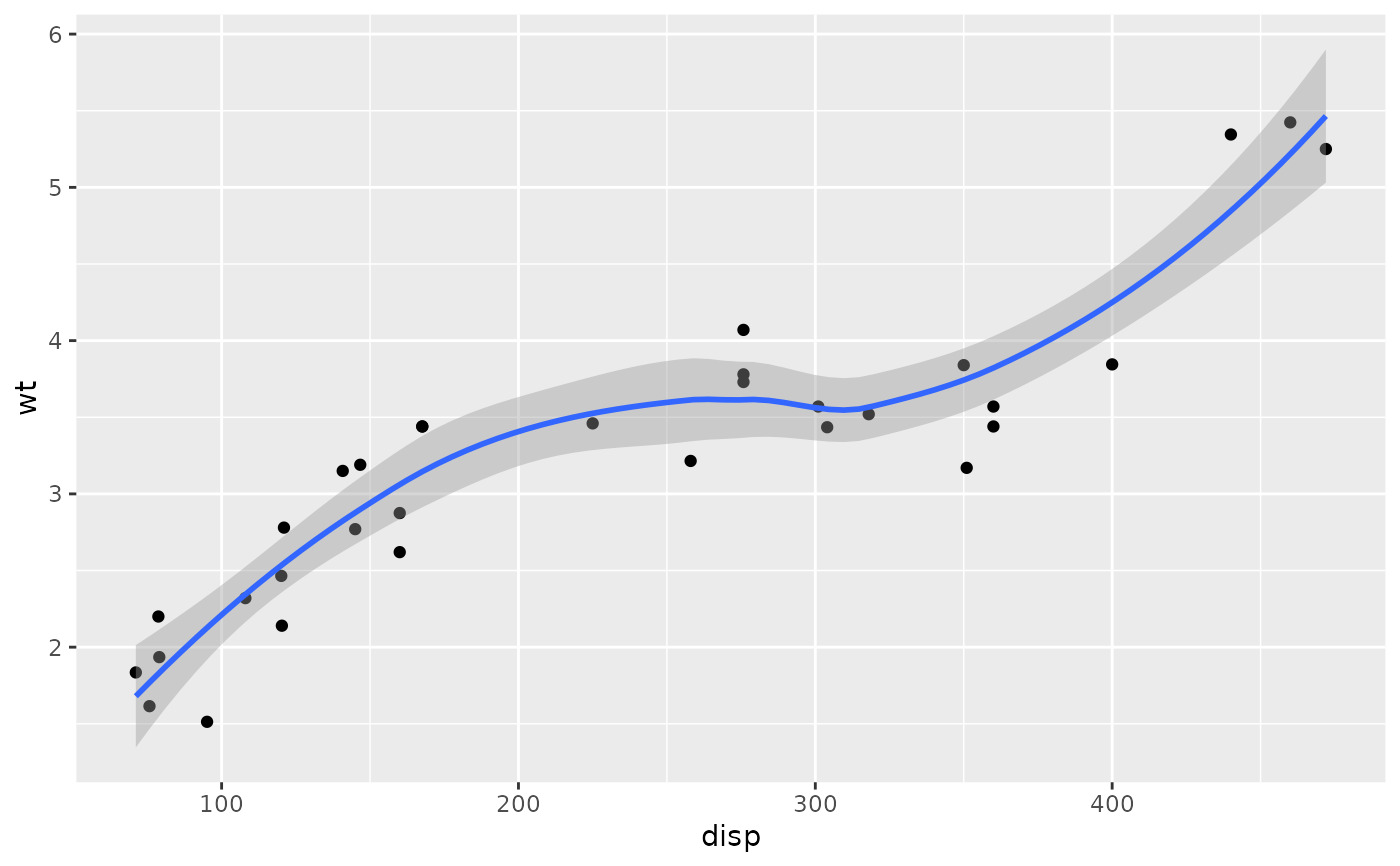
# There are two ways of zooming the plot display: with scales or
# with coordinate systems. They work in two rather different ways.
p <- ggplot(mtcars, aes(disp, wt)) +
geom_point() +
geom_smooth()
p
#> `geom_smooth()` using method = 'loess' and formula = 'y ~ x'
 # Setting the limits on a scale converts all values outside the range to NA.
p + scale_x_continuous(limits = c(325, 500))
#> `geom_smooth()` using method = 'loess' and formula = 'y ~ x'
#> Warning: Removed 24 rows containing non-finite values (`stat_smooth()`).
#> Warning: Removed 24 rows containing missing values (`geom_point()`).
# Setting the limits on a scale converts all values outside the range to NA.
p + scale_x_continuous(limits = c(325, 500))
#> `geom_smooth()` using method = 'loess' and formula = 'y ~ x'
#> Warning: Removed 24 rows containing non-finite values (`stat_smooth()`).
#> Warning: Removed 24 rows containing missing values (`geom_point()`).
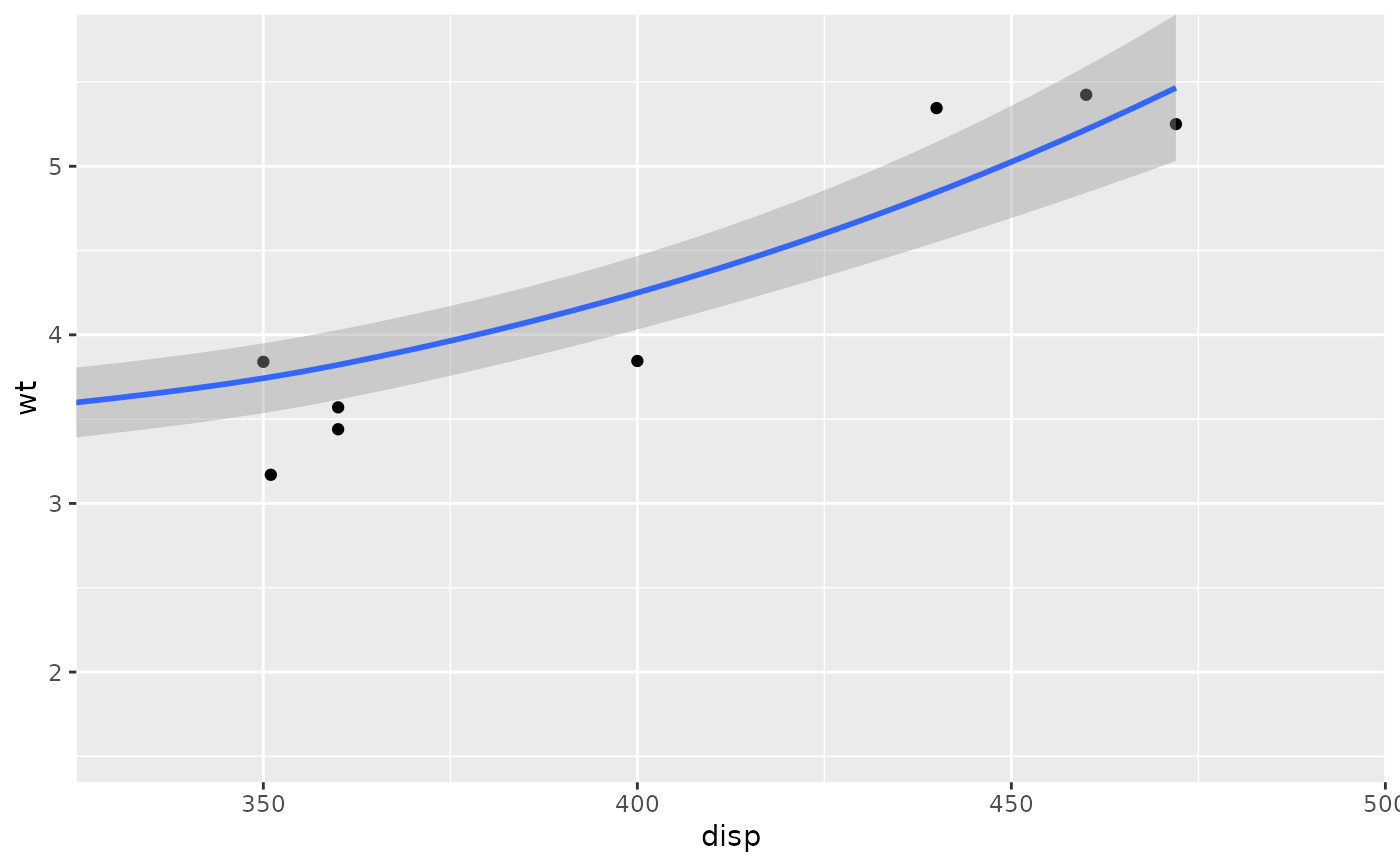
 # Setting the limits on the coordinate system performs a visual zoom.
# The data is unchanged, and we just view a small portion of the original
# plot. Note how smooth continues past the points visible on this plot.
p + coord_cartesian(xlim = c(325, 500))
#> `geom_smooth()` using method = 'loess' and formula = 'y ~ x'
# Setting the limits on the coordinate system performs a visual zoom.
# The data is unchanged, and we just view a small portion of the original
# plot. Note how smooth continues past the points visible on this plot.
p + coord_cartesian(xlim = c(325, 500))
#> `geom_smooth()` using method = 'loess' and formula = 'y ~ x'
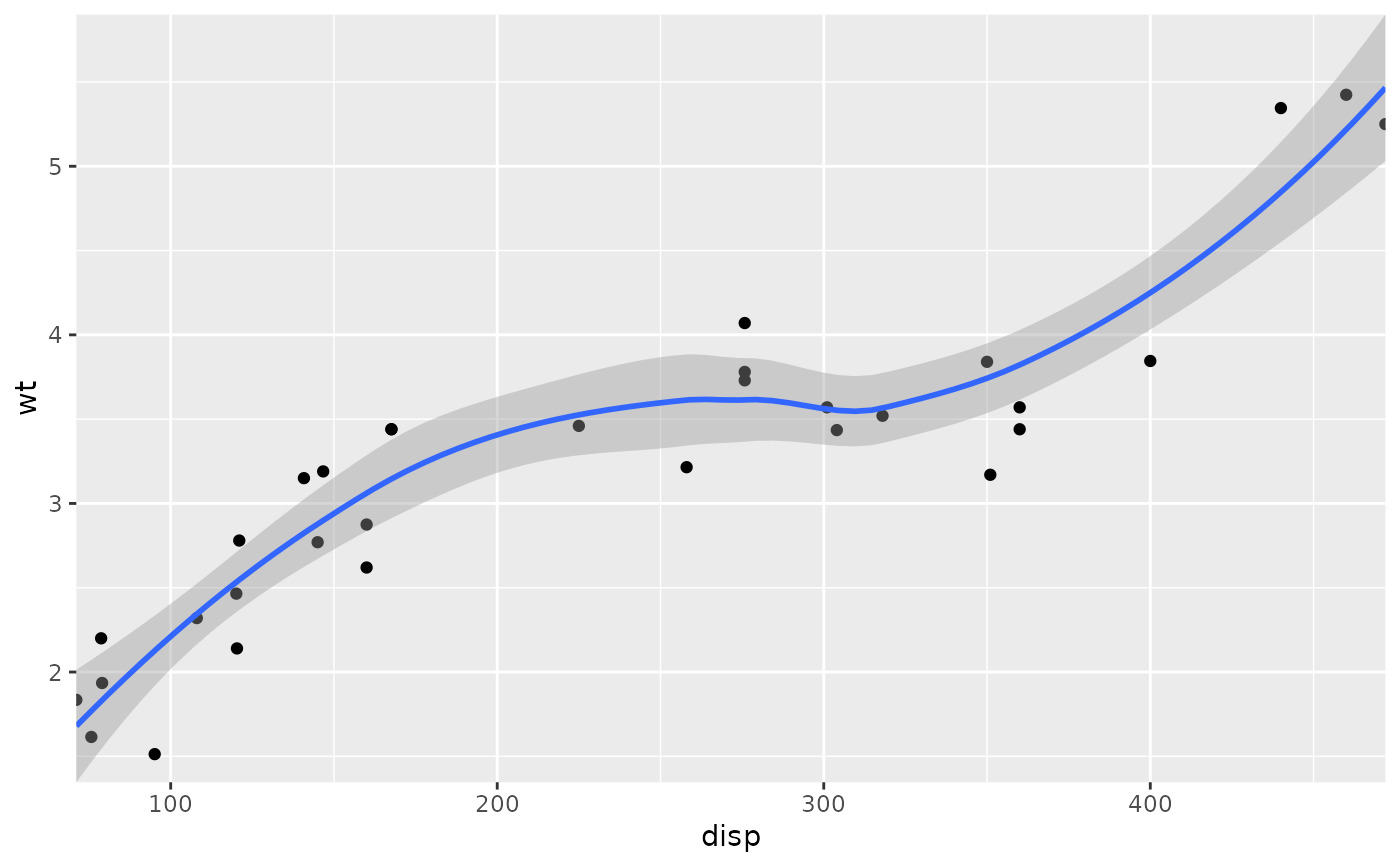
 # By default, the same expansion factor is applied as when setting scale
# limits. You can set the limits precisely by setting expand = FALSE
p + coord_cartesian(xlim = c(325, 500), expand = FALSE)
#> `geom_smooth()` using method = 'loess' and formula = 'y ~ x'
# By default, the same expansion factor is applied as when setting scale
# limits. You can set the limits precisely by setting expand = FALSE
p + coord_cartesian(xlim = c(325, 500), expand = FALSE)
#> `geom_smooth()` using method = 'loess' and formula = 'y ~ x'
 # Simiarly, we can use expand = FALSE to turn off expansion with the
# default limits
p + coord_cartesian(expand = FALSE)
#> `geom_smooth()` using method = 'loess' and formula = 'y ~ x'
# Simiarly, we can use expand = FALSE to turn off expansion with the
# default limits
p + coord_cartesian(expand = FALSE)
#> `geom_smooth()` using method = 'loess' and formula = 'y ~ x'
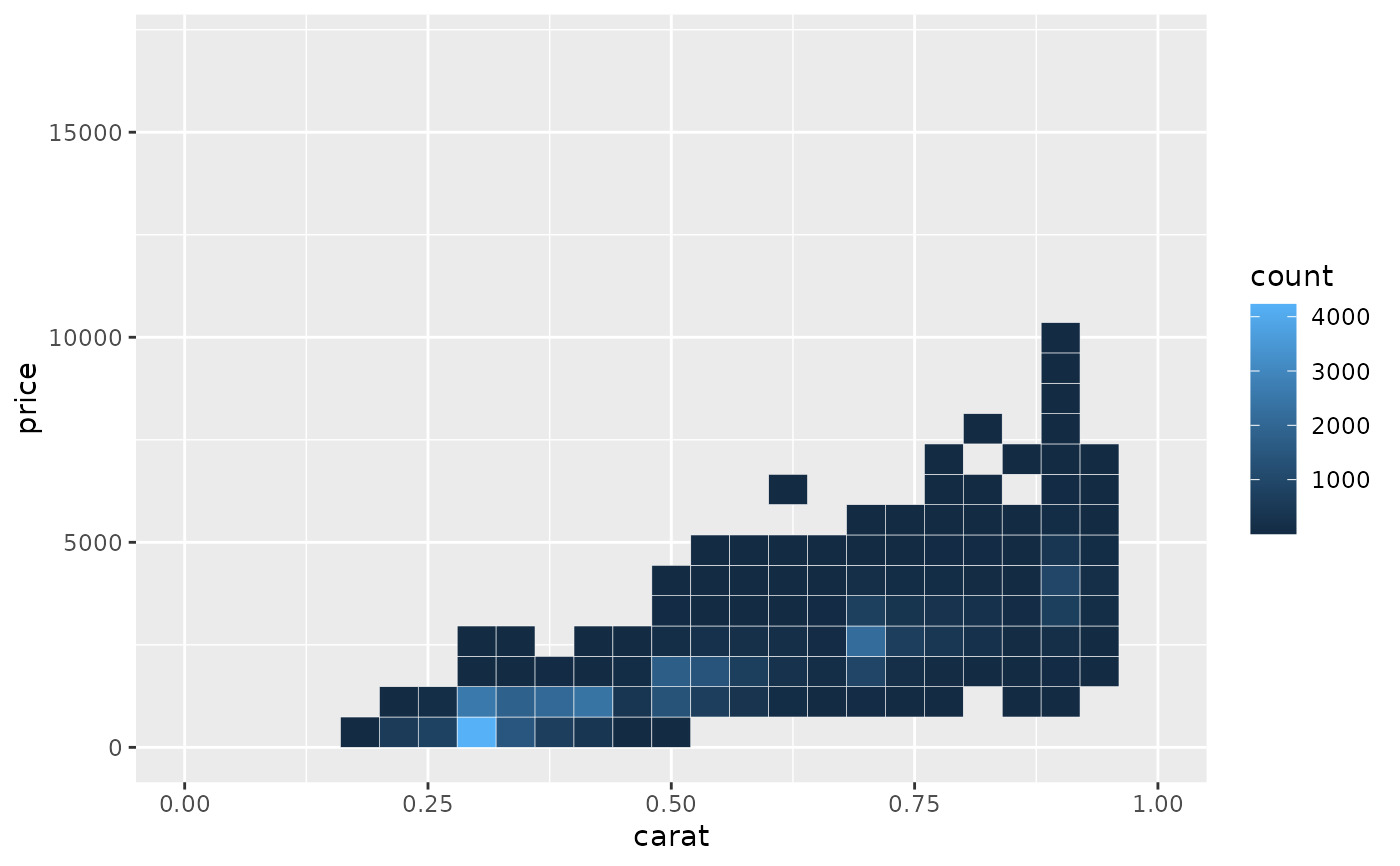
 # You can see the same thing with this 2d histogram
d <- ggplot(diamonds, aes(carat, price)) +
stat_bin2d(bins = 25, colour = "white")
d
# You can see the same thing with this 2d histogram
d <- ggplot(diamonds, aes(carat, price)) +
stat_bin2d(bins = 25, colour = "white")
d
 # When zooming the scale, the we get 25 new bins that are the same
# size on the plot, but represent smaller regions of the data space
d + scale_x_continuous(limits = c(0, 1))
#> Warning: Removed 17502 rows containing non-finite values (`stat_bin2d()`).
#> Warning: Removed 17 rows containing missing values (`geom_tile()`).
# When zooming the scale, the we get 25 new bins that are the same
# size on the plot, but represent smaller regions of the data space
d + scale_x_continuous(limits = c(0, 1))
#> Warning: Removed 17502 rows containing non-finite values (`stat_bin2d()`).
#> Warning: Removed 17 rows containing missing values (`geom_tile()`).
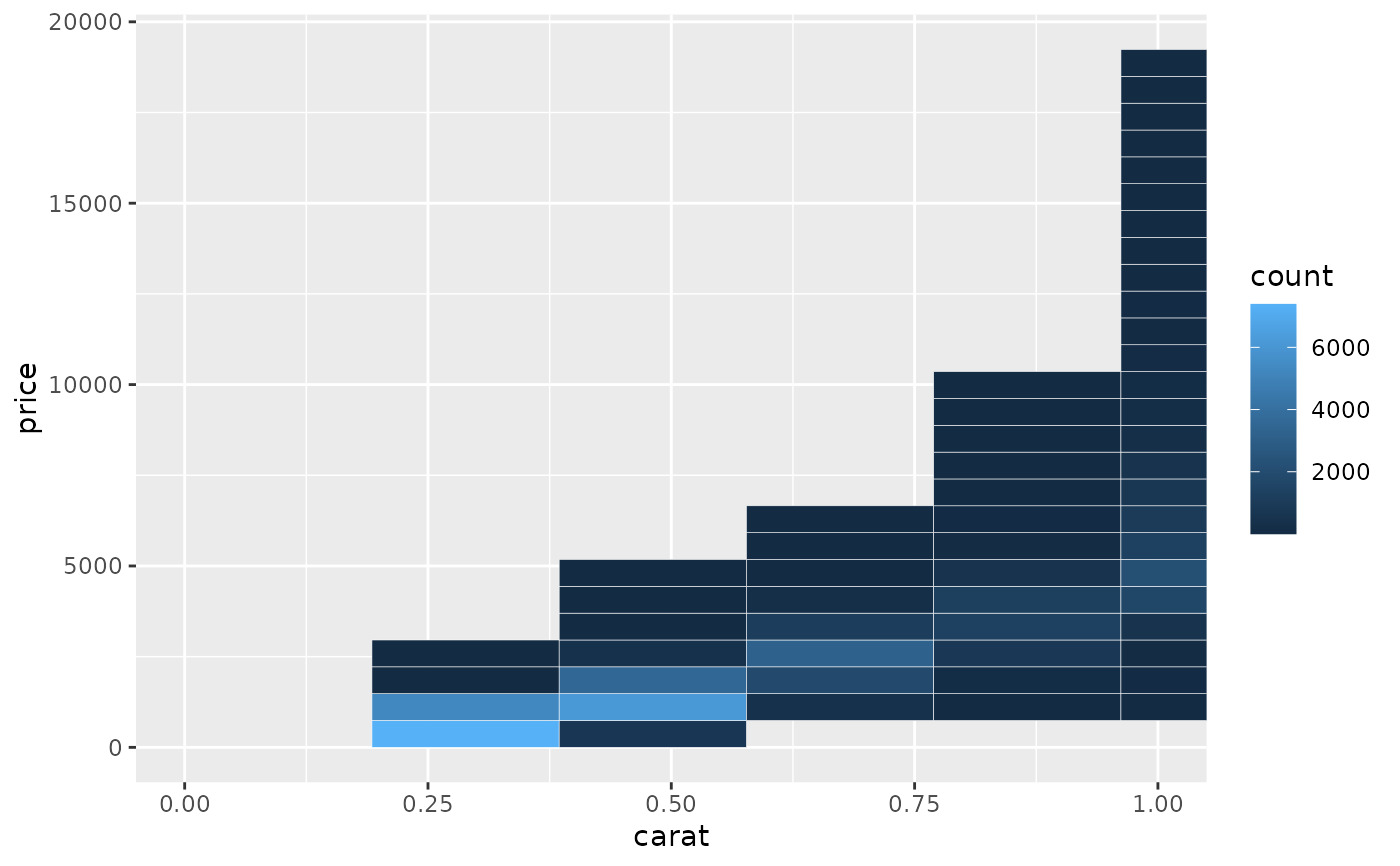
 # When zooming the coordinate system, we see a subset of original 50 bins,
# displayed bigger
d + coord_cartesian(xlim = c(0, 1))
# When zooming the coordinate system, we see a subset of original 50 bins,
# displayed bigger
d + coord_cartesian(xlim = c(0, 1))
相关用法
- R ggplot2 coord_fixed 具有固定“纵横比”的笛卡尔坐标
- R ggplot2 coord_map Map投影
- R ggplot2 coord_polar 极坐标
- R ggplot2 coord_trans 变换后的笛卡尔坐标系
- R ggplot2 coord_flip x 和 y 翻转的笛卡尔坐标
- R ggplot2 cut_interval 将数值数据离散化为分类数据
- R ggplot2 annotation_logticks 注释:记录刻度线
- R ggplot2 vars 引用分面变量
- R ggplot2 position_stack 将重叠的对象堆叠在一起
- R ggplot2 geom_qq 分位数-分位数图
- R ggplot2 geom_spoke 由位置、方向和距离参数化的线段
- R ggplot2 geom_quantile 分位数回归
- R ggplot2 geom_text 文本
- R ggplot2 get_alt_text 从绘图中提取替代文本
- R ggplot2 annotation_custom 注释:自定义grob
- R ggplot2 geom_ribbon 函数区和面积图
- R ggplot2 stat_ellipse 计算法行数据椭圆
- R ggplot2 resolution 计算数值向量的“分辨率”
- R ggplot2 geom_boxplot 盒须图(Tukey 风格)
- R ggplot2 lims 设置规模限制
- R ggplot2 geom_hex 二维箱计数的六边形热图
- R ggplot2 scale_gradient 渐变色阶
- R ggplot2 scale_shape 形状比例,又称字形
- R ggplot2 geom_bar 条形图
- R ggplot2 draw_key 图例的关键字形
注:本文由纯净天空筛选整理自Hadley Wickham等大神的英文原创作品 Cartesian coordinates。非经特殊声明,原始代码版权归原作者所有,本译文未经允许或授权,请勿转载或复制。