这是向各个比例提供 limits 参数的快捷方式。默认情况下,任何超出指定限制的值都将替换为 NA 。请注意,这将删除超出限制的数据,并可能产生意想不到的结果。要在不删除数据观测的情况下更改 x 或 y 轴限制,请参阅 coord_cartesian() 。
参数
- ...
-
对于
xlim()和ylim():两个数值,指定刻度的左/下限和右/上限。如果先给出较大的值,则比例将相反。如果您想从数据范围计算相应的限制,可以将一个值保留为NA。对于
lims():名称-值对。名称必须美观,值必须是长度为 2 的数字、字符、因子或日期/时间。数值将创建连续的比例。如果较大的值先出现,则比例将反转。如果您想根据数据范围计算相应的限制,可以将一个值保留为NA。字符或因子值将创建离散比例。日期时间值将创建连续的日期/时间刻度。
也可以看看
要扩展绘图范围以始终包含某些值,请参阅 expand_limits() 。对于其他类型的数据,请参阅 scale_x_discrete() 、 scale_x_continuous() 、 scale_x_date() 。
例子
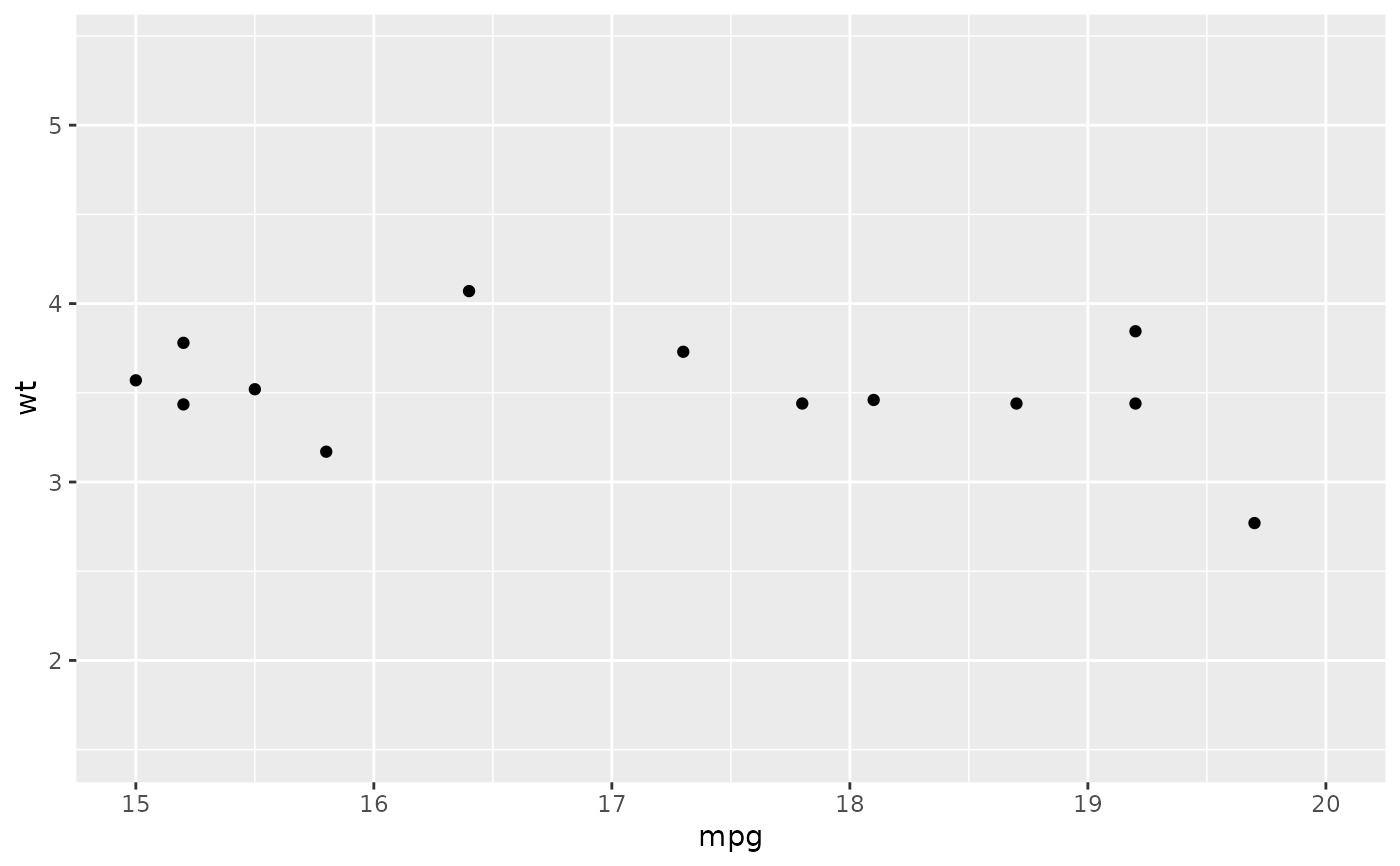
# Zoom into a specified area
ggplot(mtcars, aes(mpg, wt)) +
geom_point() +
xlim(15, 20)
#> Warning: Removed 19 rows containing missing values (`geom_point()`).
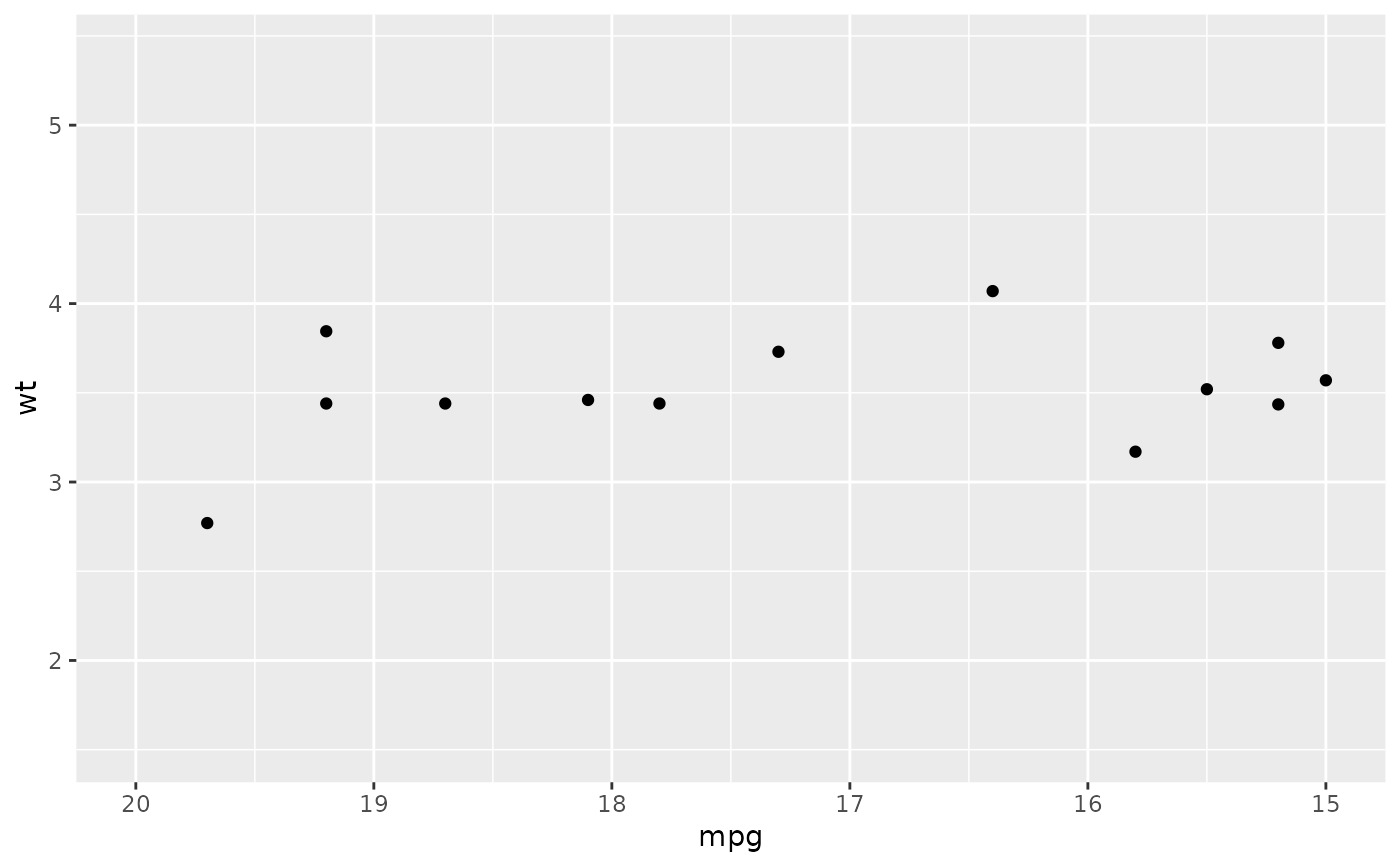
 # reverse scale
ggplot(mtcars, aes(mpg, wt)) +
geom_point() +
xlim(20, 15)
#> Warning: Removed 19 rows containing missing values (`geom_point()`).
# reverse scale
ggplot(mtcars, aes(mpg, wt)) +
geom_point() +
xlim(20, 15)
#> Warning: Removed 19 rows containing missing values (`geom_point()`).
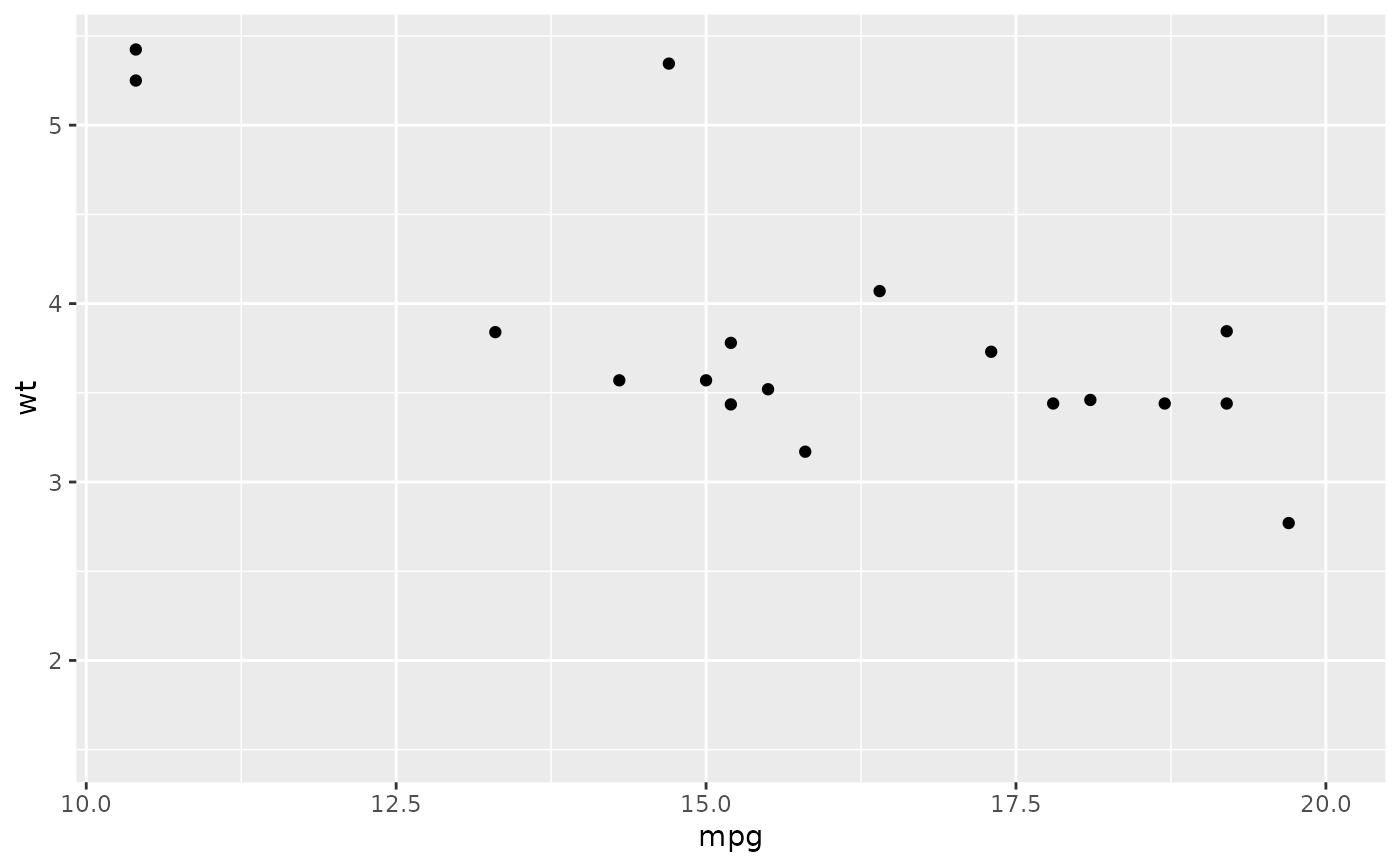
 # with automatic lower limit
ggplot(mtcars, aes(mpg, wt)) +
geom_point() +
xlim(NA, 20)
#> Warning: Removed 14 rows containing missing values (`geom_point()`).
# with automatic lower limit
ggplot(mtcars, aes(mpg, wt)) +
geom_point() +
xlim(NA, 20)
#> Warning: Removed 14 rows containing missing values (`geom_point()`).
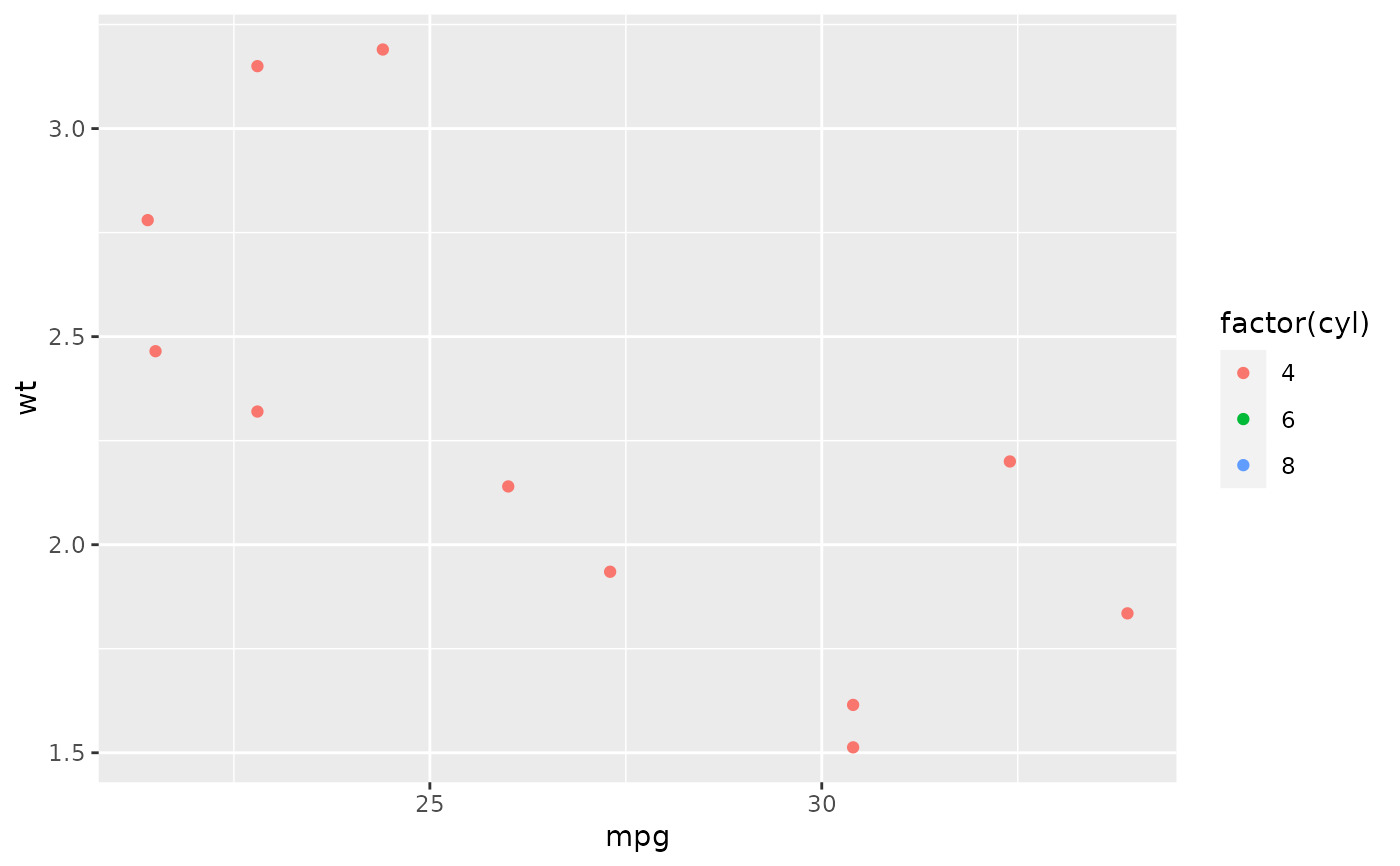
 # You can also supply limits that are larger than the data.
# This is useful if you want to match scales across different plots
small <- subset(mtcars, cyl == 4)
big <- subset(mtcars, cyl > 4)
ggplot(small, aes(mpg, wt, colour = factor(cyl))) +
geom_point() +
lims(colour = c("4", "6", "8"))
# You can also supply limits that are larger than the data.
# This is useful if you want to match scales across different plots
small <- subset(mtcars, cyl == 4)
big <- subset(mtcars, cyl > 4)
ggplot(small, aes(mpg, wt, colour = factor(cyl))) +
geom_point() +
lims(colour = c("4", "6", "8"))
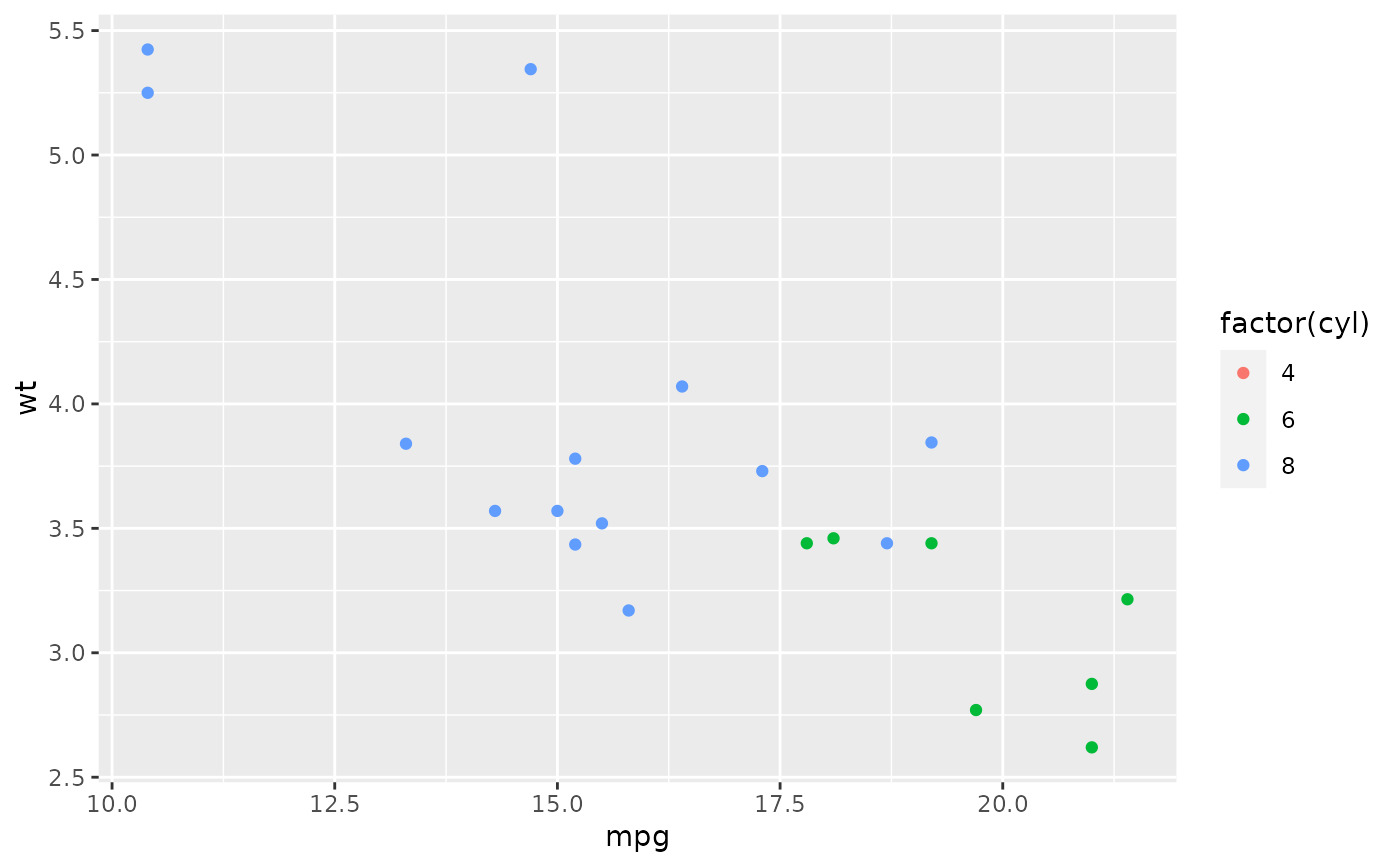
 ggplot(big, aes(mpg, wt, colour = factor(cyl))) +
geom_point() +
lims(colour = c("4", "6", "8"))
ggplot(big, aes(mpg, wt, colour = factor(cyl))) +
geom_point() +
lims(colour = c("4", "6", "8"))
 # There are two ways of setting the axis limits: with limits or
# with coordinate systems. They work in two rather different ways.
set.seed(1)
last_month <- Sys.Date() - 0:59
df <- data.frame(
date = last_month,
price = c(rnorm(30, mean = 15), runif(30) + 0.2 * (1:30))
)
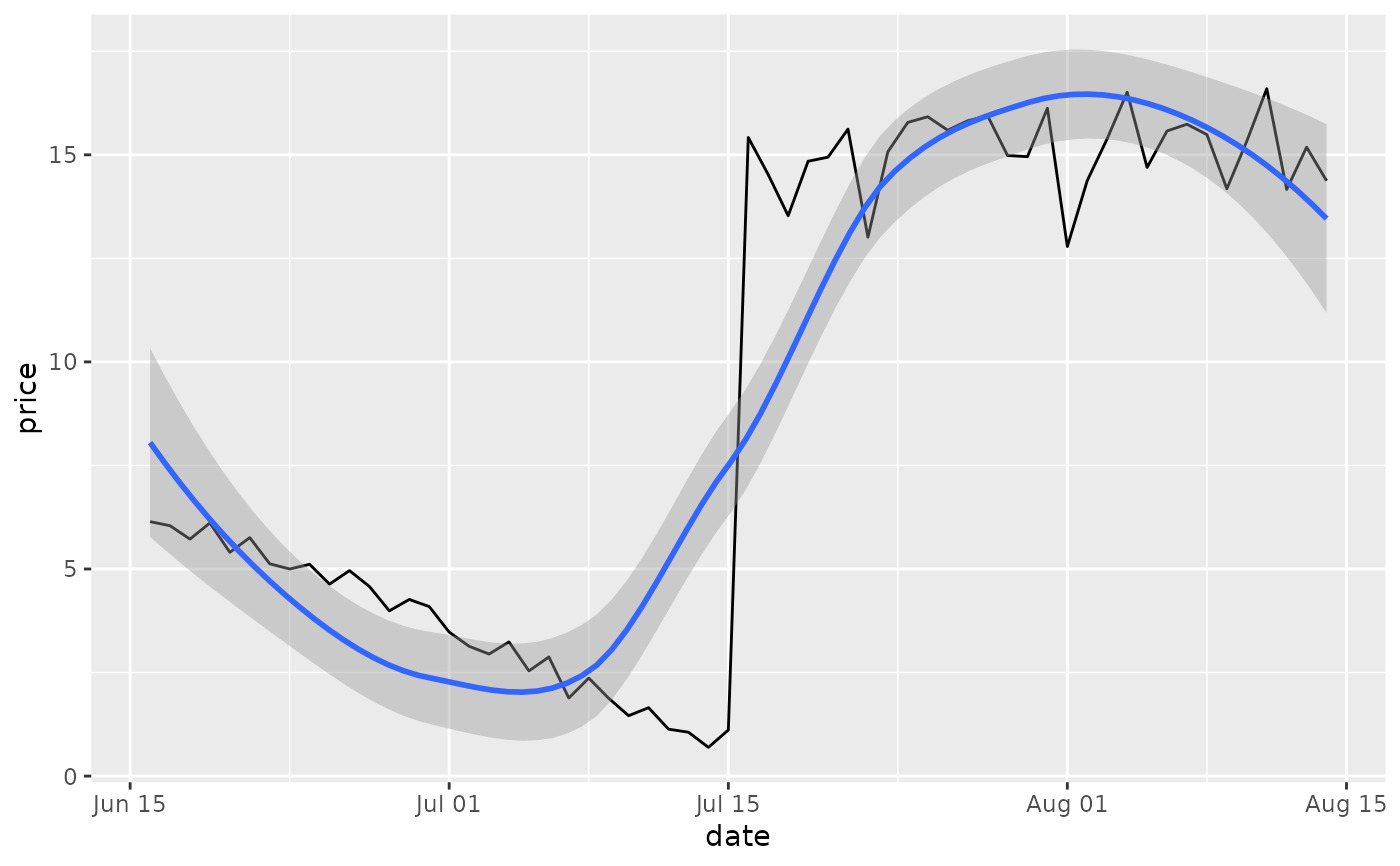
p <- ggplot(df, aes(date, price)) +
geom_line() +
stat_smooth()
p
#> `geom_smooth()` using method = 'loess' and formula = 'y ~ x'
# There are two ways of setting the axis limits: with limits or
# with coordinate systems. They work in two rather different ways.
set.seed(1)
last_month <- Sys.Date() - 0:59
df <- data.frame(
date = last_month,
price = c(rnorm(30, mean = 15), runif(30) + 0.2 * (1:30))
)
p <- ggplot(df, aes(date, price)) +
geom_line() +
stat_smooth()
p
#> `geom_smooth()` using method = 'loess' and formula = 'y ~ x'
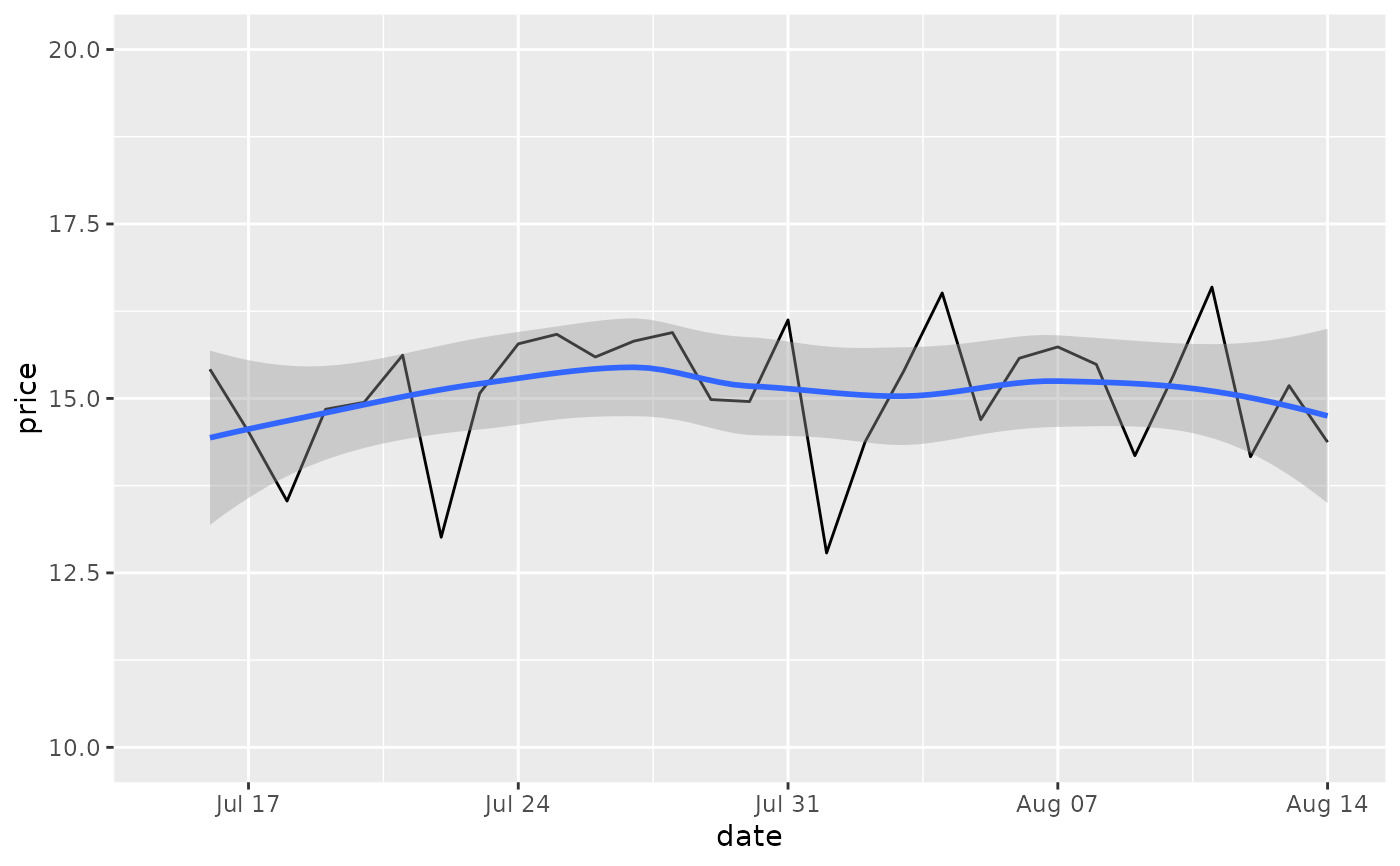
 # Setting the limits with the scale discards all data outside the range.
p + lims(x= c(Sys.Date() - 30, NA), y = c(10, 20))
#> `geom_smooth()` using method = 'loess' and formula = 'y ~ x'
#> Warning: Removed 30 rows containing non-finite values (`stat_smooth()`).
#> Warning: Removed 30 rows containing missing values (`geom_line()`).
# Setting the limits with the scale discards all data outside the range.
p + lims(x= c(Sys.Date() - 30, NA), y = c(10, 20))
#> `geom_smooth()` using method = 'loess' and formula = 'y ~ x'
#> Warning: Removed 30 rows containing non-finite values (`stat_smooth()`).
#> Warning: Removed 30 rows containing missing values (`geom_line()`).
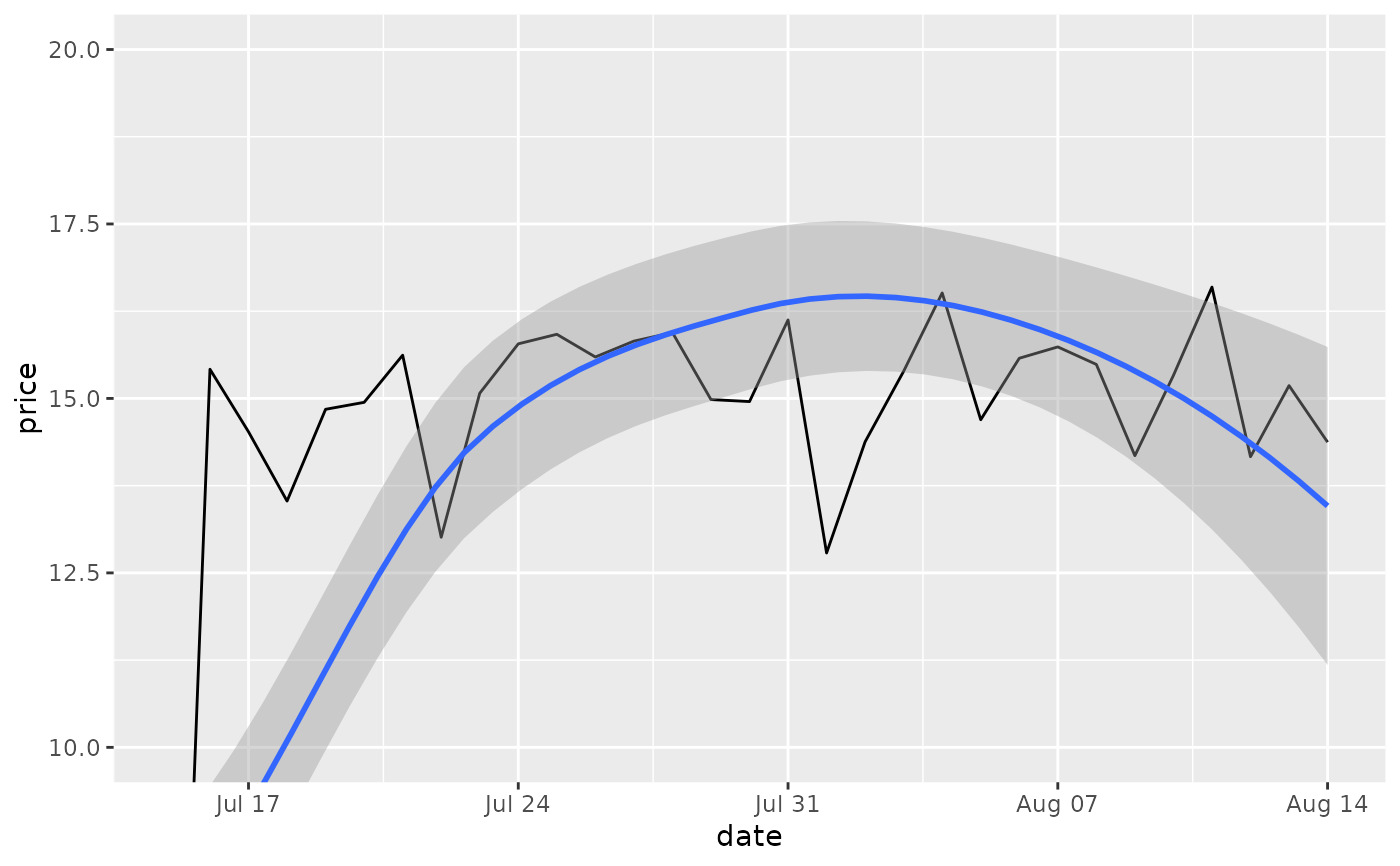
 # For changing x or y axis limits **without** dropping data
# observations use [coord_cartesian()]. Setting the limits on the
# coordinate system performs a visual zoom.
p + coord_cartesian(xlim =c(Sys.Date() - 30, NA), ylim = c(10, 20))
#> `geom_smooth()` using method = 'loess' and formula = 'y ~ x'
# For changing x or y axis limits **without** dropping data
# observations use [coord_cartesian()]. Setting the limits on the
# coordinate system performs a visual zoom.
p + coord_cartesian(xlim =c(Sys.Date() - 30, NA), ylim = c(10, 20))
#> `geom_smooth()` using method = 'loess' and formula = 'y ~ x'
相关用法
- R ggplot2 label_bquote 带有数学表达式的标签
- R ggplot2 labeller 构建标签规范
- R ggplot2 layer 创建一个新层
- R ggplot2 labs 修改轴、图例和绘图标签
- R ggplot2 labellers 有用的贴标机函数
- R ggplot2 annotation_logticks 注释:记录刻度线
- R ggplot2 vars 引用分面变量
- R ggplot2 position_stack 将重叠的对象堆叠在一起
- R ggplot2 geom_qq 分位数-分位数图
- R ggplot2 geom_spoke 由位置、方向和距离参数化的线段
- R ggplot2 geom_quantile 分位数回归
- R ggplot2 geom_text 文本
- R ggplot2 get_alt_text 从绘图中提取替代文本
- R ggplot2 annotation_custom 注释:自定义grob
- R ggplot2 geom_ribbon 函数区和面积图
- R ggplot2 stat_ellipse 计算法行数据椭圆
- R ggplot2 resolution 计算数值向量的“分辨率”
- R ggplot2 geom_boxplot 盒须图(Tukey 风格)
- R ggplot2 geom_hex 二维箱计数的六边形热图
- R ggplot2 scale_gradient 渐变色阶
- R ggplot2 scale_shape 形状比例,又称字形
- R ggplot2 geom_bar 条形图
- R ggplot2 draw_key 图例的关键字形
- R ggplot2 annotate 创建注释层
- R ggplot2 annotation_map 注释:Map
注:本文由纯净天空筛选整理自Hadley Wickham等大神的英文原创作品 Set scale limits。非经特殊声明,原始代码版权归原作者所有,本译文未经允许或授权,请勿转载或复制。