这是一个特殊的几何图形,旨在用作每个面板中相同的静态注释。这些注释不会影响比例(即 x 和 y 轴不会增长以覆盖 grob 的范围,并且 grob 不会被任何 ggplot 设置或映射修改)。
注意
annotation_custom() 期望 grob 填充由 xmin、xmax、ymin、ymax 定义的整个视口。该区域中具有不同(绝对)大小的 Grob 将为center-justified。 Inf 值可用于填充整个绘图面板(参见示例)。
例子
# Dummy plot
df <- data.frame(x = 1:10, y = 1:10)
base <- ggplot(df, aes(x, y)) +
geom_blank() +
theme_bw()
# Full panel annotation
base + annotation_custom(
grob = grid::roundrectGrob(),
xmin = -Inf, xmax = Inf, ymin = -Inf, ymax = Inf
)
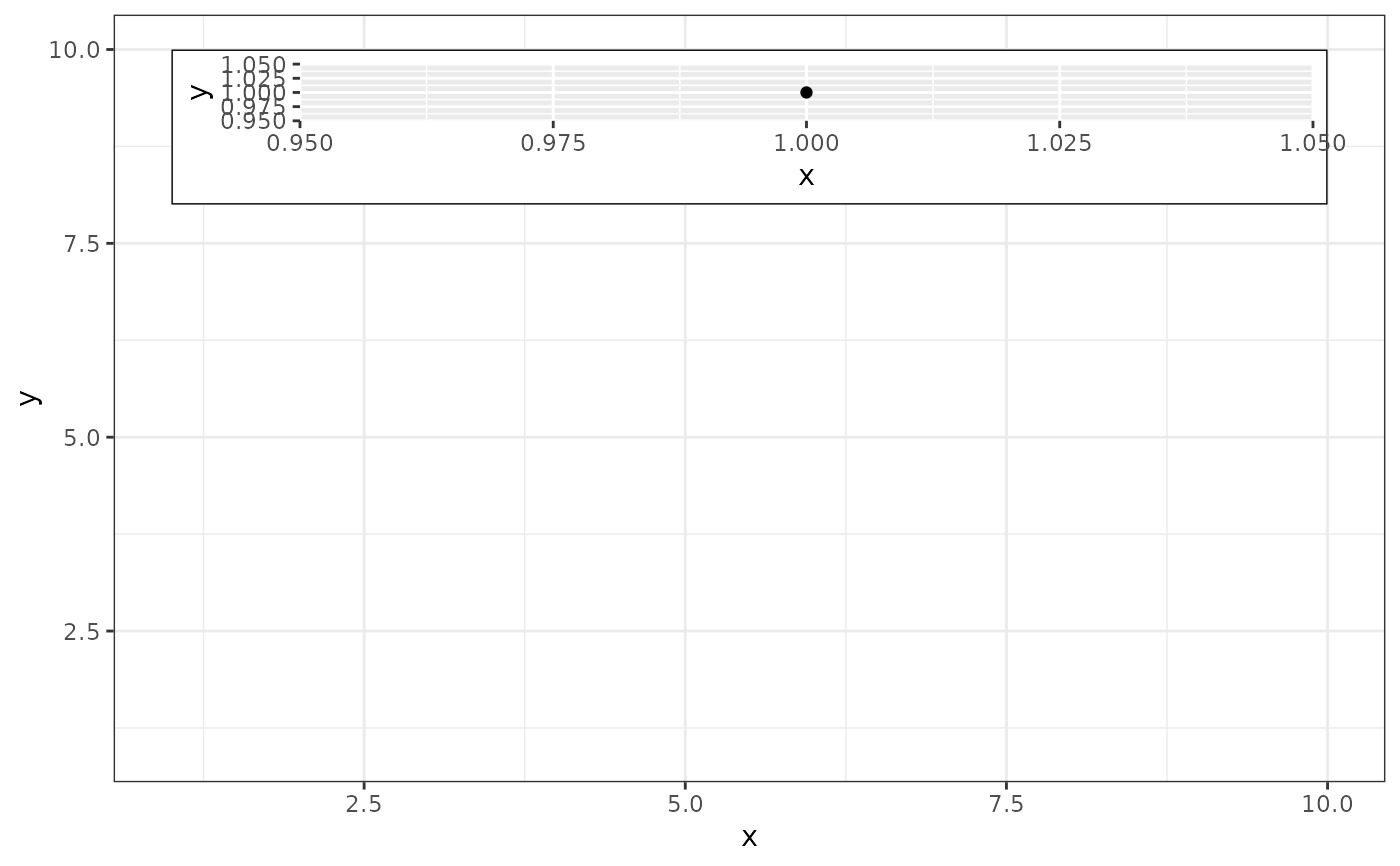
 # Inset plot
df2 <- data.frame(x = 1 , y = 1)
g <- ggplotGrob(ggplot(df2, aes(x, y)) +
geom_point() +
theme(plot.background = element_rect(colour = "black")))
base +
annotation_custom(grob = g, xmin = 1, xmax = 10, ymin = 8, ymax = 10)
# Inset plot
df2 <- data.frame(x = 1 , y = 1)
g <- ggplotGrob(ggplot(df2, aes(x, y)) +
geom_point() +
theme(plot.background = element_rect(colour = "black")))
base +
annotation_custom(grob = g, xmin = 1, xmax = 10, ymin = 8, ymax = 10)
相关用法
- R ggplot2 annotation_logticks 注释:记录刻度线
- R ggplot2 annotation_map 注释:Map
- R ggplot2 annotation_raster 注释:高性能矩形平铺
- R ggplot2 annotate 创建注释层
- R ggplot2 aes_eval 控制审美评价
- R ggplot2 aes 构建美学映射
- R ggplot2 as_labeller 强制贴标机函数
- R ggplot2 vars 引用分面变量
- R ggplot2 position_stack 将重叠的对象堆叠在一起
- R ggplot2 geom_qq 分位数-分位数图
- R ggplot2 geom_spoke 由位置、方向和距离参数化的线段
- R ggplot2 geom_quantile 分位数回归
- R ggplot2 geom_text 文本
- R ggplot2 get_alt_text 从绘图中提取替代文本
- R ggplot2 geom_ribbon 函数区和面积图
- R ggplot2 stat_ellipse 计算法行数据椭圆
- R ggplot2 resolution 计算数值向量的“分辨率”
- R ggplot2 geom_boxplot 盒须图(Tukey 风格)
- R ggplot2 lims 设置规模限制
- R ggplot2 geom_hex 二维箱计数的六边形热图
- R ggplot2 scale_gradient 渐变色阶
- R ggplot2 scale_shape 形状比例,又称字形
- R ggplot2 geom_bar 条形图
- R ggplot2 draw_key 图例的关键字形
- R ggplot2 label_bquote 带有数学表达式的标签
注:本文由纯净天空筛选整理自Hadley Wickham等大神的英文原创作品 Annotation: Custom grob。非经特殊声明,原始代码版权归原作者所有,本译文未经允许或授权,请勿转载或复制。