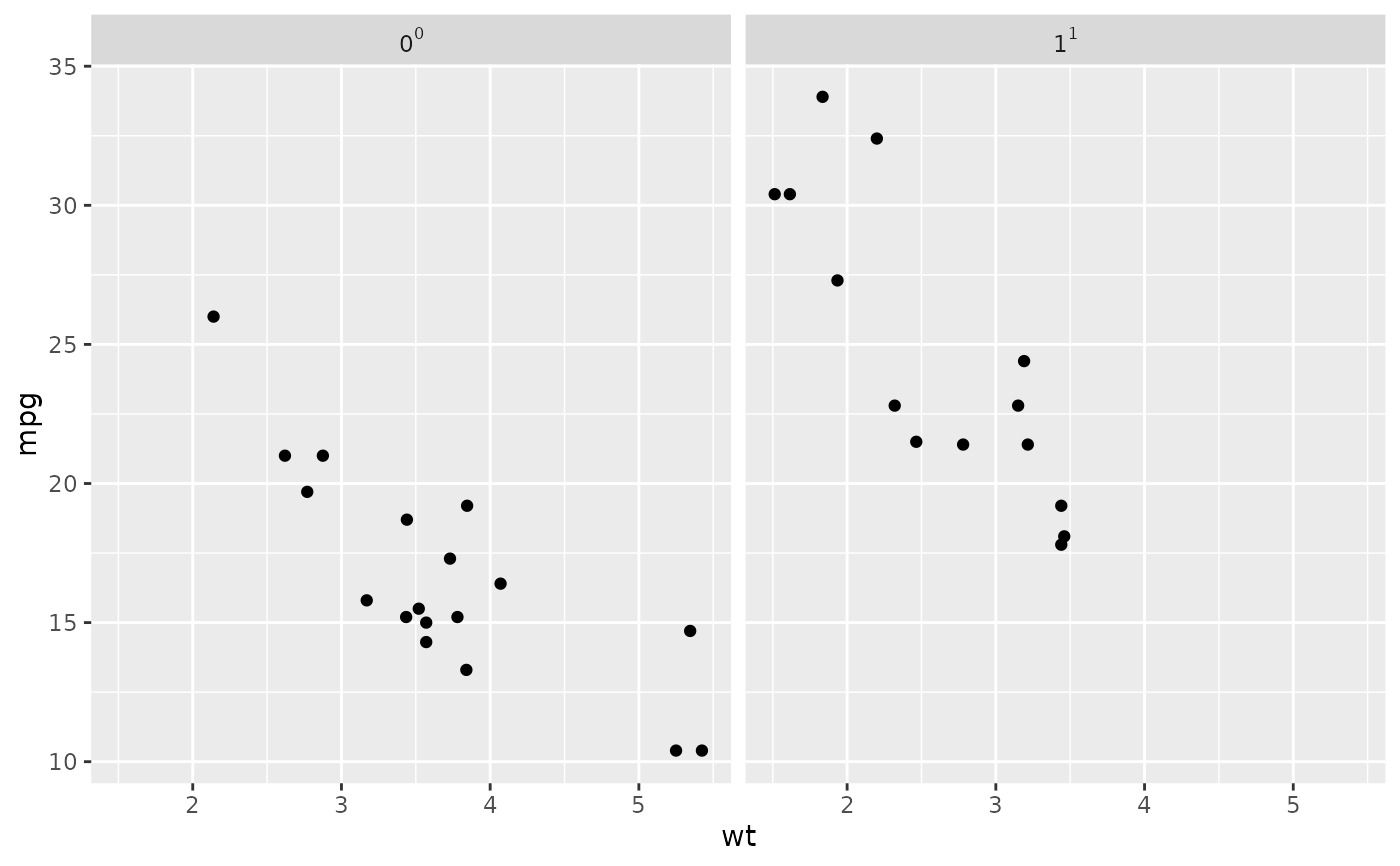
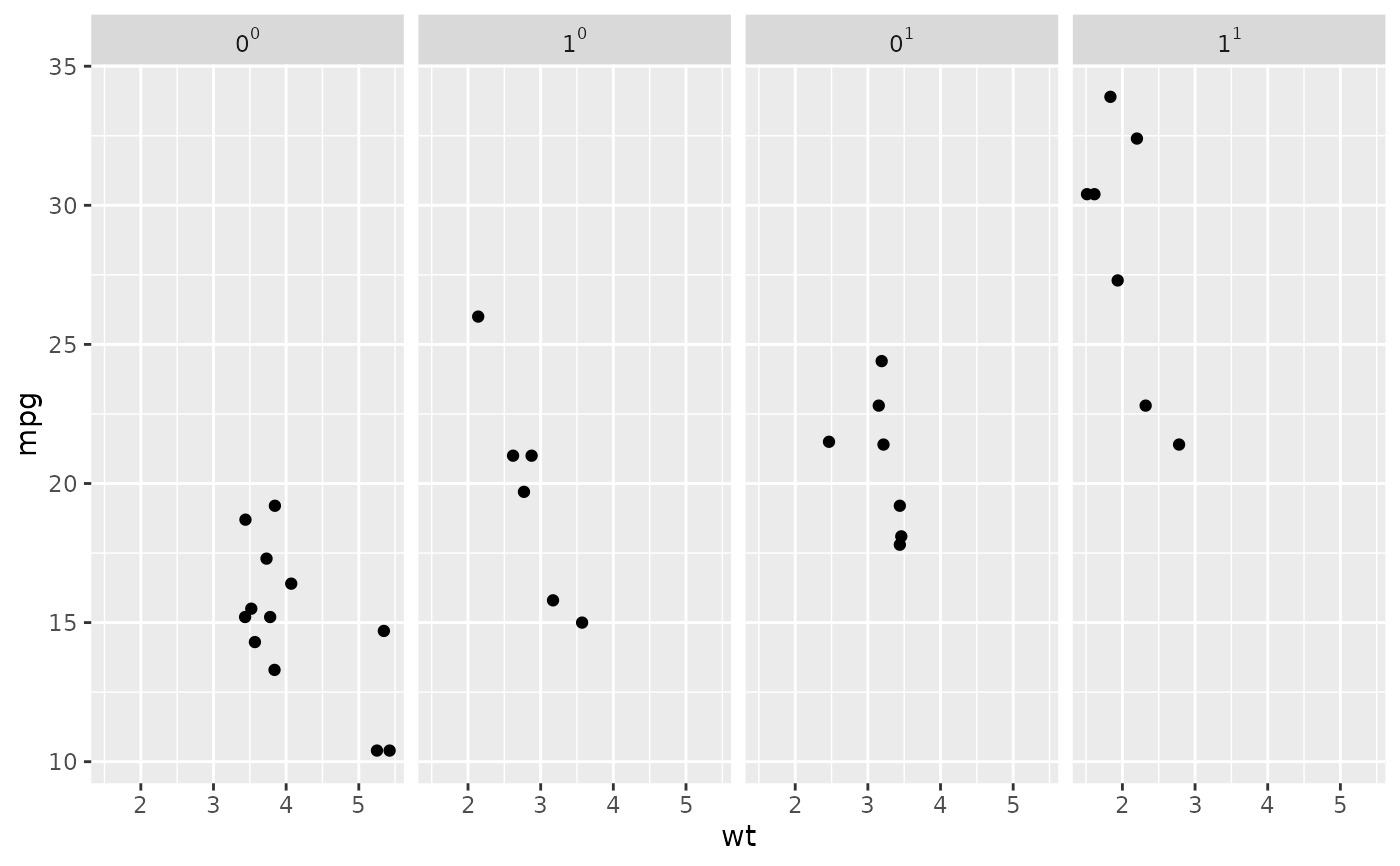
label_bquote() 提供了一种使用绘图数学表达式来标记分面行或列的灵活方法。反引号变量将替换为它们在构面中的值。
例子
# The variables mentioned in the plotmath expression must be
# backquoted and referred to by their names.
p <- ggplot(mtcars, aes(wt, mpg)) + geom_point()
p + facet_grid(vs ~ ., labeller = label_bquote(alpha ^ .(vs)))

p + facet_grid(. ~ vs, labeller = label_bquote(cols = .(vs) ^ .(vs)))

p + facet_grid(. ~ vs + am, labeller = label_bquote(cols = .(am) ^ .(vs)))

相关用法
- R ggplot2 labeller 构建标签规范
- R ggplot2 labellers 有用的贴标机函数
- R ggplot2 labs 修改轴、图例和绘图标签
- R ggplot2 layer 创建一个新层
- R ggplot2 lims 设置规模限制
- R ggplot2 annotation_logticks 注释:记录刻度线
- R ggplot2 vars 引用分面变量
- R ggplot2 position_stack 将重叠的对象堆叠在一起
- R ggplot2 geom_qq 分位数-分位数图
- R ggplot2 geom_spoke 由位置、方向和距离参数化的线段
- R ggplot2 geom_quantile 分位数回归
- R ggplot2 geom_text 文本
- R ggplot2 get_alt_text 从绘图中提取替代文本
- R ggplot2 annotation_custom 注释:自定义grob
- R ggplot2 geom_ribbon 函数区和面积图
- R ggplot2 stat_ellipse 计算法行数据椭圆
- R ggplot2 resolution 计算数值向量的“分辨率”
- R ggplot2 geom_boxplot 盒须图(Tukey 风格)
- R ggplot2 geom_hex 二维箱计数的六边形热图
- R ggplot2 scale_gradient 渐变色阶
- R ggplot2 scale_shape 形状比例,又称字形
- R ggplot2 geom_bar 条形图
- R ggplot2 draw_key 图例的关键字形
- R ggplot2 annotate 创建注释层
- R ggplot2 annotation_map 注释:Map
注:本文由纯净天空筛选整理自Hadley Wickham等大神的英文原创作品 Label with mathematical expressions。非经特殊声明,原始代码版权归原作者所有,本译文未经允许或授权,请勿转载或复制。
