就像 aes() 一样,vars() 是 quoting function,它在数据集的上下文中接受要评估的输入。这些输入可以是:
-
变量名
-
复杂的表达
在这两种情况下,结果(变量表示的向量或表达式的结果)都用于生成分面组。
参数
- ...
-
<
data-masking> 自动引用变量或表达式。这些在数据上下文中进行评估以形成分面组。可以命名(名称传递给 labeller )。
例子
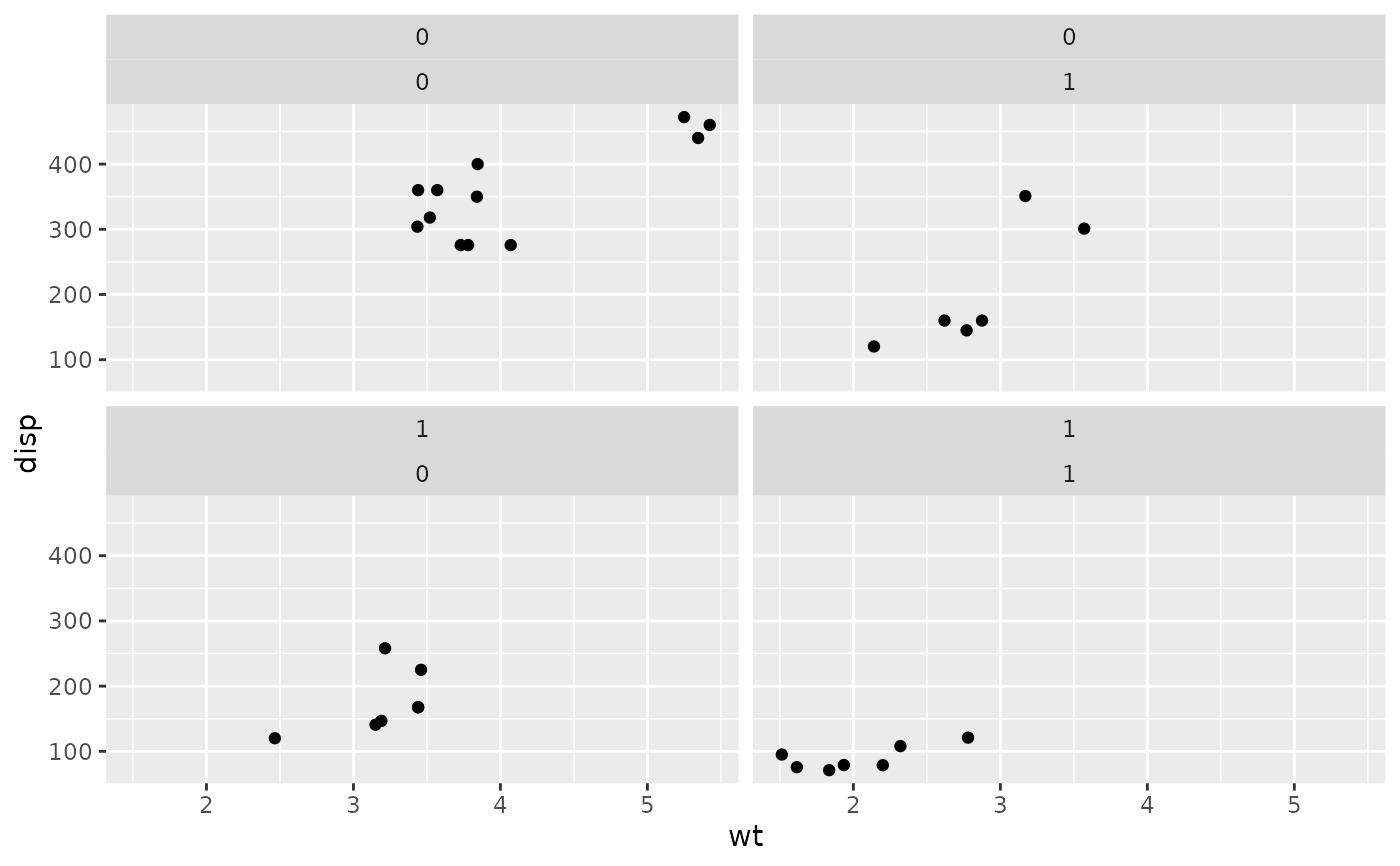
p <- ggplot(mtcars, aes(wt, disp)) + geom_point()
p + facet_wrap(vars(vs, am))
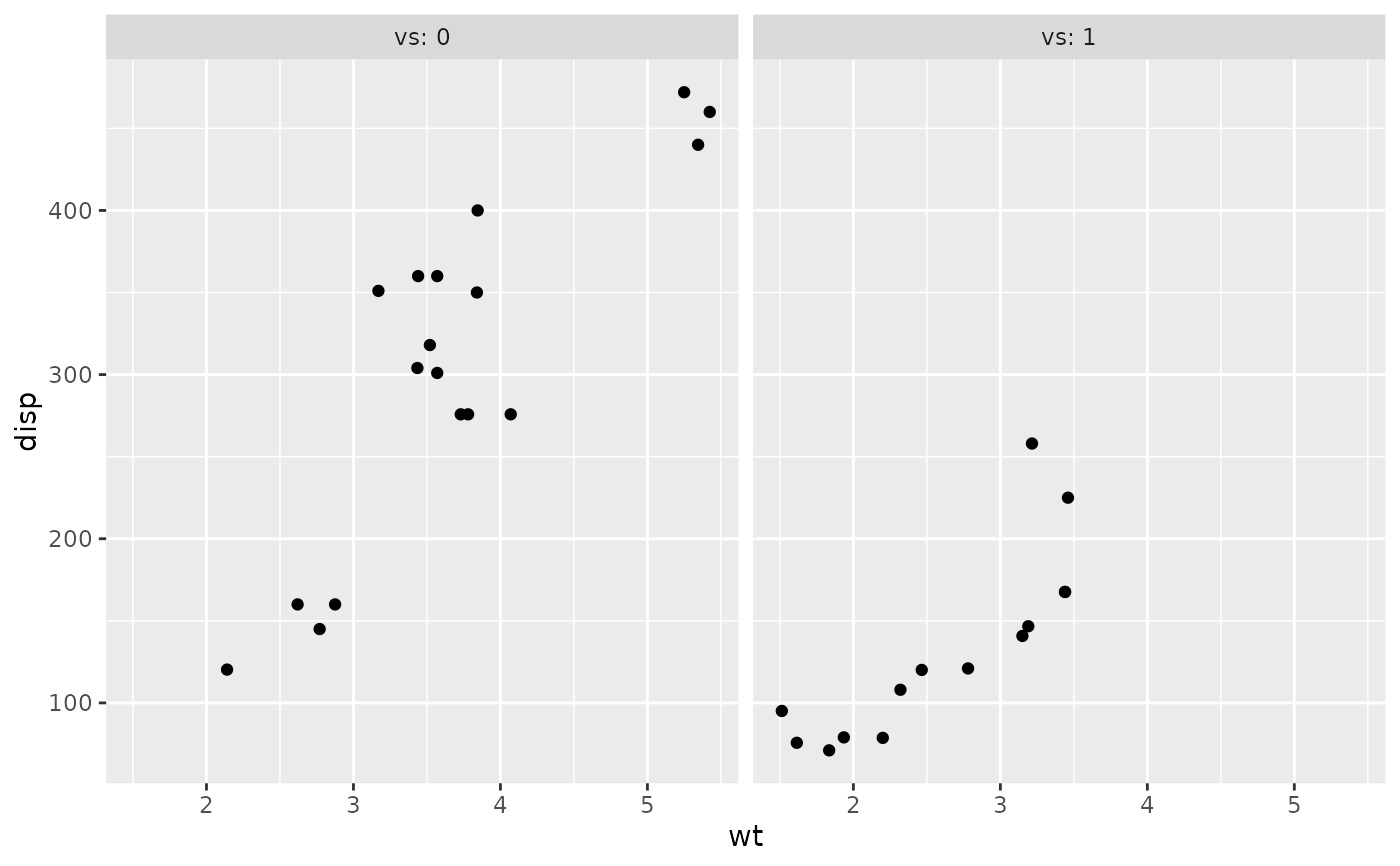
 # vars() makes it easy to pass variables from wrapper functions:
wrap_by <- function(...) {
facet_wrap(vars(...), labeller = label_both)
}
p + wrap_by(vs)
# vars() makes it easy to pass variables from wrapper functions:
wrap_by <- function(...) {
facet_wrap(vars(...), labeller = label_both)
}
p + wrap_by(vs)
 p + wrap_by(vs, am)
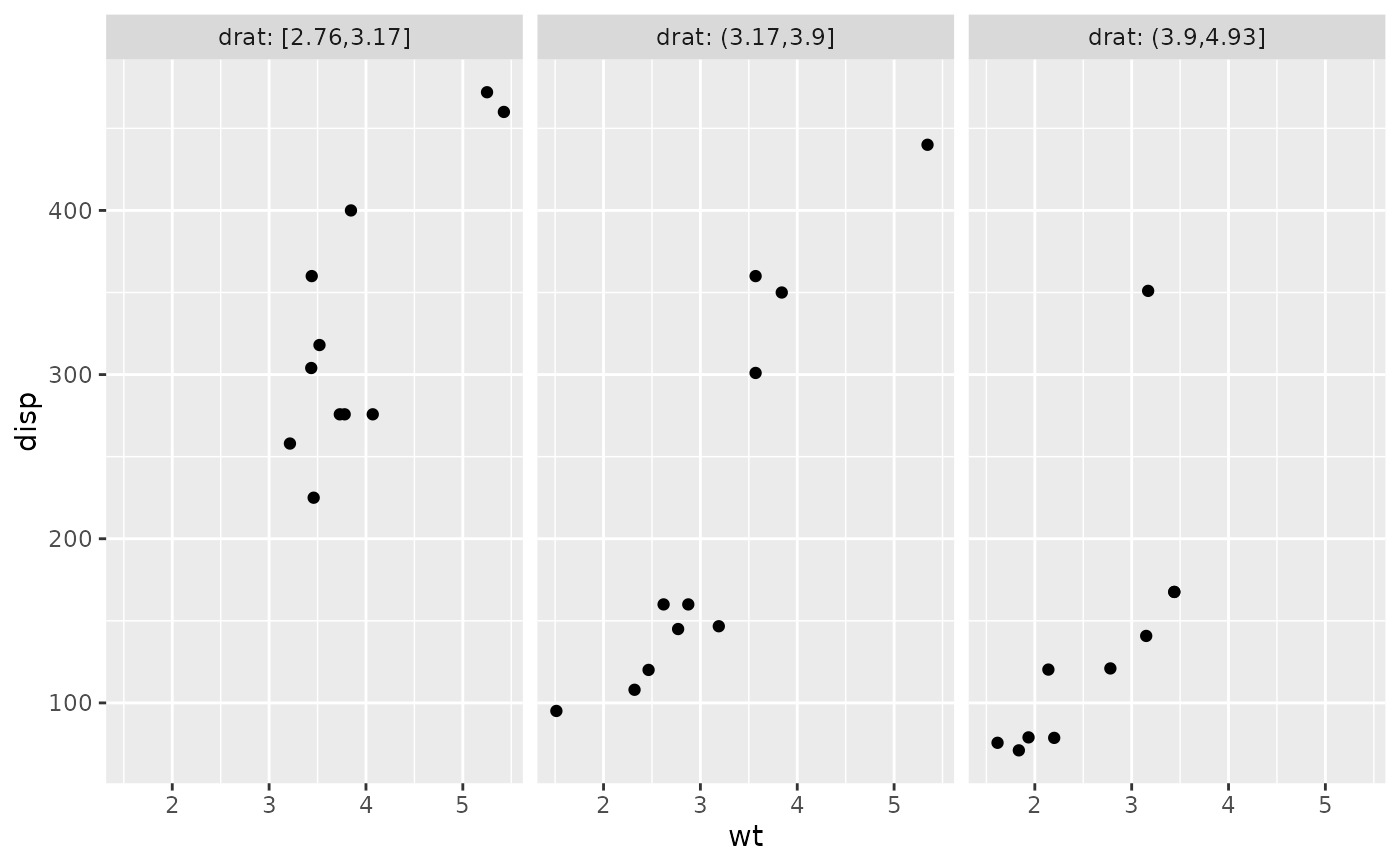
 # You can also supply expressions to vars(). In this case it's often a
# good idea to supply a name as well:
p + wrap_by(drat = cut_number(drat, 3))
# You can also supply expressions to vars(). In this case it's often a
# good idea to supply a name as well:
p + wrap_by(drat = cut_number(drat, 3))
 # Let's create another function for cutting and wrapping a
# variable. This time it will take a named argument instead of dots,
# so we'll have to use the "enquote and unquote" pattern:
wrap_cut <- function(var, n = 3) {
# Let's enquote the named argument `var` to make it auto-quoting:
var <- enquo(var)
# `as_label()` will create a nice default name:
nm <- as_label(var)
# Now let's unquote everything at the right place. Note that we also
# unquote `n` just in case the data frame has a column named
# `n`. The latter would have precedence over our local variable
# because the data is always masking the environment.
wrap_by(!!nm := cut_number(!!var, !!n))
}
# Thanks to tidy eval idioms we now have another useful wrapper:
p + wrap_cut(drat)
# Let's create another function for cutting and wrapping a
# variable. This time it will take a named argument instead of dots,
# so we'll have to use the "enquote and unquote" pattern:
wrap_cut <- function(var, n = 3) {
# Let's enquote the named argument `var` to make it auto-quoting:
var <- enquo(var)
# `as_label()` will create a nice default name:
nm <- as_label(var)
# Now let's unquote everything at the right place. Note that we also
# unquote `n` just in case the data frame has a column named
# `n`. The latter would have precedence over our local variable
# because the data is always masking the environment.
wrap_by(!!nm := cut_number(!!var, !!n))
}
# Thanks to tidy eval idioms we now have another useful wrapper:
p + wrap_cut(drat)
相关用法
- R ggplot2 annotation_logticks 注释:记录刻度线
- R ggplot2 position_stack 将重叠的对象堆叠在一起
- R ggplot2 geom_qq 分位数-分位数图
- R ggplot2 geom_spoke 由位置、方向和距离参数化的线段
- R ggplot2 geom_quantile 分位数回归
- R ggplot2 geom_text 文本
- R ggplot2 get_alt_text 从绘图中提取替代文本
- R ggplot2 annotation_custom 注释:自定义grob
- R ggplot2 geom_ribbon 函数区和面积图
- R ggplot2 stat_ellipse 计算法行数据椭圆
- R ggplot2 resolution 计算数值向量的“分辨率”
- R ggplot2 geom_boxplot 盒须图(Tukey 风格)
- R ggplot2 lims 设置规模限制
- R ggplot2 geom_hex 二维箱计数的六边形热图
- R ggplot2 scale_gradient 渐变色阶
- R ggplot2 scale_shape 形状比例,又称字形
- R ggplot2 geom_bar 条形图
- R ggplot2 draw_key 图例的关键字形
- R ggplot2 annotate 创建注释层
- R ggplot2 label_bquote 带有数学表达式的标签
- R ggplot2 annotation_map 注释:Map
- R ggplot2 scale_viridis 来自 viridisLite 的 Viridis 色标
- R ggplot2 coord_fixed 具有固定“纵横比”的笛卡尔坐标
- R ggplot2 map_data 创建Map数据的 DataFrame
- R ggplot2 scale_grey 连续灰度色阶
注:本文由纯净天空筛选整理自Hadley Wickham等大神的英文原创作品 Quote faceting variables。非经特殊声明,原始代码版权归原作者所有,本译文未经允许或授权,请勿转载或复制。