facet_grid() 形成由行和列分面变量定义的面板矩阵。当您有两个离散变量并且数据中存在变量的所有组合时,它最有用。如果您只有一个具有多个级别的变量,请尝试 facet_wrap() 。
用法
facet_grid(
  rows = NULL,
  cols = NULL,
  scales = "fixed",
  space = "fixed",
  shrink = TRUE,
  labeller = "label_value",
  as.table = TRUE,
  switch = NULL,
  drop = TRUE,
  margins = FALSE,
  facets = deprecated()
)
参数
- rows, cols
-
由
vars()引用并在行或列维度上定义分面组的一组变量或表达式。可以命名变量(名称传递给labeller)。为了与经典接口兼容,
rows也可以是左轴(表格显示的)行和右轴(表格显示的)列的公式;公式中的点用于指示此维度(行或列)上不应有分面。 - scales
-
比例是否在所有方面共享(默认值
"fixed"),还是在行 ("free_x")、列 ("free_y") 或行和列 ("free") 之间变化? - space
-
如果是
"fixed",默认情况下,所有面板都具有相同的大小。如果"free_y",它们的高度将与 y 刻度的长度成正比;如果"free_x",它们的宽度将与x刻度的长度成正比;或者如果"free"高度和宽度都会变化。除非适当的比例也发生变化,否则此设置不会产生任何影响。 - shrink
-
如果
TRUE,将缩小比例以适应统计数据的输出,而不是原始数据。如果是FALSE,则为统计汇总前的原始数据范围。 - labeller
-
一种函数,它采用一个标签数据帧并返回字符向量列表或数据帧。每个输入列对应一个因子。因此,将有多个
vars(cyl, am)。每个输出列在条带标签中显示为单独的一行。此函数应继承自 "labeller" S3 类,以便与labeller()兼容。您可以对不同类型的标签使用不同的标签函数,例如使用label_parsed()格式化构面标签。默认情况下使用label_value(),检查它以获取更多详细信息和指向其他选项的指针。 - as.table
-
如果是
TRUE(默认值),则各个方面的布局就像表格一样,最高值位于右下角。如果是FALSE,则各个方面的布局就像绘图一样,最高值位于右上角。 - switch
-
默认情况下,标签显示在图的顶部和右侧。如果
"x",顶部标签将显示在底部。如果是"y",右侧标签将显示在左侧。也可以设置为"both"。 - drop
-
如果默认为
TRUE,则数据中未使用的所有因子水平将自动删除。如果是FALSE,则将显示所有因子水平,无论它们是否出现在数据中。 - margins
-
逻辑值或字符向量。边距是附加的构面,其中包含构面变量的每个可能值的所有数据。如果
FALSE,则不包含其他方面(默认)。如果TRUE,则所有分面变量都包含边距。如果指定为字符向量,则它是要为其创建边距的变量的名称。 - facets
-
![[Deprecated]](https://vimsky.com/wp-content/uploads/2023/09/46380a3291bc52d4cbe8621c7e624b2c.svg) 请用
请用rows和cols反而。
例子
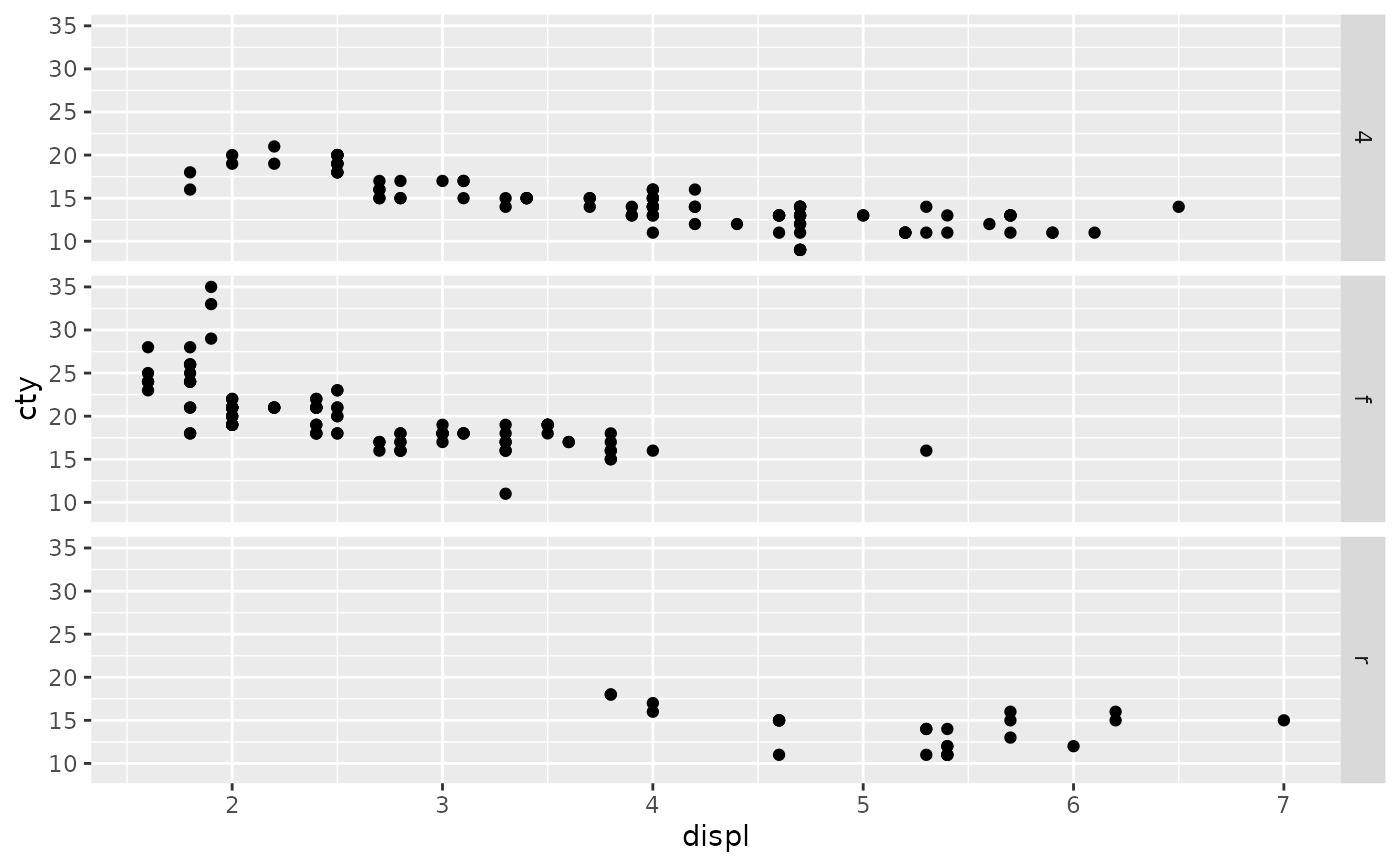
p <- ggplot(mpg, aes(displ, cty)) + geom_point()
# Use vars() to supply variables from the dataset:
p + facet_grid(rows = vars(drv))
 p + facet_grid(cols = vars(cyl))
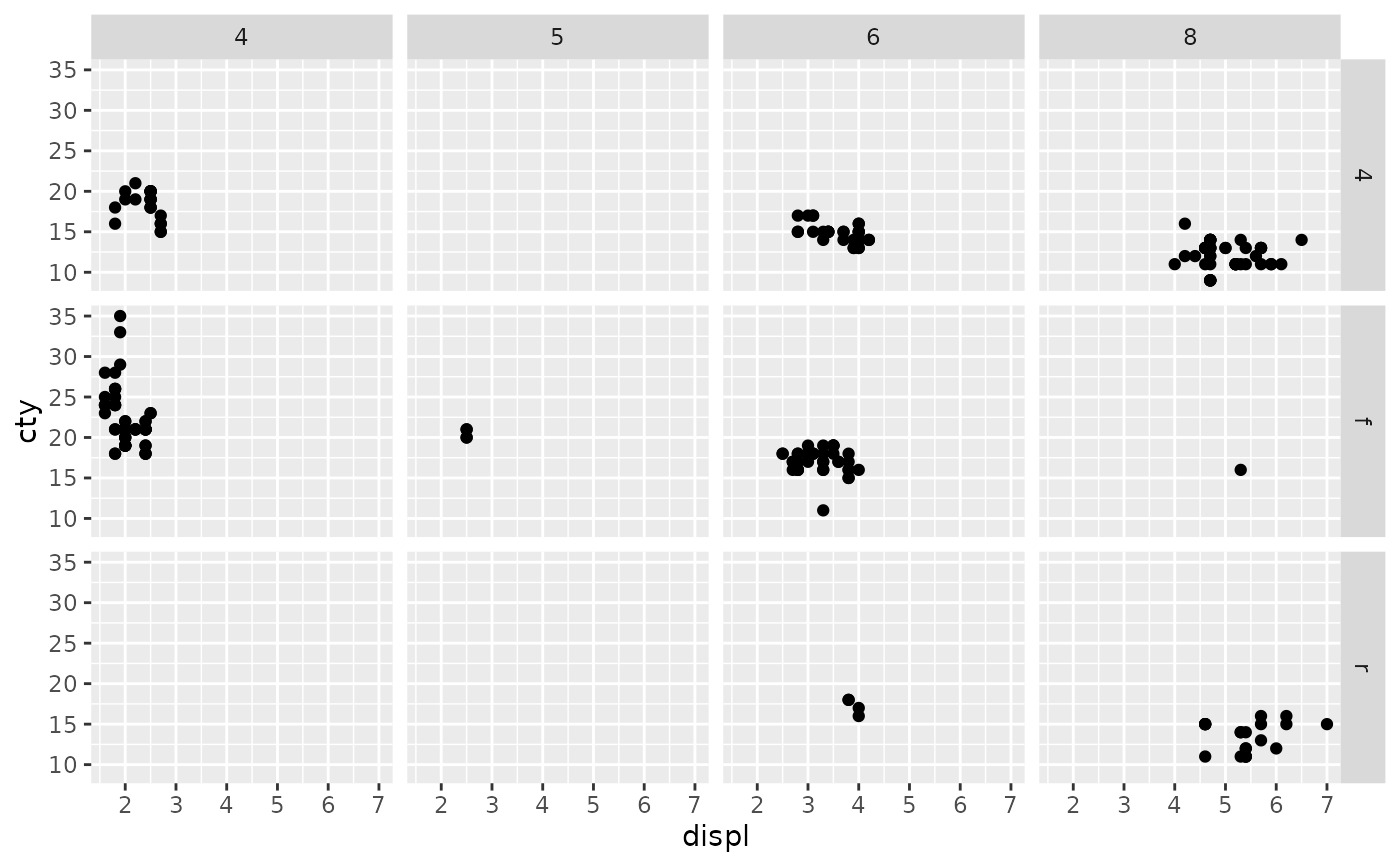
 p + facet_grid(vars(drv), vars(cyl))
 # To change plot order of facet grid,
# change the order of variable levels with factor()
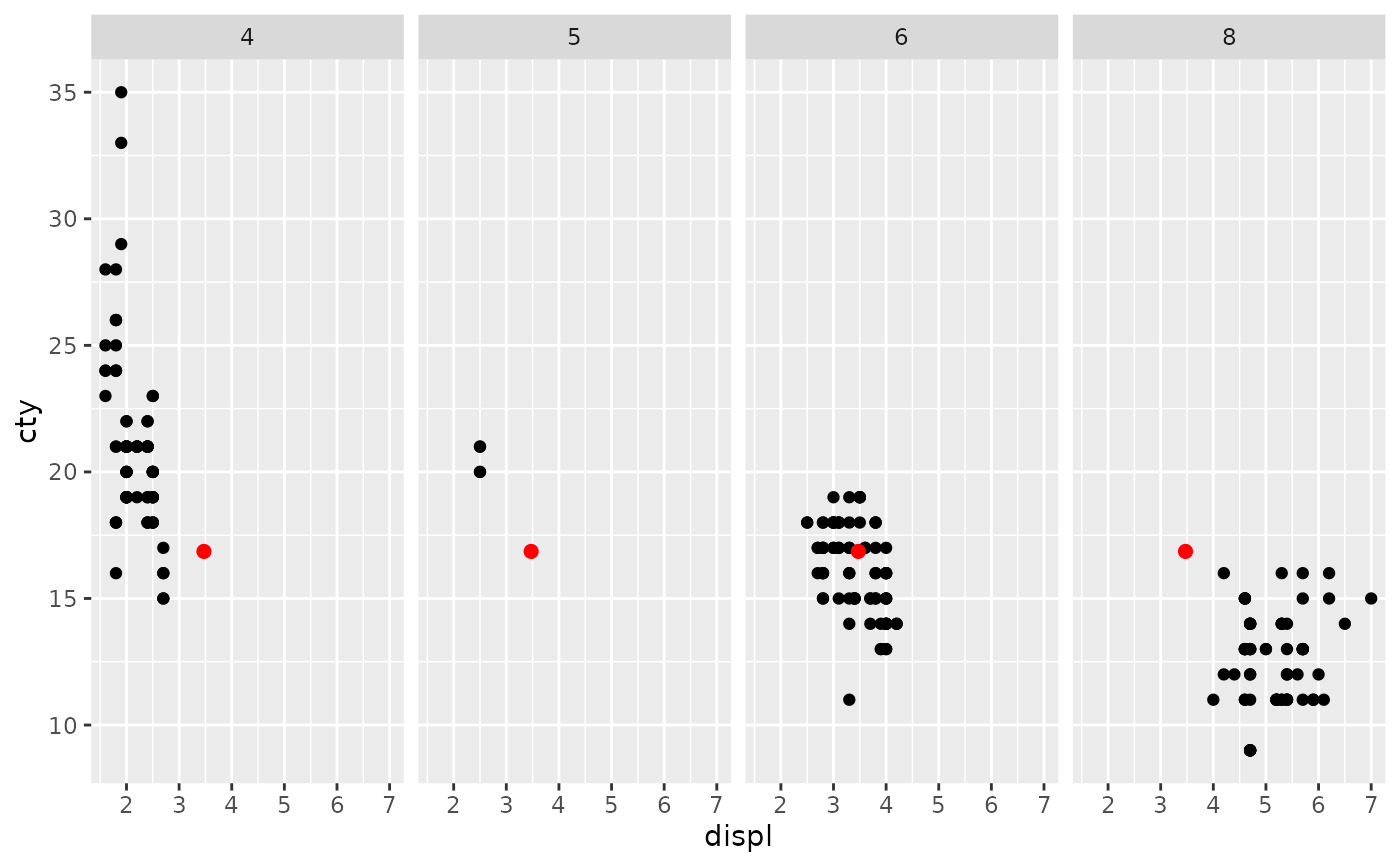
# If you combine a facetted dataset with a dataset that lacks those
# faceting variables, the data will be repeated across the missing
# combinations:
df <- data.frame(displ = mean(mpg$displ), cty = mean(mpg$cty))
p +
facet_grid(cols = vars(cyl)) +
geom_point(data = df, colour = "red", size = 2)
# To change plot order of facet grid,
# change the order of variable levels with factor()
# If you combine a facetted dataset with a dataset that lacks those
# faceting variables, the data will be repeated across the missing
# combinations:
df <- data.frame(displ = mean(mpg$displ), cty = mean(mpg$cty))
p +
facet_grid(cols = vars(cyl)) +
geom_point(data = df, colour = "red", size = 2)
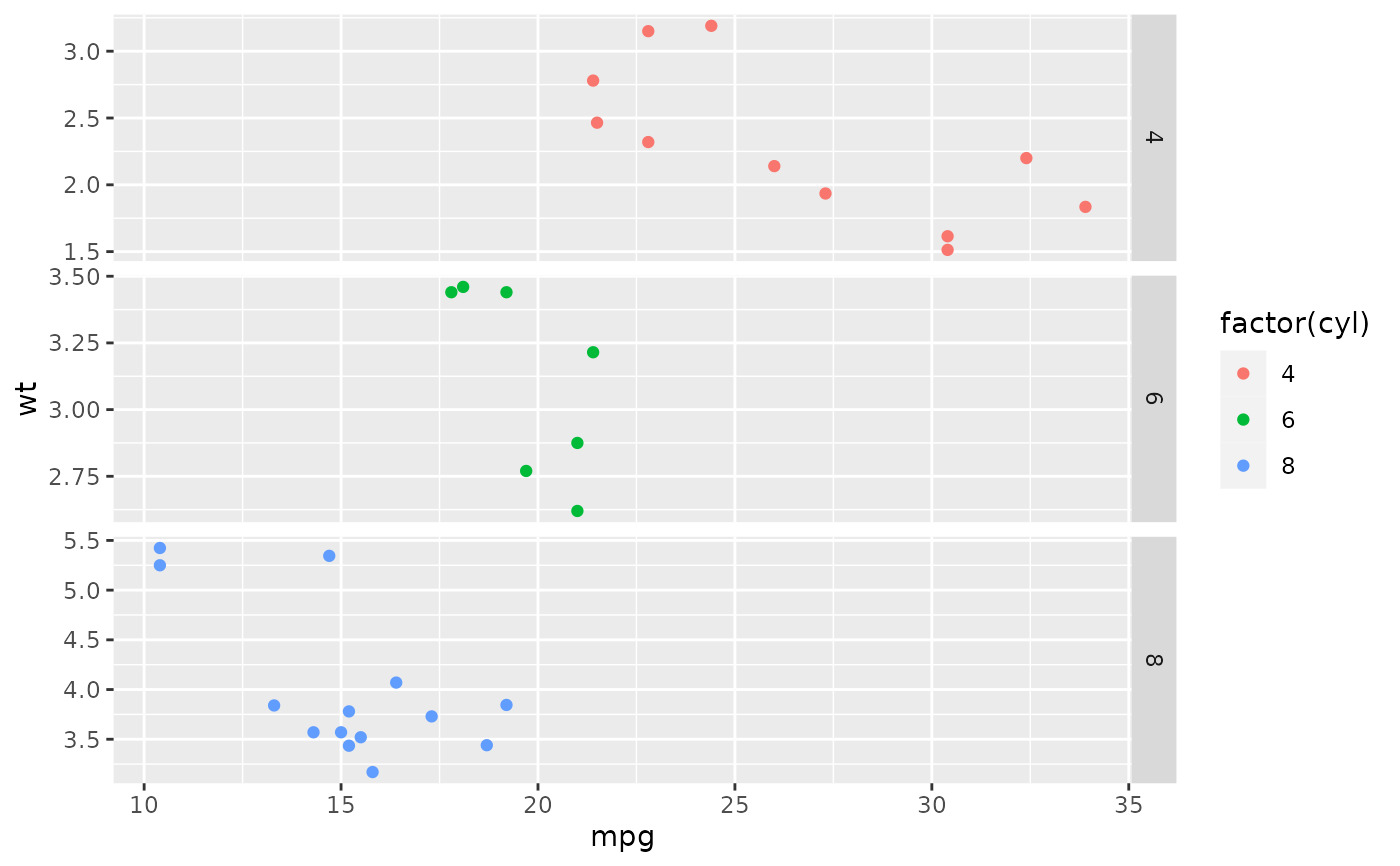
 # Free scales -------------------------------------------------------
# You can also choose whether the scales should be constant
# across all panels (the default), or whether they should be allowed
# to vary
mt <- ggplot(mtcars, aes(mpg, wt, colour = factor(cyl))) +
geom_point()
mt + facet_grid(vars(cyl), scales = "free")
# Free scales -------------------------------------------------------
# You can also choose whether the scales should be constant
# across all panels (the default), or whether they should be allowed
# to vary
mt <- ggplot(mtcars, aes(mpg, wt, colour = factor(cyl))) +
geom_point()
mt + facet_grid(vars(cyl), scales = "free")
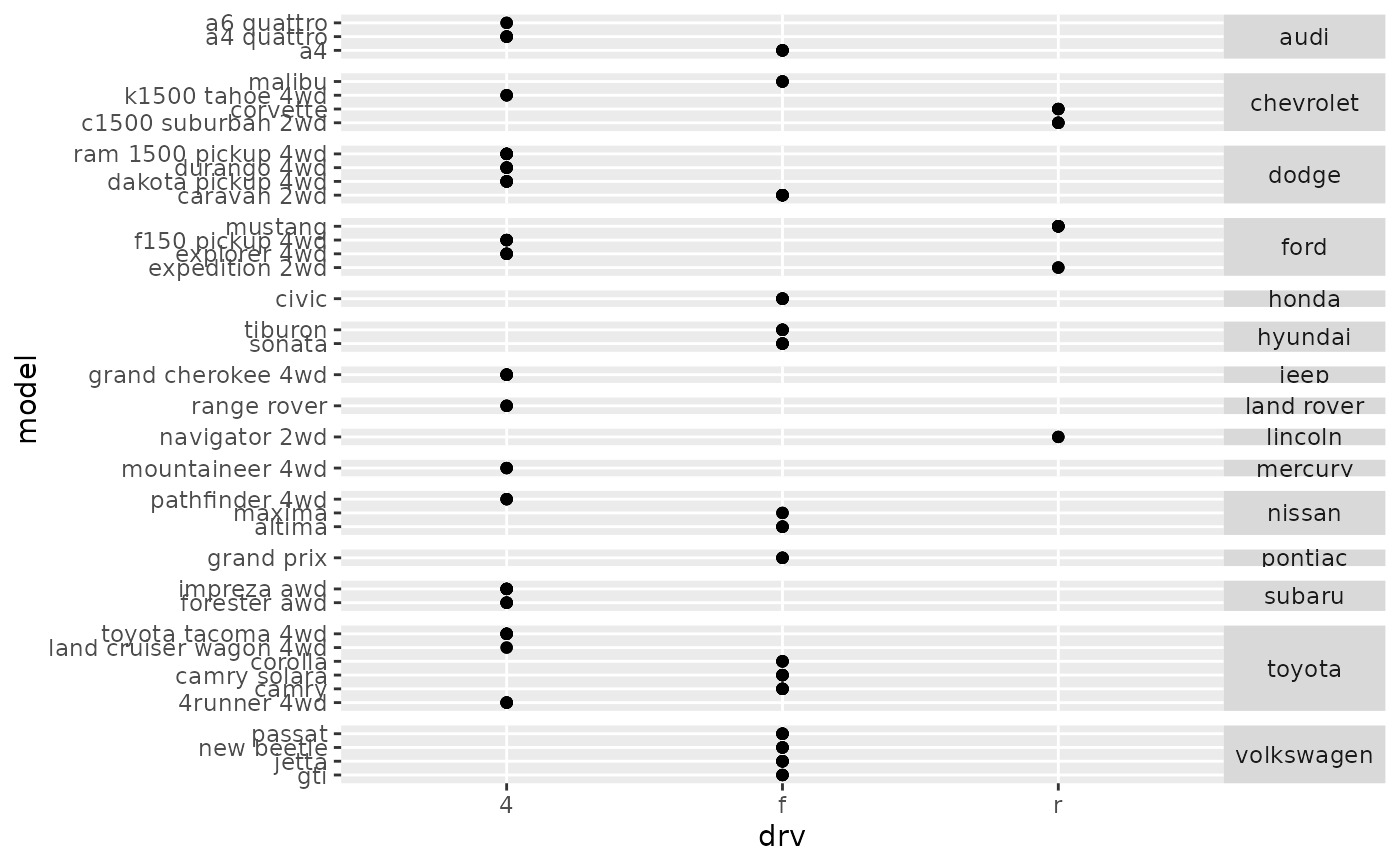
 # If scales and space are free, then the mapping between position
# and values in the data will be the same across all panels. This
# is particularly useful for categorical axes
ggplot(mpg, aes(drv, model)) +
geom_point() +
facet_grid(manufacturer ~ ., scales = "free", space = "free") +
theme(strip.text.y = element_text(angle = 0))
# If scales and space are free, then the mapping between position
# and values in the data will be the same across all panels. This
# is particularly useful for categorical axes
ggplot(mpg, aes(drv, model)) +
geom_point() +
facet_grid(manufacturer ~ ., scales = "free", space = "free") +
theme(strip.text.y = element_text(angle = 0))
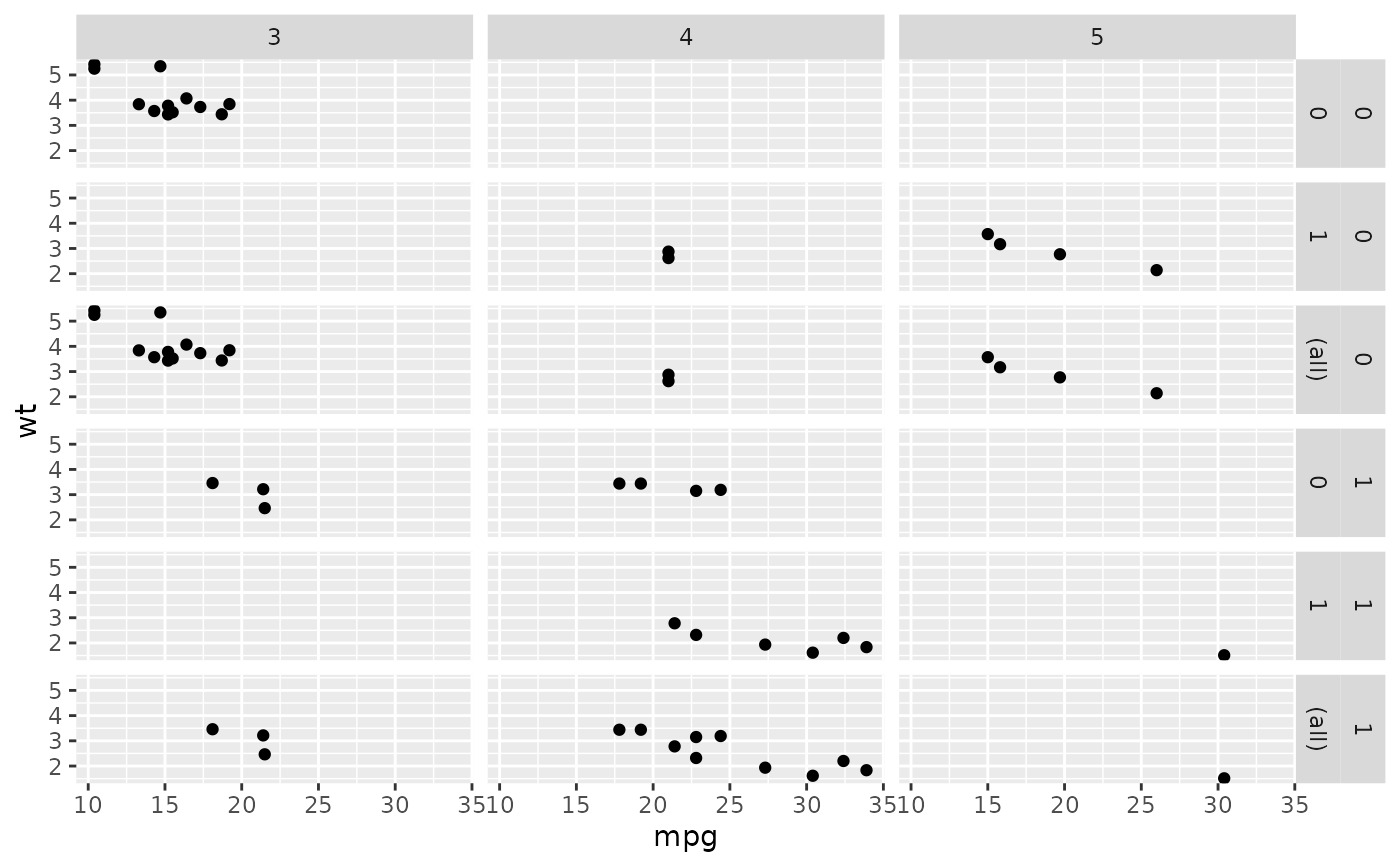
 # Margins ----------------------------------------------------------
# \donttest{
# Margins can be specified logically (all yes or all no) or for specific
# variables as (character) variable names
mg <- ggplot(mtcars, aes(x = mpg, y = wt)) + geom_point()
mg + facet_grid(vs + am ~ gear, margins = TRUE)
# Margins ----------------------------------------------------------
# \donttest{
# Margins can be specified logically (all yes or all no) or for specific
# variables as (character) variable names
mg <- ggplot(mtcars, aes(x = mpg, y = wt)) + geom_point()
mg + facet_grid(vs + am ~ gear, margins = TRUE)
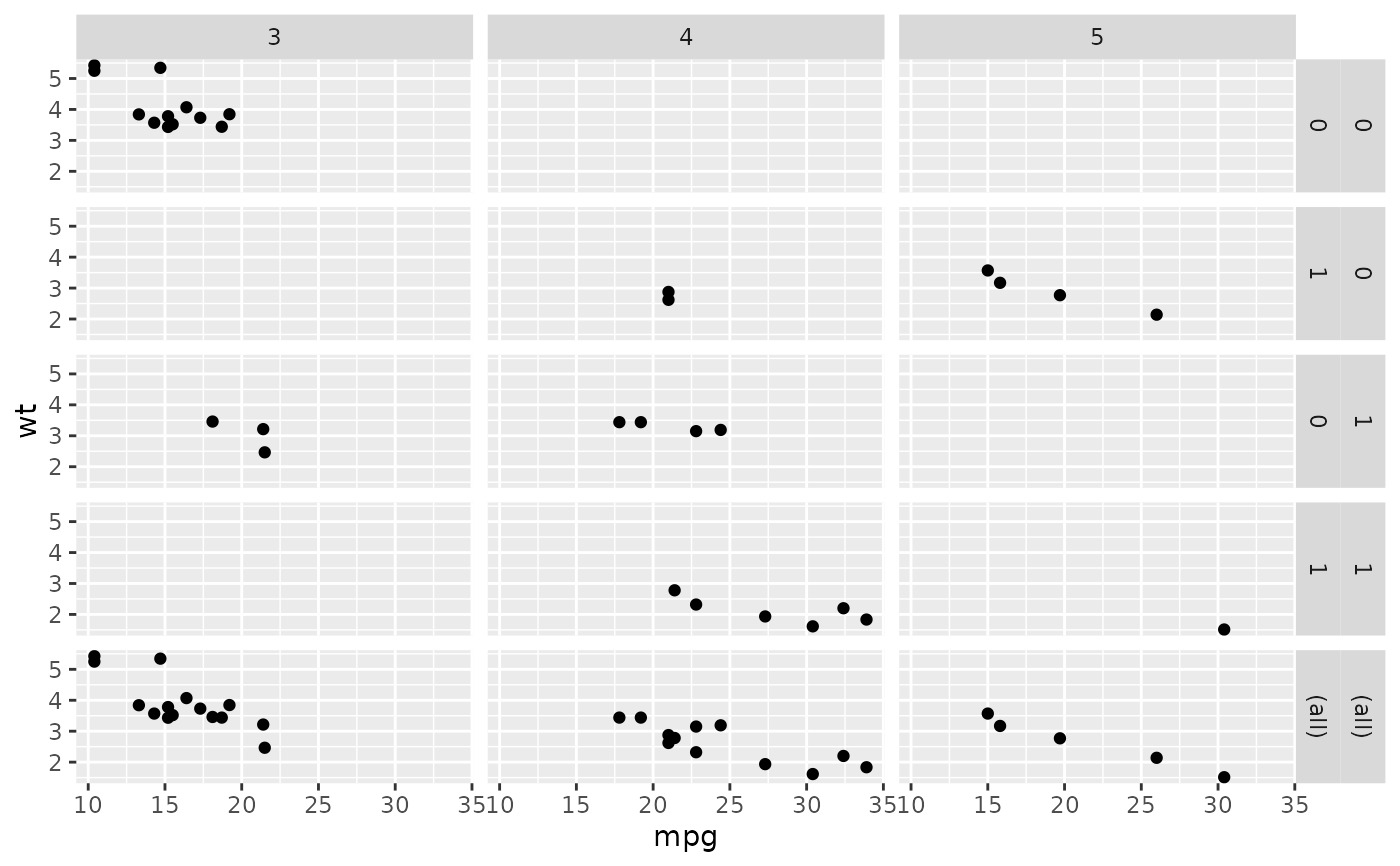
 mg + facet_grid(vs + am ~ gear, margins = "am")
 # when margins are made over "vs", since the facets for "am" vary
# within the values of "vs", the marginal facet for "vs" is also
# a margin over "am".
mg + facet_grid(vs + am ~ gear, margins = "vs")
# when margins are made over "vs", since the facets for "am" vary
# within the values of "vs", the marginal facet for "vs" is also
# a margin over "am".
mg + facet_grid(vs + am ~ gear, margins = "vs")
 # }
# }
相关用法
- R ggplot2 facet_wrap 将 1d 面板带包成 2d 面板
- R ggplot2 fortify.lm 使用模型拟合统计数据补充拟合到线性模型的数据。
- R ggplot2 annotation_logticks 注释:记录刻度线
- R ggplot2 vars 引用分面变量
- R ggplot2 position_stack 将重叠的对象堆叠在一起
- R ggplot2 geom_qq 分位数-分位数图
- R ggplot2 geom_spoke 由位置、方向和距离参数化的线段
- R ggplot2 geom_quantile 分位数回归
- R ggplot2 geom_text 文本
- R ggplot2 get_alt_text 从绘图中提取替代文本
- R ggplot2 annotation_custom 注释:自定义grob
- R ggplot2 geom_ribbon 函数区和面积图
- R ggplot2 stat_ellipse 计算法行数据椭圆
- R ggplot2 resolution 计算数值向量的“分辨率”
- R ggplot2 geom_boxplot 盒须图(Tukey 风格)
- R ggplot2 lims 设置规模限制
- R ggplot2 geom_hex 二维箱计数的六边形热图
- R ggplot2 scale_gradient 渐变色阶
- R ggplot2 scale_shape 形状比例,又称字形
- R ggplot2 geom_bar 条形图
- R ggplot2 draw_key 图例的关键字形
- R ggplot2 annotate 创建注释层
- R ggplot2 label_bquote 带有数学表达式的标签
- R ggplot2 annotation_map 注释:Map
- R ggplot2 scale_viridis 来自 viridisLite 的 Viridis 色标
注:本文由纯净天空筛选整理自Hadley Wickham等大神的英文原创作品 Lay out panels in a grid。非经特殊声明,原始代码版权归原作者所有,本译文未经允许或授权,请勿转载或复制。