就像 aes() 一樣,vars() 是 quoting function,它在數據集的上下文中接受要評估的輸入。這些輸入可以是:
-
變量名
-
複雜的表達
在這兩種情況下,結果(變量表示的向量或表達式的結果)都用於生成分麵組。
參數
- ...
-
<
data-masking> 自動引用變量或表達式。這些在數據上下文中進行評估以形成分麵組。可以命名(名稱傳遞給 labeller )。
例子
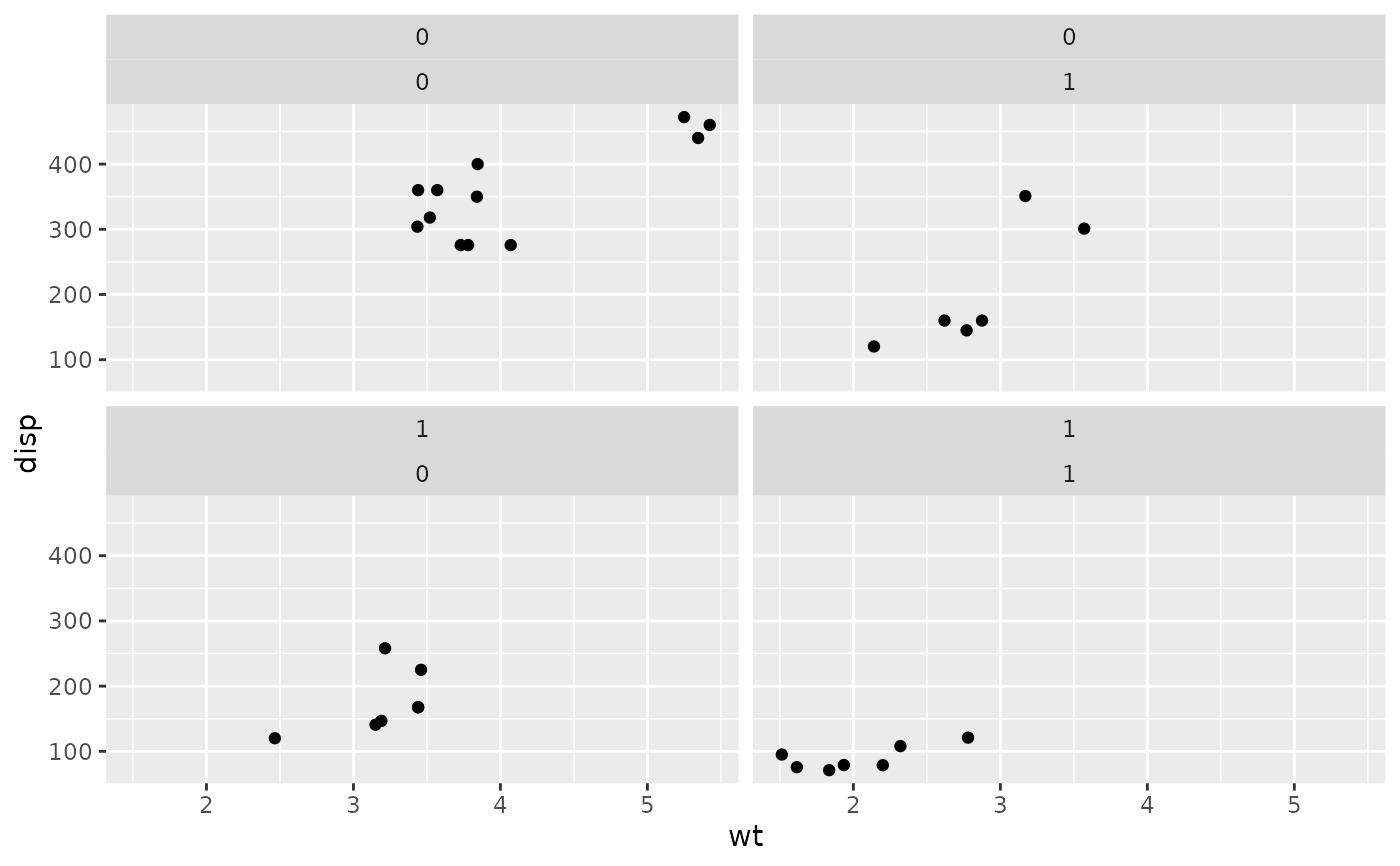
p <- ggplot(mtcars, aes(wt, disp)) + geom_point()
p + facet_wrap(vars(vs, am))
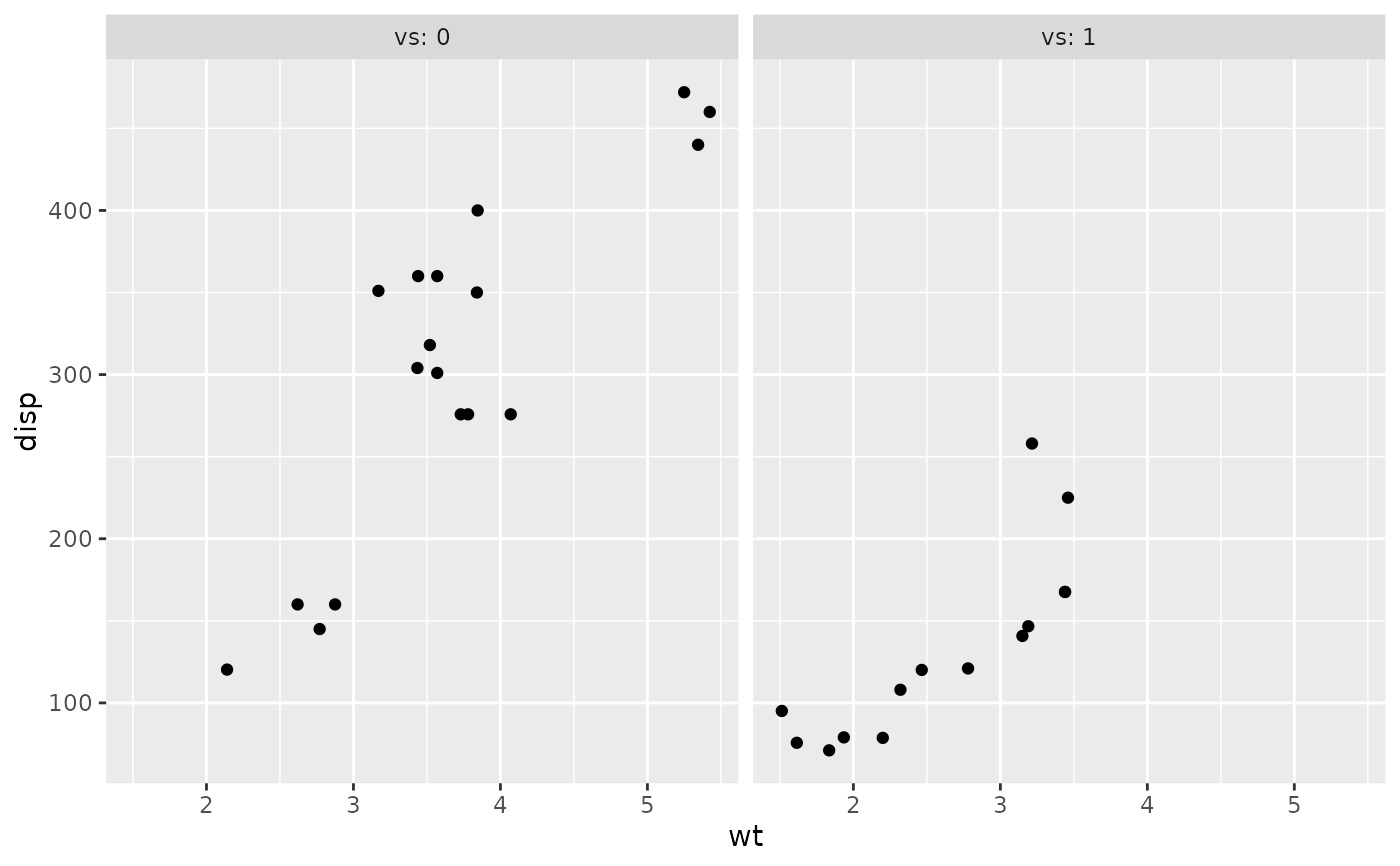
 # vars() makes it easy to pass variables from wrapper functions:
wrap_by <- function(...) {
facet_wrap(vars(...), labeller = label_both)
}
p + wrap_by(vs)
# vars() makes it easy to pass variables from wrapper functions:
wrap_by <- function(...) {
facet_wrap(vars(...), labeller = label_both)
}
p + wrap_by(vs)
 p + wrap_by(vs, am)
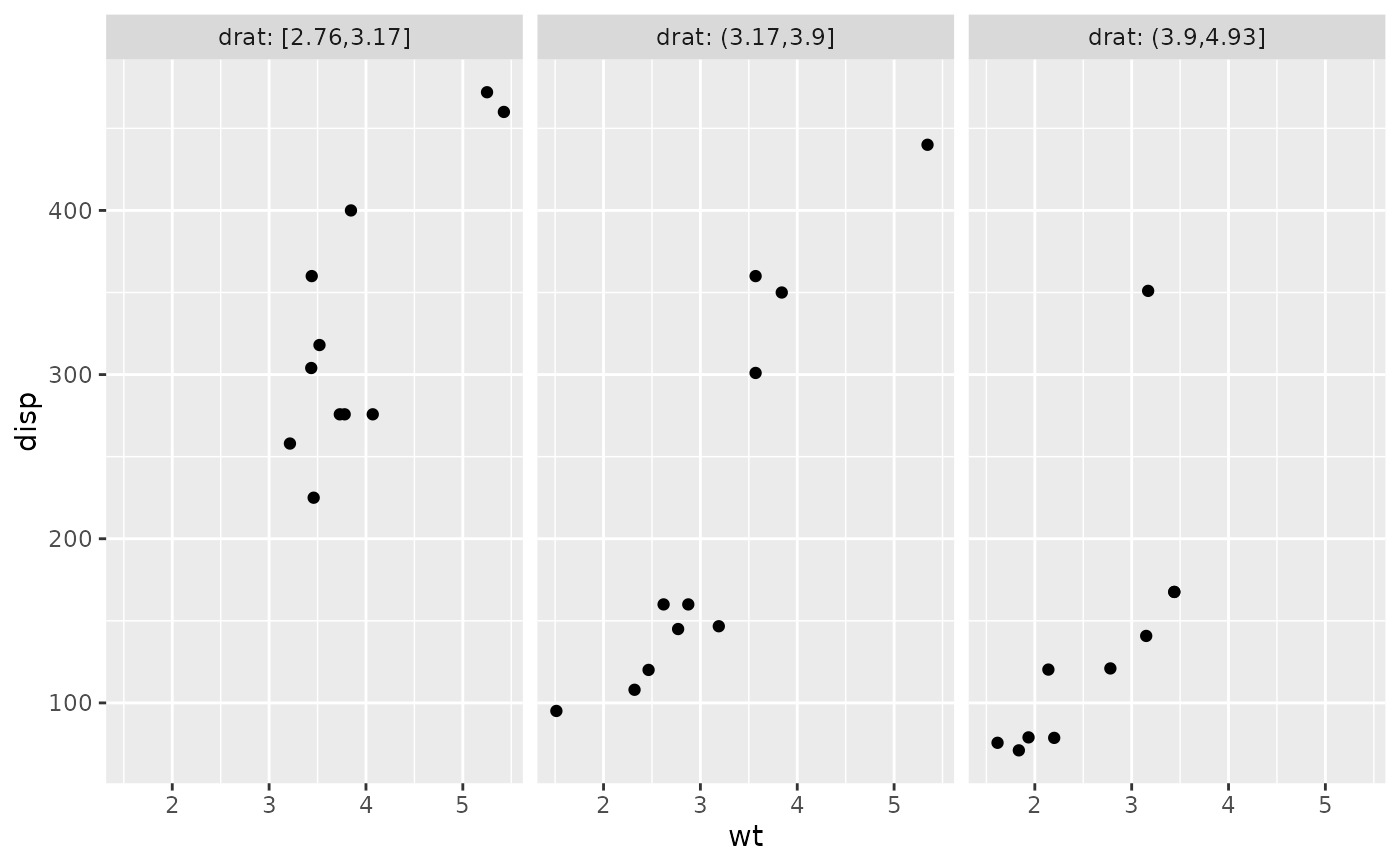
 # You can also supply expressions to vars(). In this case it's often a
# good idea to supply a name as well:
p + wrap_by(drat = cut_number(drat, 3))
# You can also supply expressions to vars(). In this case it's often a
# good idea to supply a name as well:
p + wrap_by(drat = cut_number(drat, 3))
 # Let's create another function for cutting and wrapping a
# variable. This time it will take a named argument instead of dots,
# so we'll have to use the "enquote and unquote" pattern:
wrap_cut <- function(var, n = 3) {
# Let's enquote the named argument `var` to make it auto-quoting:
var <- enquo(var)
# `as_label()` will create a nice default name:
nm <- as_label(var)
# Now let's unquote everything at the right place. Note that we also
# unquote `n` just in case the data frame has a column named
# `n`. The latter would have precedence over our local variable
# because the data is always masking the environment.
wrap_by(!!nm := cut_number(!!var, !!n))
}
# Thanks to tidy eval idioms we now have another useful wrapper:
p + wrap_cut(drat)
# Let's create another function for cutting and wrapping a
# variable. This time it will take a named argument instead of dots,
# so we'll have to use the "enquote and unquote" pattern:
wrap_cut <- function(var, n = 3) {
# Let's enquote the named argument `var` to make it auto-quoting:
var <- enquo(var)
# `as_label()` will create a nice default name:
nm <- as_label(var)
# Now let's unquote everything at the right place. Note that we also
# unquote `n` just in case the data frame has a column named
# `n`. The latter would have precedence over our local variable
# because the data is always masking the environment.
wrap_by(!!nm := cut_number(!!var, !!n))
}
# Thanks to tidy eval idioms we now have another useful wrapper:
p + wrap_cut(drat)
相關用法
- R ggplot2 annotation_logticks 注釋:記錄刻度線
- R ggplot2 position_stack 將重疊的對象堆疊在一起
- R ggplot2 geom_qq 分位數-分位數圖
- R ggplot2 geom_spoke 由位置、方向和距離參數化的線段
- R ggplot2 geom_quantile 分位數回歸
- R ggplot2 geom_text 文本
- R ggplot2 get_alt_text 從繪圖中提取替代文本
- R ggplot2 annotation_custom 注釋:自定義grob
- R ggplot2 geom_ribbon 函數區和麵積圖
- R ggplot2 stat_ellipse 計算法行數據橢圓
- R ggplot2 resolution 計算數值向量的“分辨率”
- R ggplot2 geom_boxplot 盒須圖(Tukey 風格)
- R ggplot2 lims 設置規模限製
- R ggplot2 geom_hex 二維箱計數的六邊形熱圖
- R ggplot2 scale_gradient 漸變色階
- R ggplot2 scale_shape 形狀比例,又稱字形
- R ggplot2 geom_bar 條形圖
- R ggplot2 draw_key 圖例的關鍵字形
- R ggplot2 annotate 創建注釋層
- R ggplot2 label_bquote 帶有數學表達式的標簽
- R ggplot2 annotation_map 注釋:Map
- R ggplot2 scale_viridis 來自 viridisLite 的 Viridis 色標
- R ggplot2 coord_fixed 具有固定“縱橫比”的笛卡爾坐標
- R ggplot2 map_data 創建Map數據的 DataFrame
- R ggplot2 scale_grey 連續灰度色階
注:本文由純淨天空篩選整理自Hadley Wickham等大神的英文原創作品 Quote faceting variables。非經特殊聲明,原始代碼版權歸原作者所有,本譯文未經允許或授權,請勿轉載或複製。