此函數將幾何圖形添加到繪圖中,但與典型的幾何函數不同,幾何圖形的屬性不是從數據幀的變量映射,而是作為向量傳入。這對於添加小注釋(例如文本標簽)或如果您的數據位於向量中並且由於某種原因不想將它們放入 DataFrame 中非常有用。
用法
annotate(
  geom,
  x = NULL,
  y = NULL,
  xmin = NULL,
  xmax = NULL,
  ymin = NULL,
  ymax = NULL,
  xend = NULL,
  yend = NULL,
  ...,
  na.rm = FALSE
)
參數
- geom
-
用於注釋的幾何名稱
- x, y, xmin, ymin, xmax, ymax, xend, yend
-
定位美學 - 您必須至少指定其中一項。
- ...
-
其他參數傳遞給
layer()。這些通常是美學,用於將美學設置為固定值,例如colour = "red"或size = 3。它們也可能是配對的 geom/stat 的參數。 - na.rm
-
如果
FALSE,則默認缺失值將被刪除並帶有警告。如果TRUE,缺失值將被靜默刪除。
不支持的幾何圖形
由於其特殊性質,參考線幾何圖形 geom_abline() 、 geom_hline() 和 geom_vline() 不能與 annotate() 一起使用。您可以使用這些 geoms 目錄進行注釋。
例子
p <- ggplot(mtcars, aes(x = wt, y = mpg)) + geom_point()
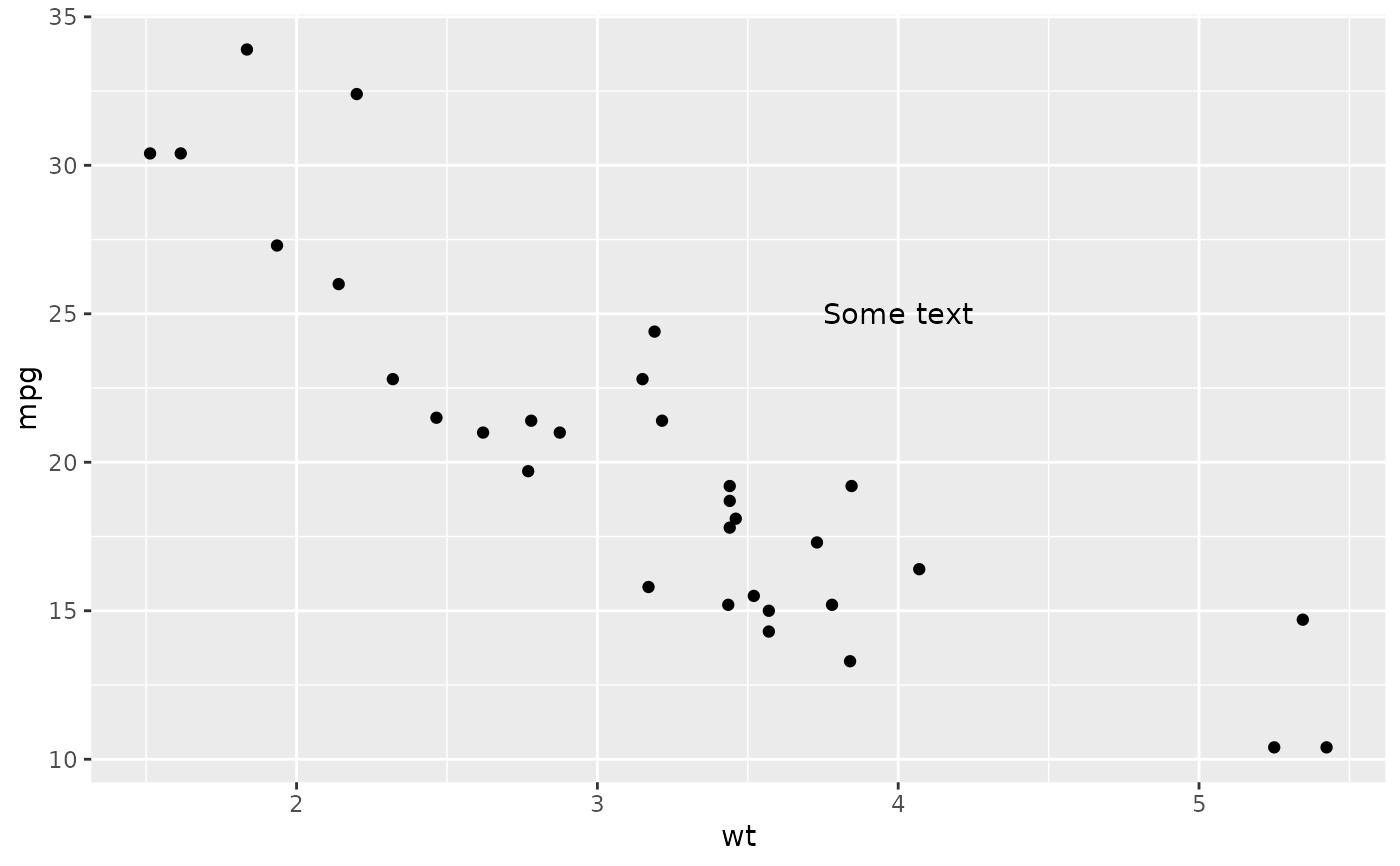
p + annotate("text", x = 4, y = 25, label = "Some text")
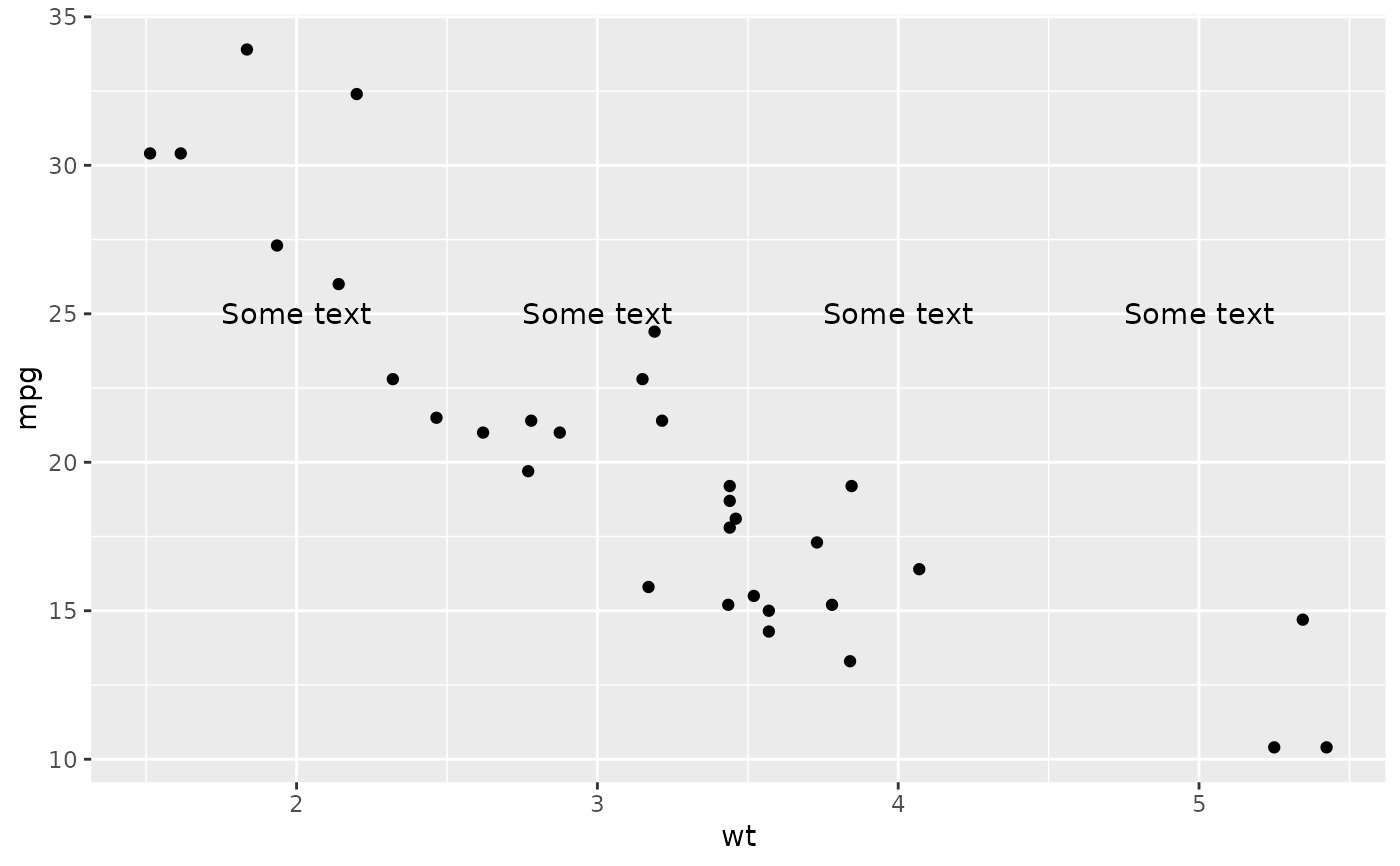
 p + annotate("text", x = 2:5, y = 25, label = "Some text")
 p + annotate("rect", xmin = 3, xmax = 4.2, ymin = 12, ymax = 21,
alpha = .2)
p + annotate("rect", xmin = 3, xmax = 4.2, ymin = 12, ymax = 21,
alpha = .2)
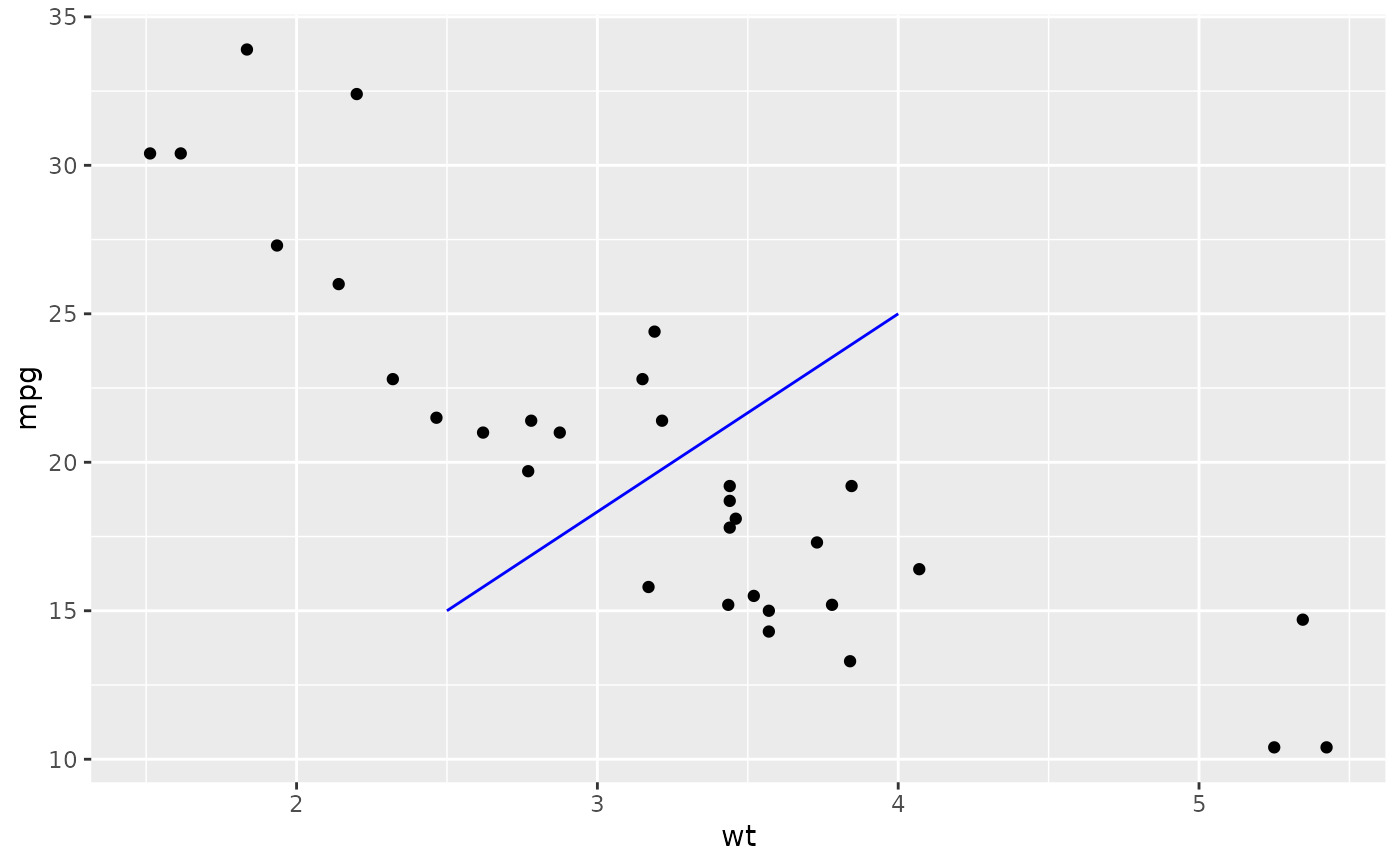
 p + annotate("segment", x = 2.5, xend = 4, y = 15, yend = 25,
colour = "blue")
p + annotate("segment", x = 2.5, xend = 4, y = 15, yend = 25,
colour = "blue")
 p + annotate("pointrange", x = 3.5, y = 20, ymin = 12, ymax = 28,
colour = "red", size = 2.5, linewidth = 1.5)
p + annotate("pointrange", x = 3.5, y = 20, ymin = 12, ymax = 28,
colour = "red", size = 2.5, linewidth = 1.5)
 p + annotate("text", x = 2:3, y = 20:21, label = c("my label", "label 2"))
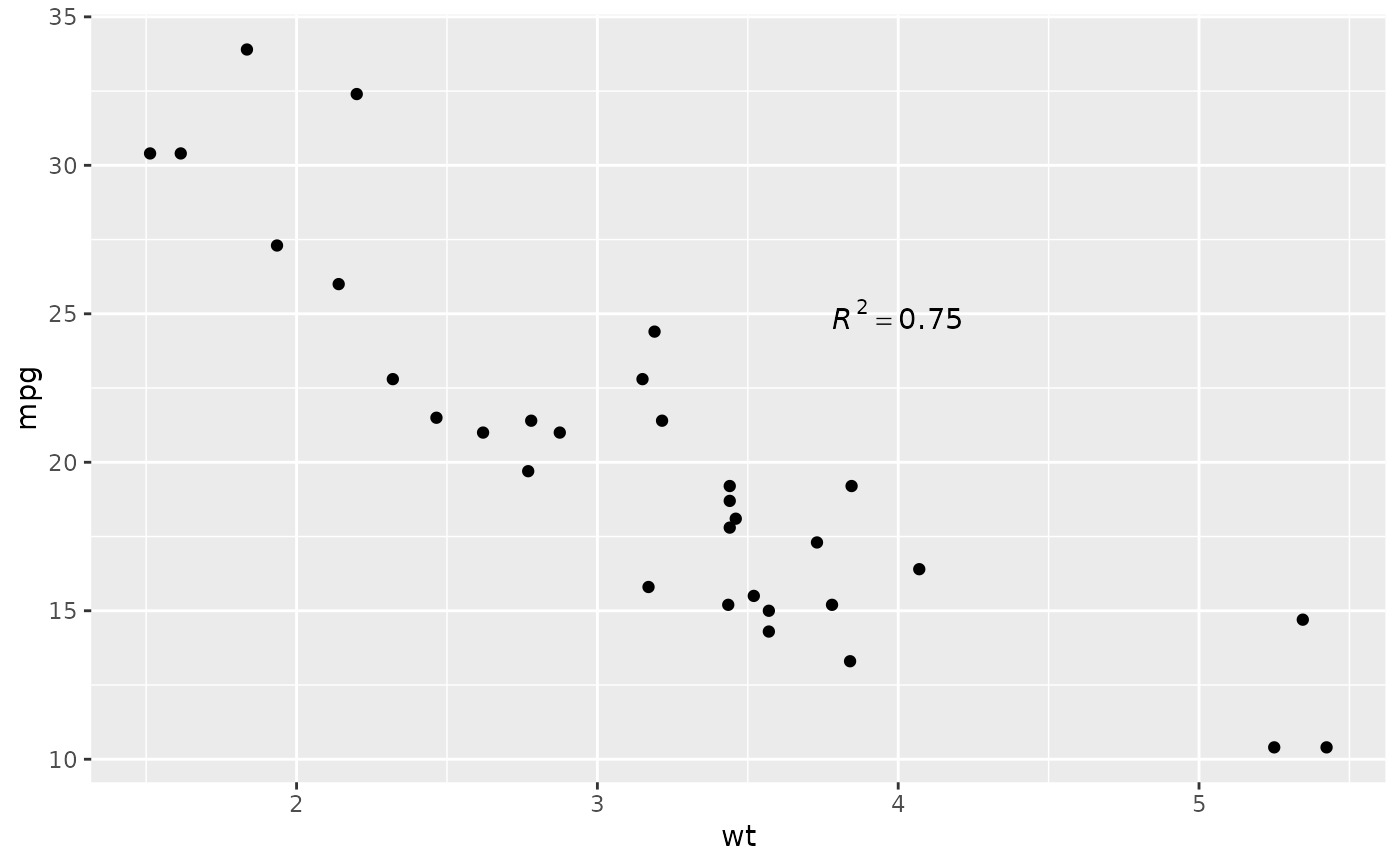
 p + annotate("text", x = 4, y = 25, label = "italic(R) ^ 2 == 0.75",
parse = TRUE)
p + annotate("text", x = 4, y = 25, label = "italic(R) ^ 2 == 0.75",
parse = TRUE)
 p + annotate("text", x = 4, y = 25,
label = "paste(italic(R) ^ 2, \" = .75\")", parse = TRUE)
p + annotate("text", x = 4, y = 25,
label = "paste(italic(R) ^ 2, \" = .75\")", parse = TRUE)

相關用法
- R ggplot2 annotation_logticks 注釋:記錄刻度線
- R ggplot2 annotation_custom 注釋:自定義grob
- R ggplot2 annotation_map 注釋:Map
- R ggplot2 annotation_raster 注釋:高性能矩形平鋪
- R ggplot2 aes_eval 控製審美評價
- R ggplot2 aes 構建美學映射
- R ggplot2 as_labeller 強製貼標機函數
- R ggplot2 vars 引用分麵變量
- R ggplot2 position_stack 將重疊的對象堆疊在一起
- R ggplot2 geom_qq 分位數-分位數圖
- R ggplot2 geom_spoke 由位置、方向和距離參數化的線段
- R ggplot2 geom_quantile 分位數回歸
- R ggplot2 geom_text 文本
- R ggplot2 get_alt_text 從繪圖中提取替代文本
- R ggplot2 geom_ribbon 函數區和麵積圖
- R ggplot2 stat_ellipse 計算法行數據橢圓
- R ggplot2 resolution 計算數值向量的“分辨率”
- R ggplot2 geom_boxplot 盒須圖(Tukey 風格)
- R ggplot2 lims 設置規模限製
- R ggplot2 geom_hex 二維箱計數的六邊形熱圖
- R ggplot2 scale_gradient 漸變色階
- R ggplot2 scale_shape 形狀比例,又稱字形
- R ggplot2 geom_bar 條形圖
- R ggplot2 draw_key 圖例的關鍵字形
- R ggplot2 label_bquote 帶有數學表達式的標簽
注:本文由純淨天空篩選整理自Hadley Wickham等大神的英文原創作品 Create an annotation layer。非經特殊聲明,原始代碼版權歸原作者所有,本譯文未經允許或授權,請勿轉載或複製。