此注釋添加了間距遞減的對數刻度線。這些刻度線可能隻對以 10 為基數的情況有意義。
用法
annotation_logticks(
  base = 10,
  sides = "bl",
  outside = FALSE,
  scaled = TRUE,
  short = unit(0.1, "cm"),
  mid = unit(0.2, "cm"),
  long = unit(0.3, "cm"),
  colour = "black",
  size = 0.5,
  linetype = 1,
  alpha = 1,
  color = NULL,
  ...
)
參數
- base
-
日誌的基數(默認10)
- sides
-
控製對數刻度出現在圖的哪一側的字符串。它可以設置為包含任何
"trbl"的字符串,用於頂部、右側、底部和左側。 - outside
-
控製是否將日誌刻度移動到繪圖區域之外的邏輯。默認關閉(
FALSE)。您還需要使用coord_cartesian(clip = "off")。請參閱示例。 - scaled
-
數據已經log-scaled了嗎?當數據已使用
log10()轉換或使用scale_y_log10()時,這應該是TRUE(默認)。使用coord_trans(y = "log10")時應為FALSE。 - short
-
指定短刻度線長度的
grid::unit()對象 - mid
-
指定中間刻度線長度的
grid::unit()對象。以 10 為基數,這些是 "5" 刻度。 - long
-
指定長刻度線長度的
grid::unit()對象。以 10 為基數,這些是"1"(或"10")刻度。 - colour
-
刻度線的顏色。
- size
-
刻度線的厚度,以毫米為單位。
- linetype
-
刻度線的線型(
solid、dashed等) - alpha
-
刻度線的透明度。
- color
-
colour的別名。 - ...
-
傳遞到層的其他參數
也可以看看
scale_y_continuous() 、 scale_y_log10() 用於對數刻度轉換。
coord_trans() 用於日誌坐標轉換。
例子
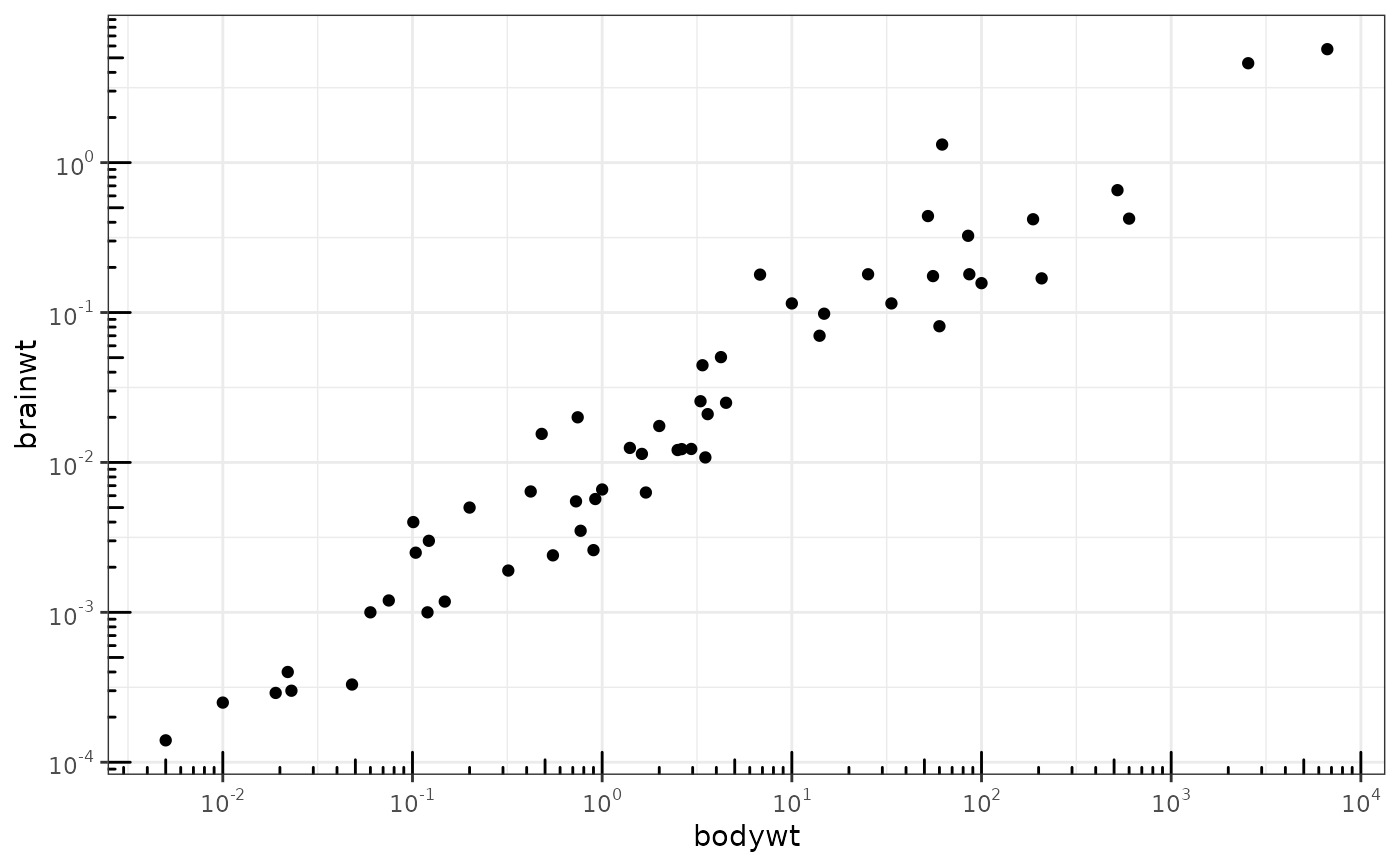
# Make a log-log plot (without log ticks)
a <- ggplot(msleep, aes(bodywt, brainwt)) +
geom_point(na.rm = TRUE) +
scale_x_log10(
breaks = scales::trans_breaks("log10", function(x) 10^x),
labels = scales::trans_format("log10", scales::math_format(10^.x))
) +
scale_y_log10(
breaks = scales::trans_breaks("log10", function(x) 10^x),
labels = scales::trans_format("log10", scales::math_format(10^.x))
) +
theme_bw()
a + annotation_logticks() # Default: log ticks on bottom and left
 a + annotation_logticks(sides = "lr") # Log ticks for y, on left and right
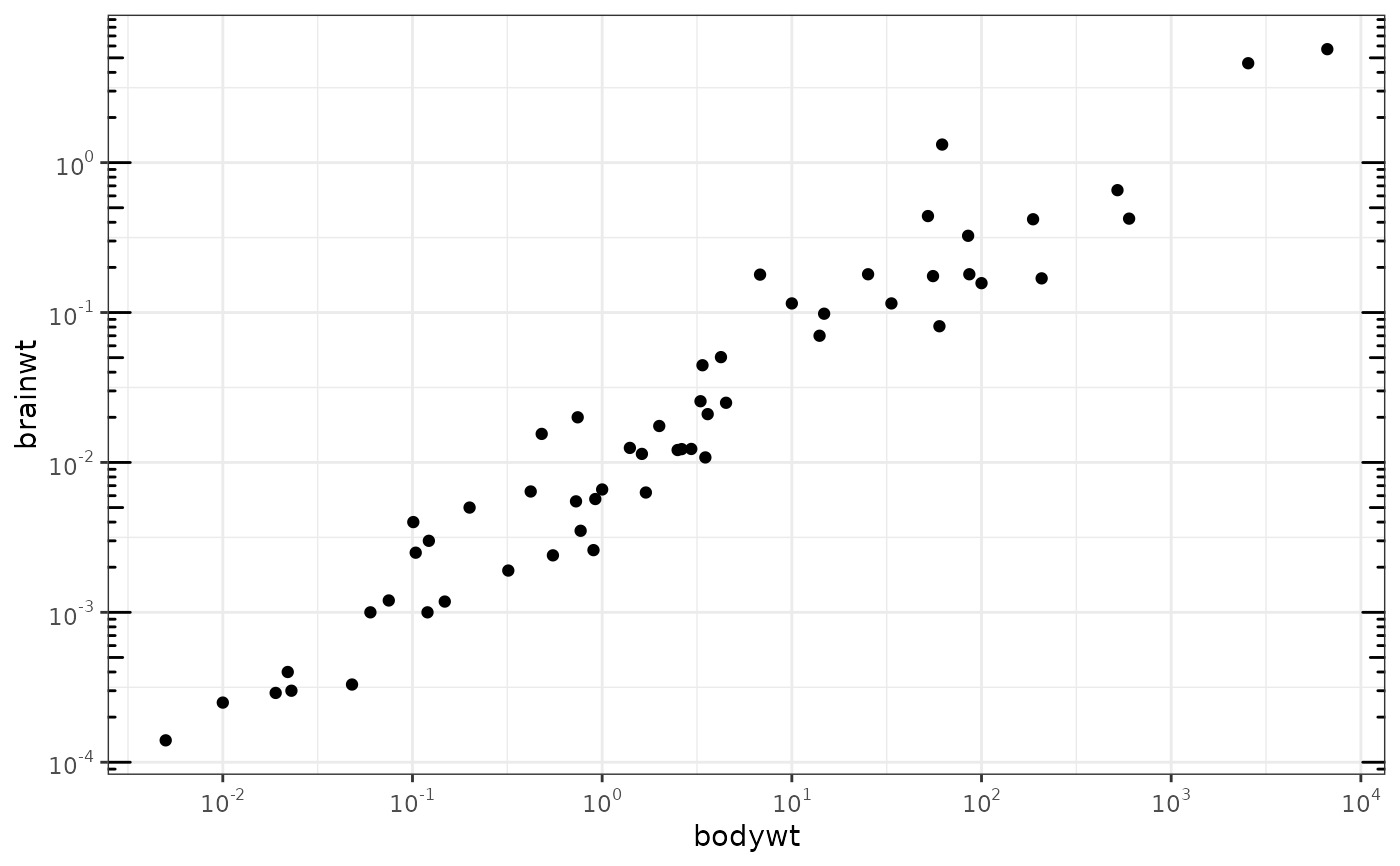 a + annotation_logticks(sides = "trbl") # All four sides
 a + annotation_logticks(sides = "lr", outside = TRUE) +
coord_cartesian(clip = "off") # Ticks outside plot
a + annotation_logticks(sides = "lr", outside = TRUE) +
coord_cartesian(clip = "off") # Ticks outside plot
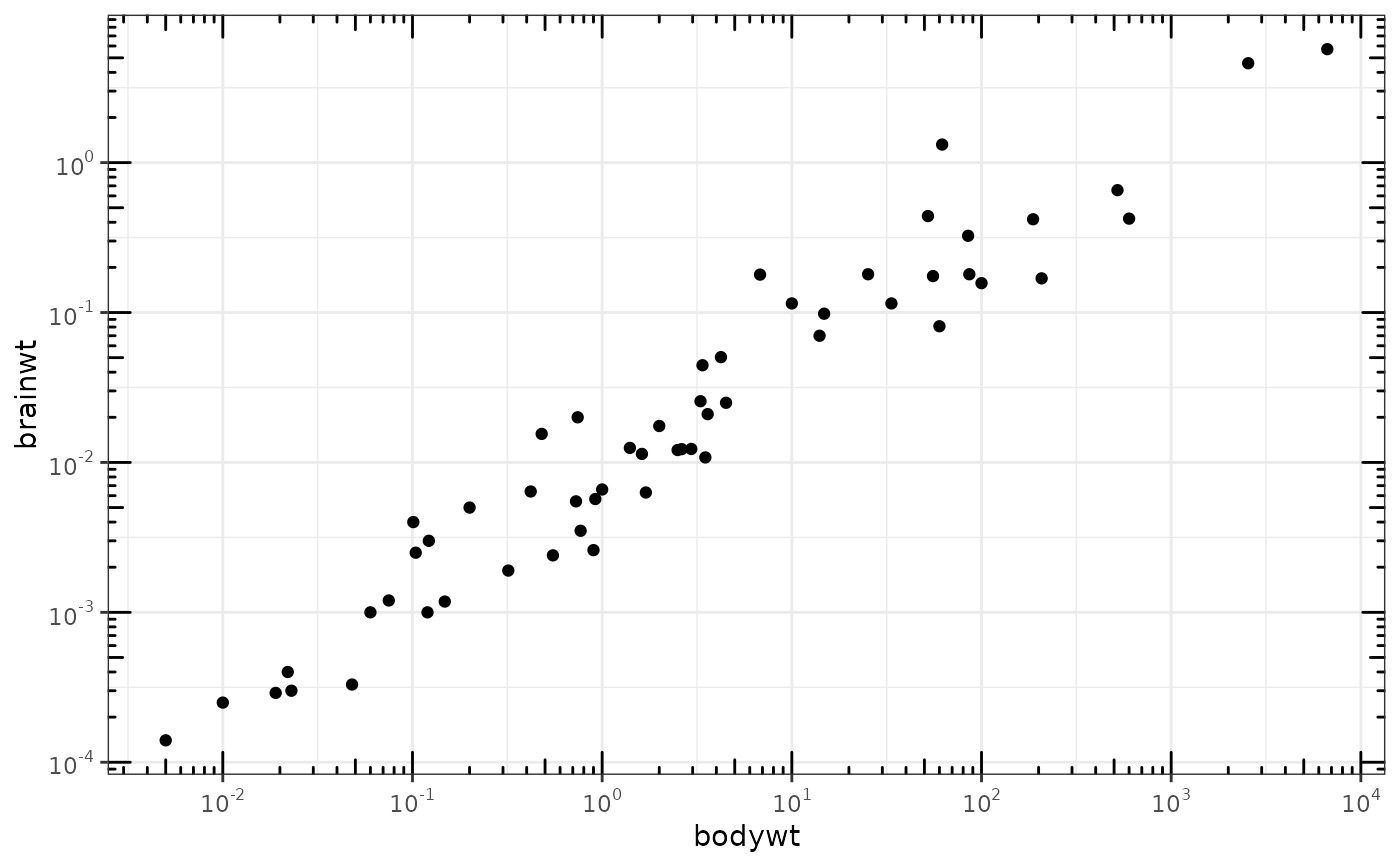
 # Hide the minor grid lines because they don't align with the ticks
a + annotation_logticks(sides = "trbl") + theme(panel.grid.minor = element_blank())
# Hide the minor grid lines because they don't align with the ticks
a + annotation_logticks(sides = "trbl") + theme(panel.grid.minor = element_blank())
 # Another way to get the same results as 'a' above: log-transform the data before
# plotting it. Also hide the minor grid lines.
b <- ggplot(msleep, aes(log10(bodywt), log10(brainwt))) +
geom_point(na.rm = TRUE) +
scale_x_continuous(name = "body", labels = scales::math_format(10^.x)) +
scale_y_continuous(name = "brain", labels = scales::math_format(10^.x)) +
theme_bw() + theme(panel.grid.minor = element_blank())
b + annotation_logticks()
# Another way to get the same results as 'a' above: log-transform the data before
# plotting it. Also hide the minor grid lines.
b <- ggplot(msleep, aes(log10(bodywt), log10(brainwt))) +
geom_point(na.rm = TRUE) +
scale_x_continuous(name = "body", labels = scales::math_format(10^.x)) +
scale_y_continuous(name = "brain", labels = scales::math_format(10^.x)) +
theme_bw() + theme(panel.grid.minor = element_blank())
b + annotation_logticks()
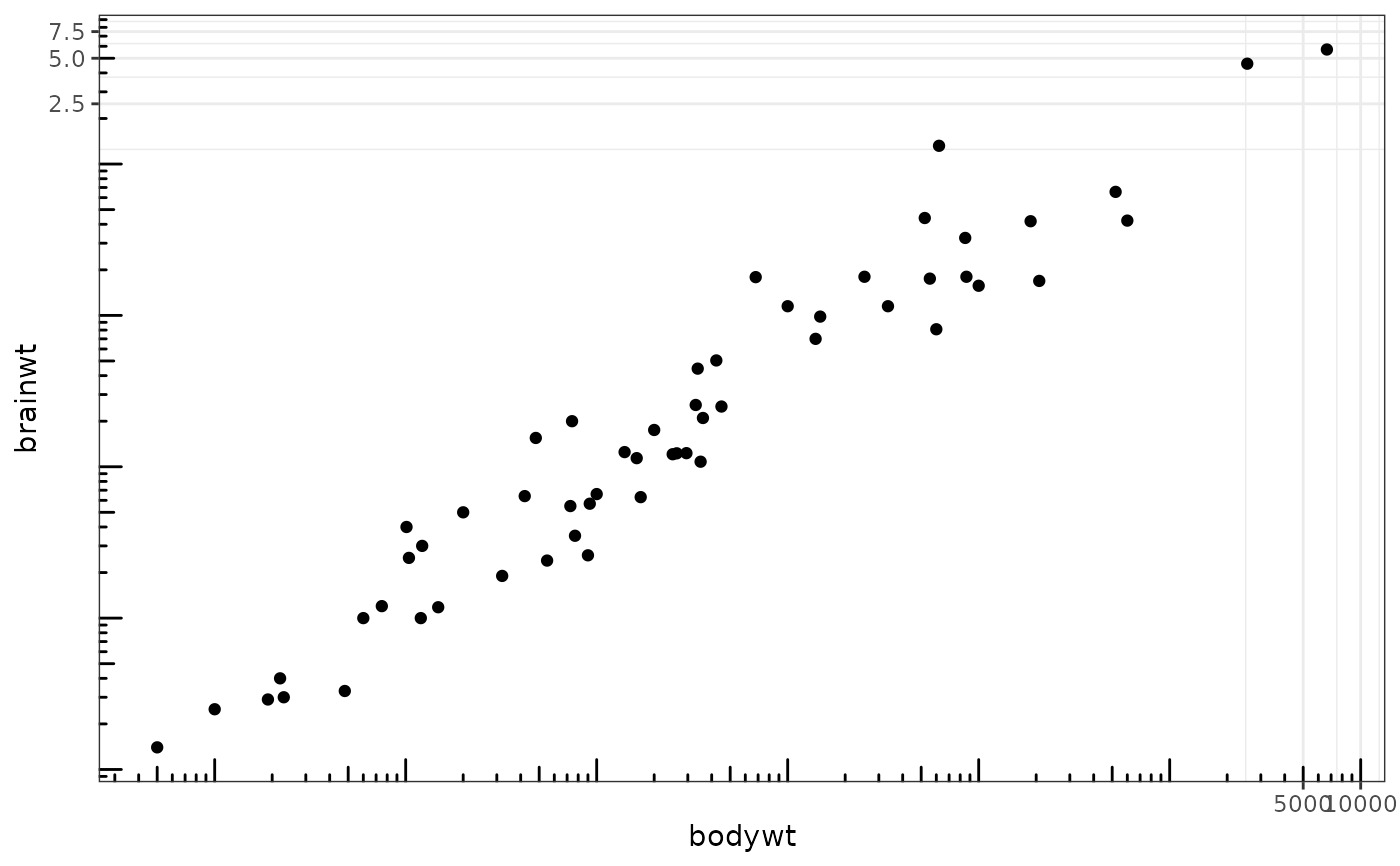
 # Using a coordinate transform requires scaled = FALSE
t <- ggplot(msleep, aes(bodywt, brainwt)) +
geom_point() +
coord_trans(x = "log10", y = "log10") +
theme_bw()
t + annotation_logticks(scaled = FALSE)
#> Warning: Removed 27 rows containing missing values (`geom_point()`).
# Using a coordinate transform requires scaled = FALSE
t <- ggplot(msleep, aes(bodywt, brainwt)) +
geom_point() +
coord_trans(x = "log10", y = "log10") +
theme_bw()
t + annotation_logticks(scaled = FALSE)
#> Warning: Removed 27 rows containing missing values (`geom_point()`).
 # Change the length of the ticks
a + annotation_logticks(
short = unit(.5,"mm"),
mid = unit(3,"mm"),
long = unit(4,"mm")
)
# Change the length of the ticks
a + annotation_logticks(
short = unit(.5,"mm"),
mid = unit(3,"mm"),
long = unit(4,"mm")
)

相關用法
- R ggplot2 annotation_custom 注釋:自定義grob
- R ggplot2 annotation_map 注釋:Map
- R ggplot2 annotation_raster 注釋:高性能矩形平鋪
- R ggplot2 annotate 創建注釋層
- R ggplot2 aes_eval 控製審美評價
- R ggplot2 aes 構建美學映射
- R ggplot2 as_labeller 強製貼標機函數
- R ggplot2 vars 引用分麵變量
- R ggplot2 position_stack 將重疊的對象堆疊在一起
- R ggplot2 geom_qq 分位數-分位數圖
- R ggplot2 geom_spoke 由位置、方向和距離參數化的線段
- R ggplot2 geom_quantile 分位數回歸
- R ggplot2 geom_text 文本
- R ggplot2 get_alt_text 從繪圖中提取替代文本
- R ggplot2 geom_ribbon 函數區和麵積圖
- R ggplot2 stat_ellipse 計算法行數據橢圓
- R ggplot2 resolution 計算數值向量的“分辨率”
- R ggplot2 geom_boxplot 盒須圖(Tukey 風格)
- R ggplot2 lims 設置規模限製
- R ggplot2 geom_hex 二維箱計數的六邊形熱圖
- R ggplot2 scale_gradient 漸變色階
- R ggplot2 scale_shape 形狀比例,又稱字形
- R ggplot2 geom_bar 條形圖
- R ggplot2 draw_key 圖例的關鍵字形
- R ggplot2 label_bquote 帶有數學表達式的標簽
注:本文由純淨天空篩選整理自Hadley Wickham等大神的英文原創作品 Annotation: log tick marks。非經特殊聲明,原始代碼版權歸原作者所有,本譯文未經允許或授權,請勿轉載或複製。