美學映射說明了數據中的變量如何映射到幾何的視覺屬性(美學)。可以在 ggplot() 和各個層中設置美學映射。
參數
- x, y, ...
-
<
data-masking>aesthetic = variable形式的 name-value 對列表,說明圖層數據中的哪些變量應映射到配對的 geom/stat 使用的美學。表達式variable在圖層數據內進行計算,因此無需引用原始數據集(即使用ggplot(df, aes(variable))而不是ggplot(df, aes(df$variable)))。 x 和 y 美學的名稱通常被省略,因為它們非常常見;所有其他美學都必須被命名。
細節
該函數還通過將 color 轉換為 colour (也在子字符串中,例如 point_color 到 point_colour )並將舊式 R 名稱轉換為 ggplot 名稱(例如 pch 到 shape 和cex 到 size )。
準引號
aes() 是 quoting function 。這意味著它的輸入被引用以在數據上下文中進行評估。這使得使用 DataFrame 中的變量變得容易,因為您可以直接命名它們。另一方麵是您必須使用 quasiquotation 來使用 aes() 進行編程。請參閱dplyr programming vignette 等簡潔的評估教程,了解有關這些技術的更多信息。
也可以看看
vars() 用於另一個專為分麵規範設計的引用函數。
Delayed evaluation 用於處理計算變量。
例子
aes(x = mpg, y = wt)
#> Aesthetic mapping:
#> * `x` -> `mpg`
#> * `y` -> `wt`
aes(mpg, wt)
#> Aesthetic mapping:
#> * `x` -> `mpg`
#> * `y` -> `wt`
# You can also map aesthetics to functions of variables
aes(x = mpg ^ 2, y = wt / cyl)
#> Aesthetic mapping:
#> * `x` -> `mpg^2`
#> * `y` -> `wt/cyl`
# Or to constants
aes(x = 1, colour = "smooth")
#> Aesthetic mapping:
#> * `x` -> 1
#> * `colour` -> "smooth"
# Aesthetic names are automatically standardised
aes(col = x)
#> Aesthetic mapping:
#> * `colour` -> `x`
aes(fg = x)
#> Aesthetic mapping:
#> * `colour` -> `x`
aes(color = x)
#> Aesthetic mapping:
#> * `colour` -> `x`
aes(colour = x)
#> Aesthetic mapping:
#> * `colour` -> `x`
# aes() is passed to either ggplot() or specific layer. Aesthetics supplied
# to ggplot() are used as defaults for every layer.
ggplot(mpg, aes(displ, hwy)) + geom_point()
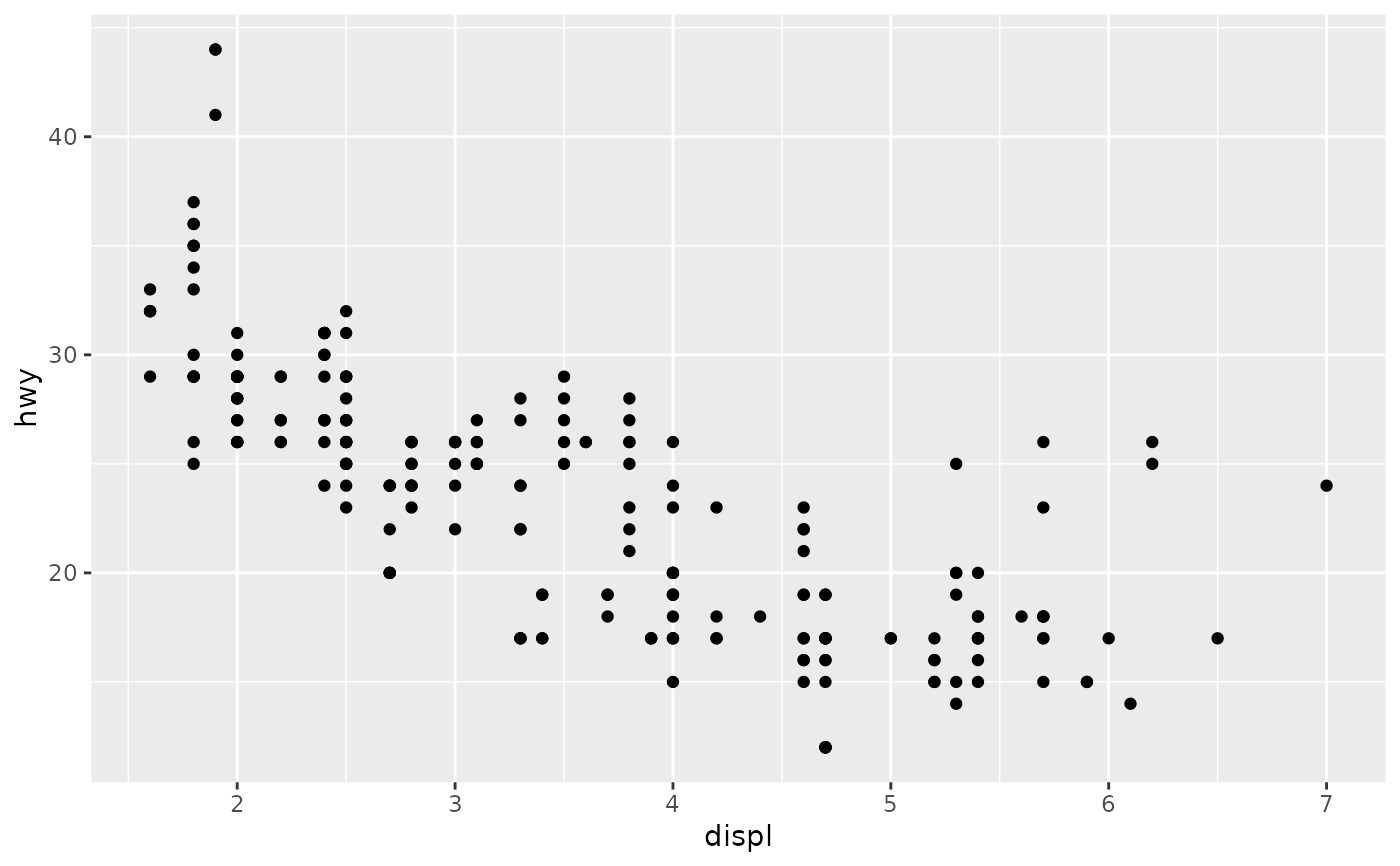 ggplot(mpg) + geom_point(aes(displ, hwy))
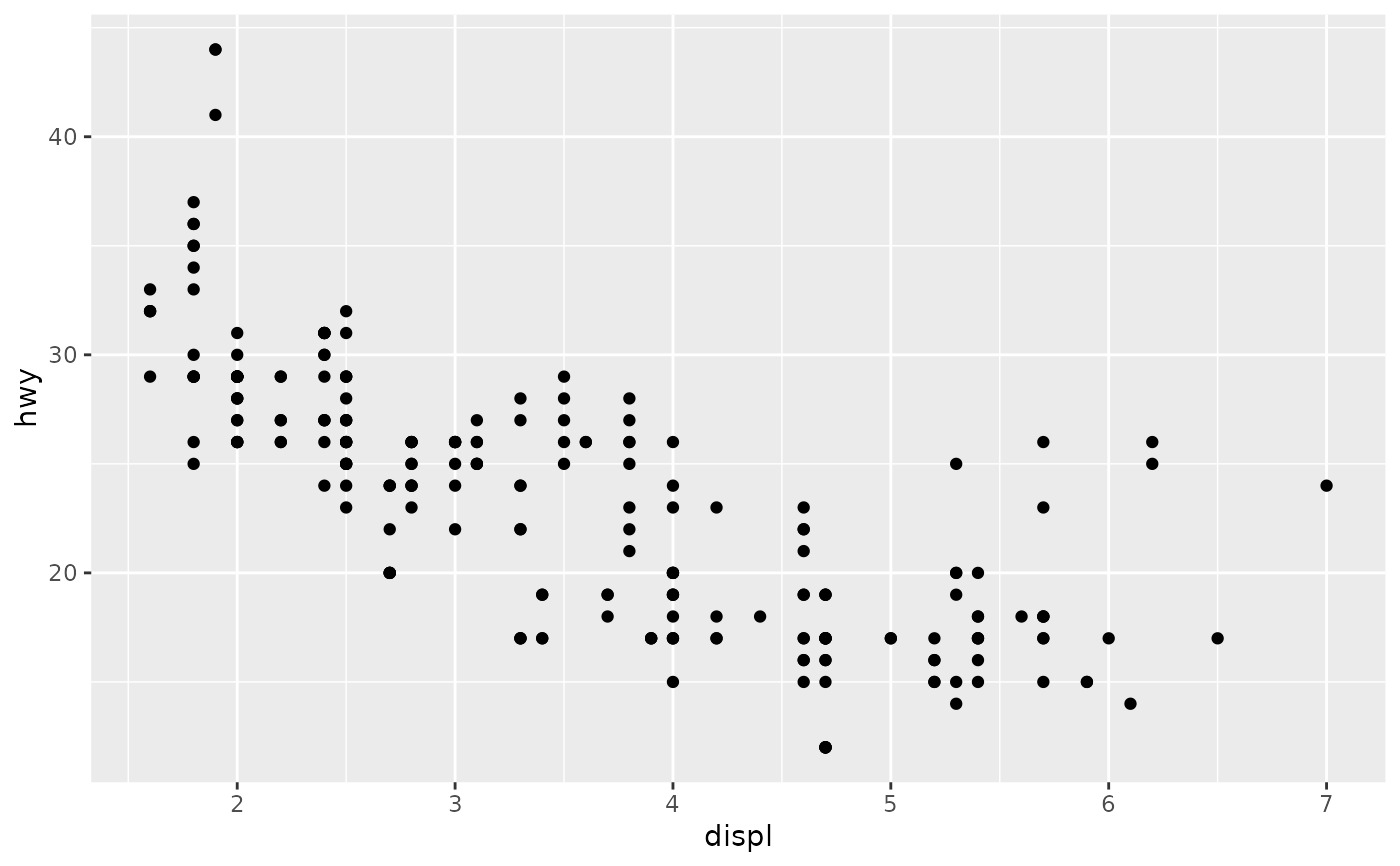 # Tidy evaluation ----------------------------------------------------
# aes() automatically quotes all its arguments, so you need to use tidy
# evaluation to create wrappers around ggplot2 pipelines. The
# simplest case occurs when your wrapper takes dots:
scatter_by <- function(data, ...) {
ggplot(data) + geom_point(aes(...))
}
scatter_by(mtcars, disp, drat)
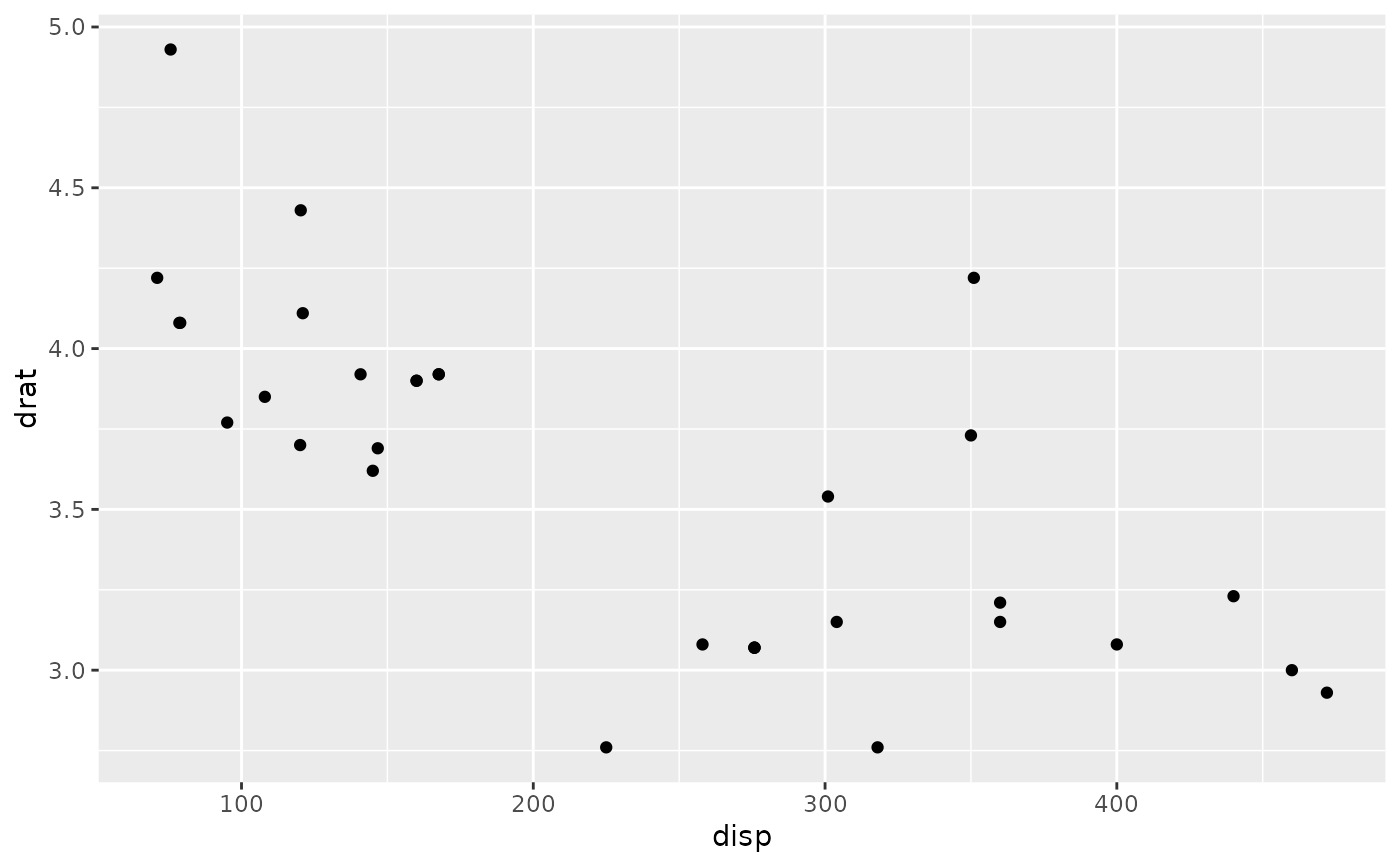 # If your wrapper has a more specific interface with named arguments,
# you need the "embrace operator":
scatter_by <- function(data, x, y) {
ggplot(data) + geom_point(aes({{ x }}, {{ y }}))
}
scatter_by(mtcars, disp, drat)
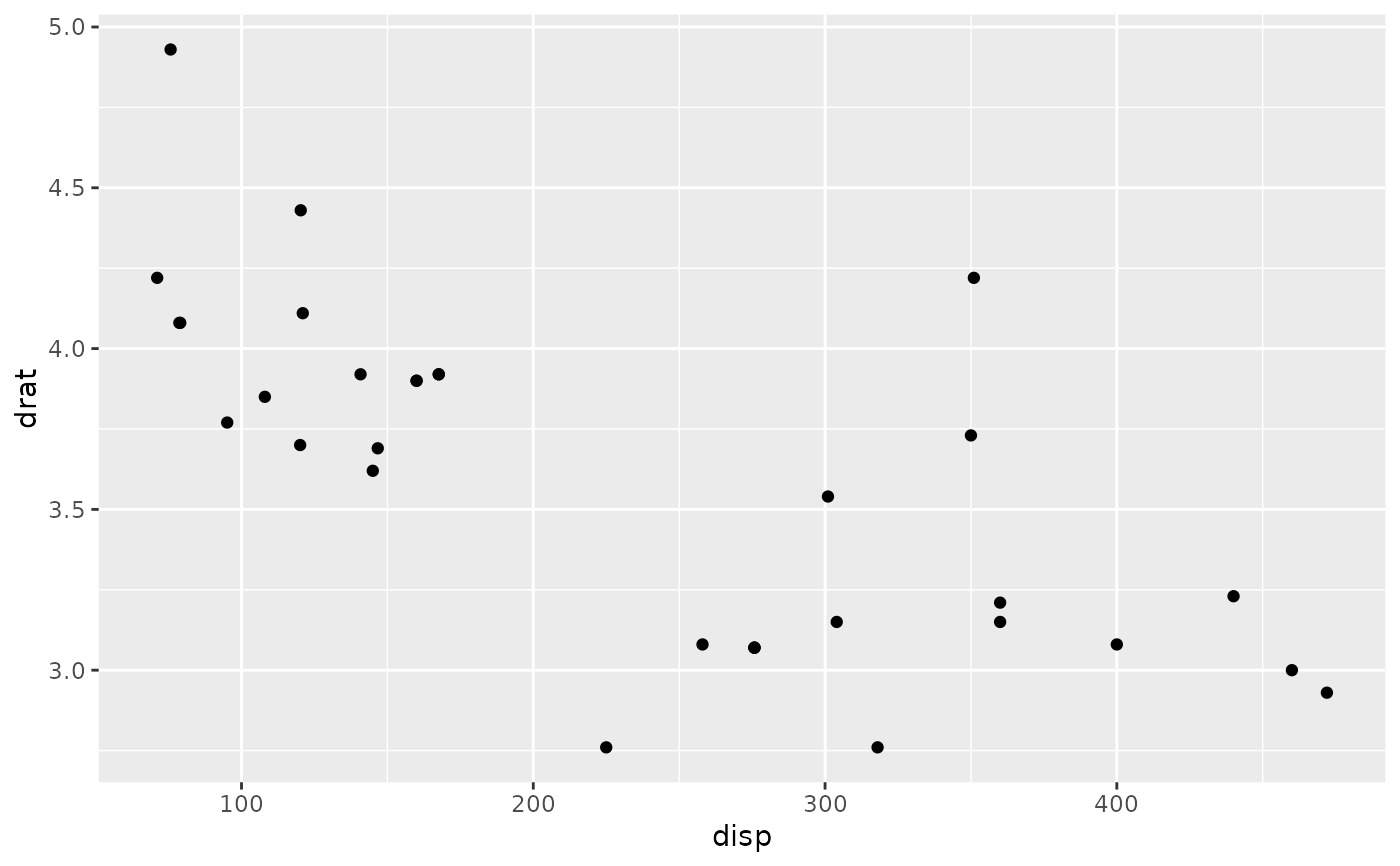 # Note that users of your wrapper can use their own functions in the
# quoted expressions and all will resolve as it should!
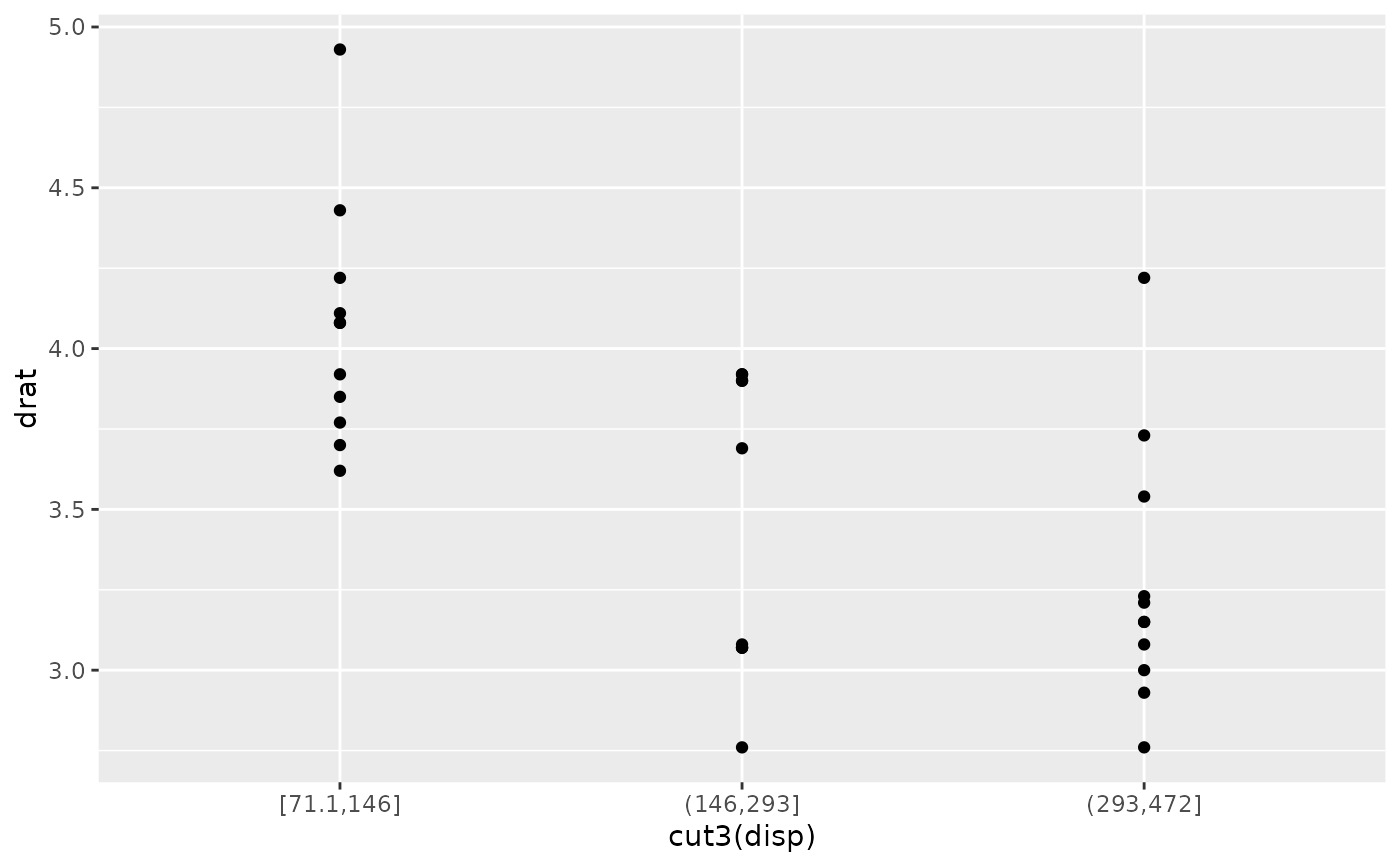
cut3 <- function(x) cut_number(x, 3)
scatter_by(mtcars, cut3(disp), drat)
相關用法
- R ggplot2 aes_eval 控製審美評價
- R ggplot2 annotation_logticks 注釋:記錄刻度線
- R ggplot2 annotation_custom 注釋:自定義grob
- R ggplot2 annotate 創建注釋層
- R ggplot2 annotation_map 注釋:Map
- R ggplot2 annotation_raster 注釋:高性能矩形平鋪
- R ggplot2 as_labeller 強製貼標機函數
- R ggplot2 vars 引用分麵變量
- R ggplot2 position_stack 將重疊的對象堆疊在一起
- R ggplot2 geom_qq 分位數-分位數圖
- R ggplot2 geom_spoke 由位置、方向和距離參數化的線段
- R ggplot2 geom_quantile 分位數回歸
- R ggplot2 geom_text 文本
- R ggplot2 get_alt_text 從繪圖中提取替代文本
- R ggplot2 geom_ribbon 函數區和麵積圖
- R ggplot2 stat_ellipse 計算法行數據橢圓
- R ggplot2 resolution 計算數值向量的“分辨率”
- R ggplot2 geom_boxplot 盒須圖(Tukey 風格)
- R ggplot2 lims 設置規模限製
- R ggplot2 geom_hex 二維箱計數的六邊形熱圖
- R ggplot2 scale_gradient 漸變色階
- R ggplot2 scale_shape 形狀比例,又稱字形
- R ggplot2 geom_bar 條形圖
- R ggplot2 draw_key 圖例的關鍵字形
- R ggplot2 label_bquote 帶有數學表達式的標簽
注:本文由純淨天空篩選整理自Hadley Wickham等大神的英文原創作品 Construct aesthetic mappings。非經特殊聲明,原始代碼版權歸原作者所有,本譯文未經允許或授權,請勿轉載或複製。
