計算橢圓的方法已從 car::dataEllipse 修改(Fox 和 Weisberg 2011,Friendly 和 Monette 2013)
用法
stat_ellipse(
  mapping = NULL,
  data = NULL,
  geom = "path",
  position = "identity",
  ...,
  type = "t",
  level = 0.95,
  segments = 51,
  na.rm = FALSE,
  show.legend = NA,
  inherit.aes = TRUE
)
參數
- mapping
-
由
aes()創建的一組美學映射。如果指定且inherit.aes = TRUE(默認),它將與繪圖頂層的默認映射組合。如果沒有繪圖映射,則必須提供mapping。 - data
-
該層要顯示的數據。有以下三種選擇:
如果默認為
NULL,則數據繼承自ggplot()調用中指定的繪圖數據。data.frame或其他對象將覆蓋繪圖數據。所有對象都將被強化以生成 DataFrame 。請參閱fortify()將為其創建變量。將使用單個參數(繪圖數據)調用
function。返回值必須是data.frame,並將用作圖層數據。可以從formula創建function(例如~ head(.x, 10))。 - geom
-
用於顯示數據的幾何對象,可以作為
ggprotoGeom子類,也可以作為命名去除geom_前綴的幾何對象的字符串(例如"point"而不是"geom_point") - position
-
位置調整,可以是命名調整的字符串(例如
"jitter"使用position_jitter),也可以是調用位置調整函數的結果。如果需要更改調整設置,請使用後者。 - ...
-
其他參數傳遞給
layer()。這些通常是美學,用於將美學設置為固定值,例如colour = "red"或size = 3。它們也可能是配對的 geom/stat 的參數。 - type
-
橢圓的類型。默認
"t"假定多元 t 分布,"norm"假定多元正態分布。"euclid"繪製一個半徑等於level的圓,表示距中心的歐氏距離。除非應用coord_fixed(),否則該橢圓可能不會顯示為圓形。 - level
-
繪製橢圓的級別,或者,如果是
type="euclid",則為要繪製的圓的半徑。 - segments
-
繪製橢圓時使用的線段數。
- na.rm
-
如果
FALSE,則默認缺失值將被刪除並帶有警告。如果TRUE,缺失值將被靜默刪除。 - show.legend
-
合乎邏輯的。該層是否應該包含在圖例中?
NA(默認值)包括是否映射了任何美學。FALSE從不包含,而TRUE始終包含。它也可以是一個命名的邏輯向量,以精細地選擇要顯示的美學。 - inherit.aes
-
如果
FALSE,則覆蓋默認美學,而不是與它們組合。這對於定義數據和美觀的輔助函數最有用,並且不應繼承默認繪圖規範的行為,例如borders()。
參考
約翰·福克斯和桑福德·韋斯伯格 (2011)。一個R應用回歸伴侶,第二版。加利福尼亞州千橡市:聖人。網址:https://socialsciences.mcmaster.ca/jfox/Books/Companion/
邁克爾·友善。喬治·莫內特.約翰·福克斯。 “橢圓見解:通過橢圓幾何理解統計方法。”國家主義者。科學。 28 (1) 1 - 39,2013 年 2 月。網址:https://projecteuclid.org/journals/statistical-science/volume-28/issue-1/Elliptical-Insights-Understanding-Statistical-Methods-through-Elliptical-Geometry/10.1214/12-STS402.full
例子
ggplot(faithful, aes(waiting, eruptions)) +
geom_point() +
stat_ellipse()
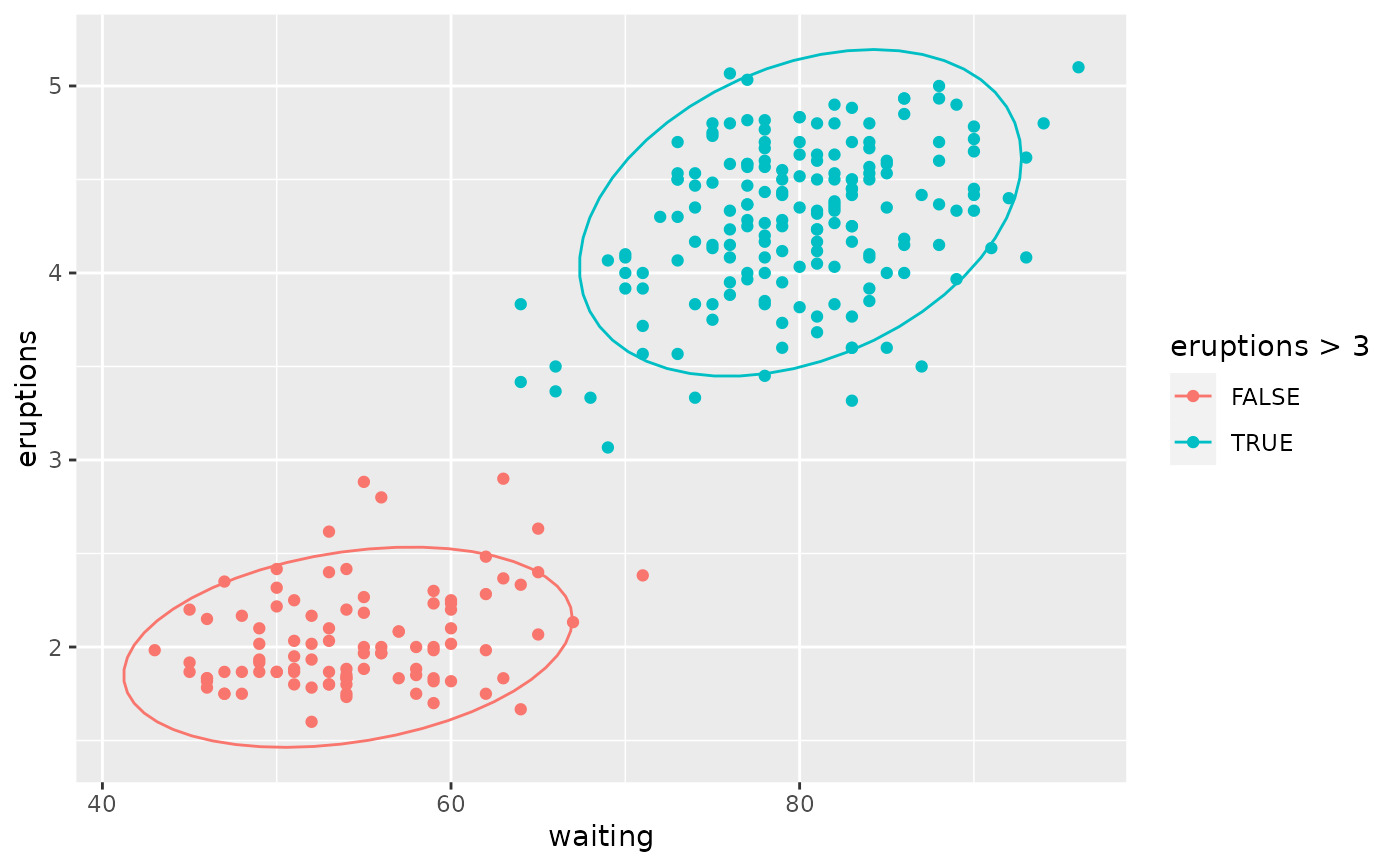
 ggplot(faithful, aes(waiting, eruptions, color = eruptions > 3)) +
geom_point() +
stat_ellipse()
ggplot(faithful, aes(waiting, eruptions, color = eruptions > 3)) +
geom_point() +
stat_ellipse()
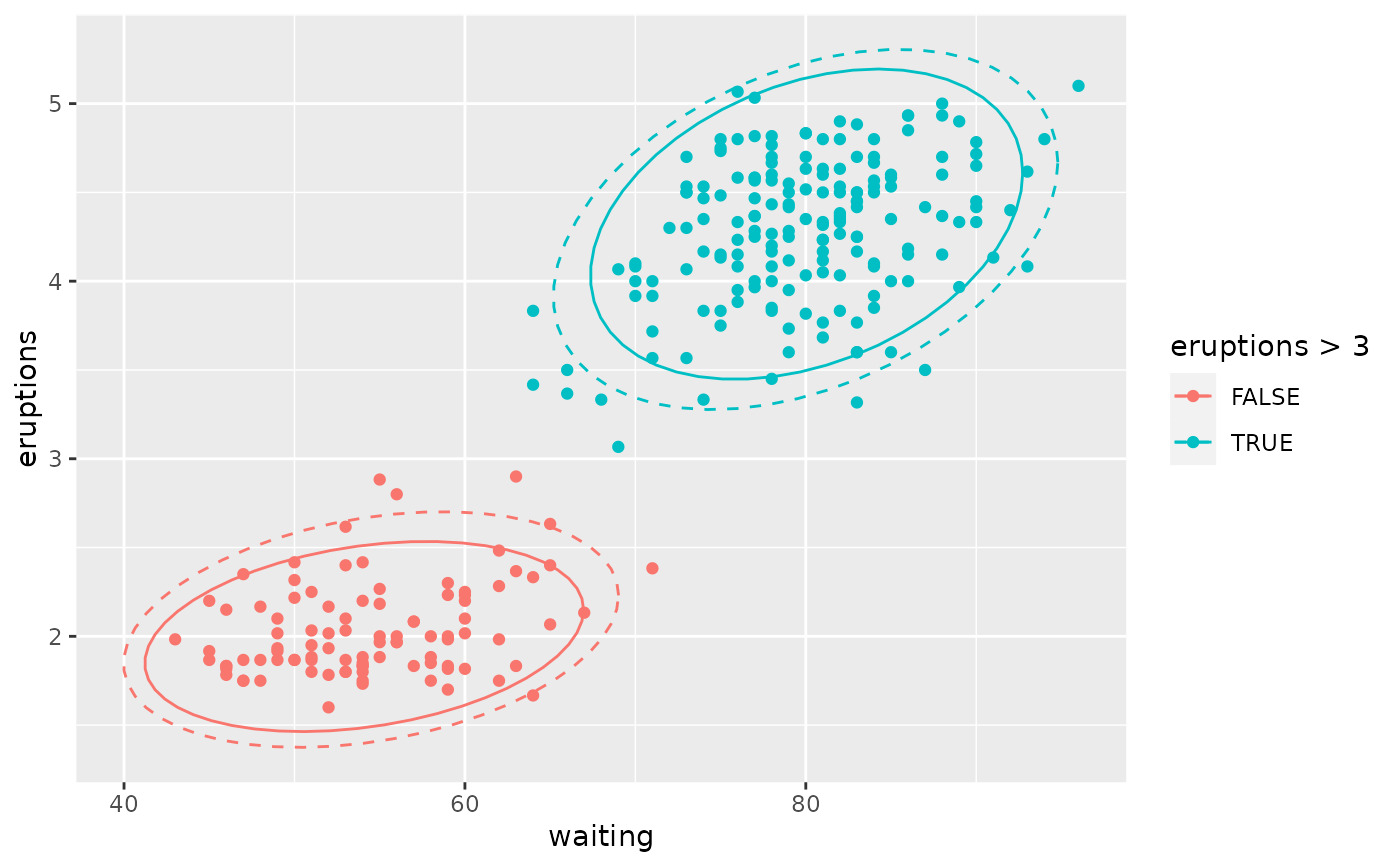
 ggplot(faithful, aes(waiting, eruptions, color = eruptions > 3)) +
geom_point() +
stat_ellipse(type = "norm", linetype = 2) +
stat_ellipse(type = "t")
ggplot(faithful, aes(waiting, eruptions, color = eruptions > 3)) +
geom_point() +
stat_ellipse(type = "norm", linetype = 2) +
stat_ellipse(type = "t")
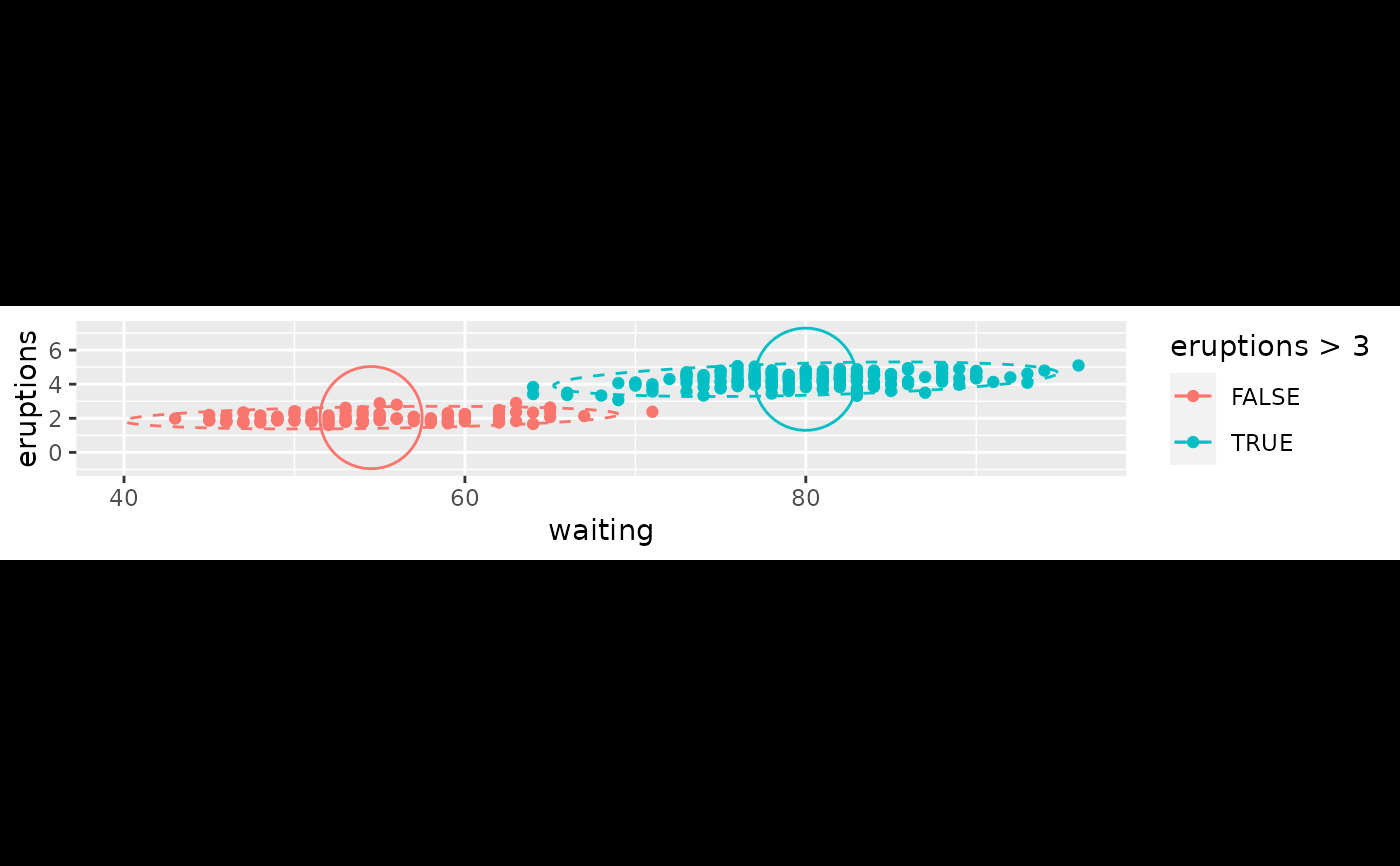
 ggplot(faithful, aes(waiting, eruptions, color = eruptions > 3)) +
geom_point() +
stat_ellipse(type = "norm", linetype = 2) +
stat_ellipse(type = "euclid", level = 3) +
coord_fixed()
ggplot(faithful, aes(waiting, eruptions, color = eruptions > 3)) +
geom_point() +
stat_ellipse(type = "norm", linetype = 2) +
stat_ellipse(type = "euclid", level = 3) +
coord_fixed()
 ggplot(faithful, aes(waiting, eruptions, fill = eruptions > 3)) +
stat_ellipse(geom = "polygon")
ggplot(faithful, aes(waiting, eruptions, fill = eruptions > 3)) +
stat_ellipse(geom = "polygon")

相關用法
- R ggplot2 stat_ecdf 計算經驗累積分布
- R ggplot2 stat_identity 保留數據原樣
- R ggplot2 stat_summary_2d 以二維形式進行分類和匯總(矩形和六邊形)
- R ggplot2 stat_summary 總結唯一/分箱 x 處的 y 值
- R ggplot2 stat_sf_coordinates 從“sf”對象中提取坐標
- R ggplot2 stat_unique 刪除重複項
- R ggplot2 scale_gradient 漸變色階
- R ggplot2 scale_shape 形狀比例,又稱字形
- R ggplot2 scale_viridis 來自 viridisLite 的 Viridis 色標
- R ggplot2 scale_grey 連續灰度色階
- R ggplot2 scale_linetype 線條圖案的比例
- R ggplot2 scale_discrete 離散數據的位置尺度
- R ggplot2 scale_manual 創建您自己的離散尺度
- R ggplot2 scale_colour_discrete 離散色階
- R ggplot2 scale_steps 分級漸變色標
- R ggplot2 should_stop 在示例中用於說明何時應該發生錯誤。
- R ggplot2 scale_size 麵積或半徑比例
- R ggplot2 scale_date 日期/時間數據的位置刻度
- R ggplot2 scale_continuous 連續數據的位置比例(x 和 y)
- R ggplot2 scale_binned 用於對連續數據進行裝箱的位置比例(x 和 y)
- R ggplot2 sec_axis 指定輔助軸
- R ggplot2 scale_alpha Alpha 透明度比例
- R ggplot2 scale_colour_continuous 連續色標和分級色標
- R ggplot2 scale_identity 使用不縮放的值
- R ggplot2 scale_linewidth 線寬比例
注:本文由純淨天空篩選整理自Hadley Wickham等大神的英文原創作品 Compute normal data ellipses。非經特殊聲明,原始代碼版權歸原作者所有,本譯文未經允許或授權,請勿轉載或複製。