默認離散色階。默認為scale_fill_hue() /scale_fill_brewer(),除非指定type(默認為ggplot2.discrete.fill /ggplot2.discrete.colour 選項)。
用法
scale_colour_discrete(..., type = getOption("ggplot2.discrete.colour"))

scale_fill_discrete(..., type = getOption("ggplot2.discrete.fill"))
參數
- ...
-
傳遞給比例類型的附加參數,
- type
-
以下之一:
-
顏色代碼的字符向量。隻要代碼的數量超過數據級別的數量,代碼就用於'manual'色標(如果級別多於代碼,則使用
scale_colour_hue()/scale_fill_hue()構建默認標度)。如果這是一個命名向量,則顏色值將根據向量名稱與級別進行匹配。不匹配的數據值將設置為na.value。 -
顏色代碼的字符向量列表。選擇超過數據級別數量的最小長度向量用於顏色縮放。如果您想根據級別數更改調色板,這非常有用。
-
返回離散顏色/填充比例的函數(例如
scale_fill_hue()、scale_fill_brewer()等)。
-
例子
# Template function for creating densities grouped by a variable
cty_by_var <- function(var) {
ggplot(mpg, aes(cty, colour = factor({{var}}), fill = factor({{var}}))) +
geom_density(alpha = 0.2)
}
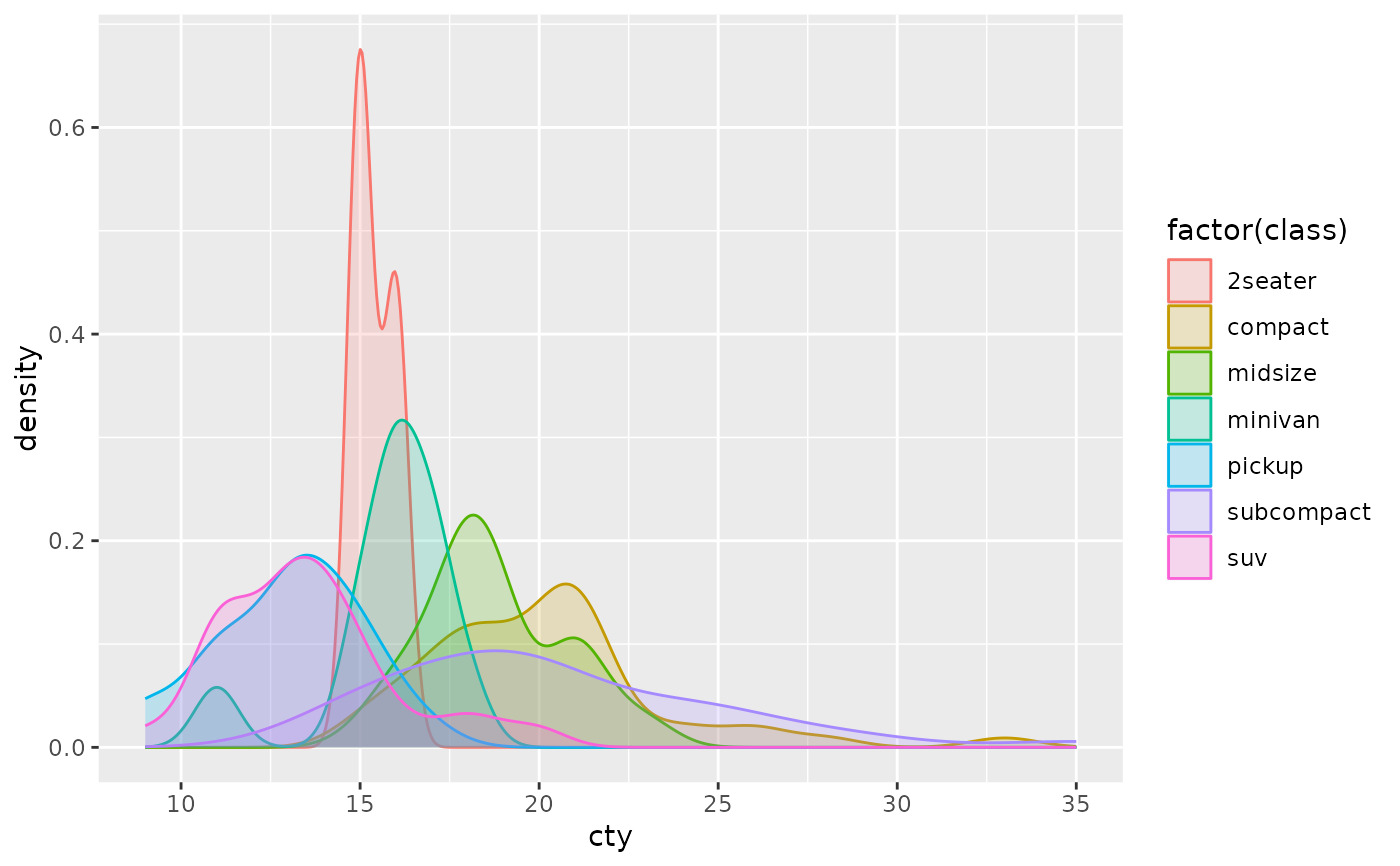
# The default, scale_fill_hue(), is not colour-blind safe
cty_by_var(class)
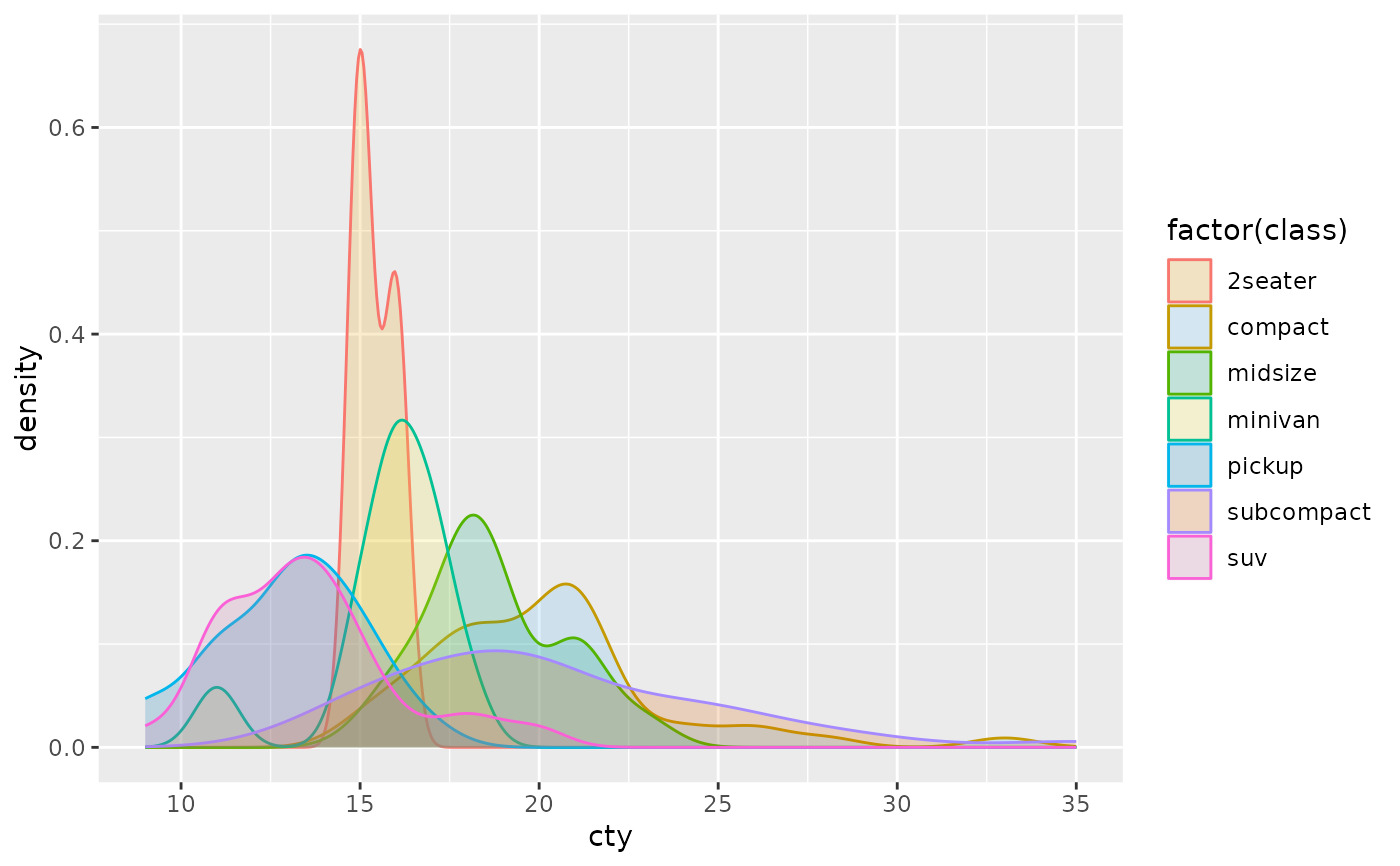
 # (Temporarily) set the default to Okabe-Ito (which is colour-blind safe)
okabe <- c("#E69F00", "#56B4E9", "#009E73", "#F0E442", "#0072B2", "#D55E00", "#CC79A7")
withr::with_options(
list(ggplot2.discrete.fill = okabe),
print(cty_by_var(class))
)
# (Temporarily) set the default to Okabe-Ito (which is colour-blind safe)
okabe <- c("#E69F00", "#56B4E9", "#009E73", "#F0E442", "#0072B2", "#D55E00", "#CC79A7")
withr::with_options(
list(ggplot2.discrete.fill = okabe),
print(cty_by_var(class))
)
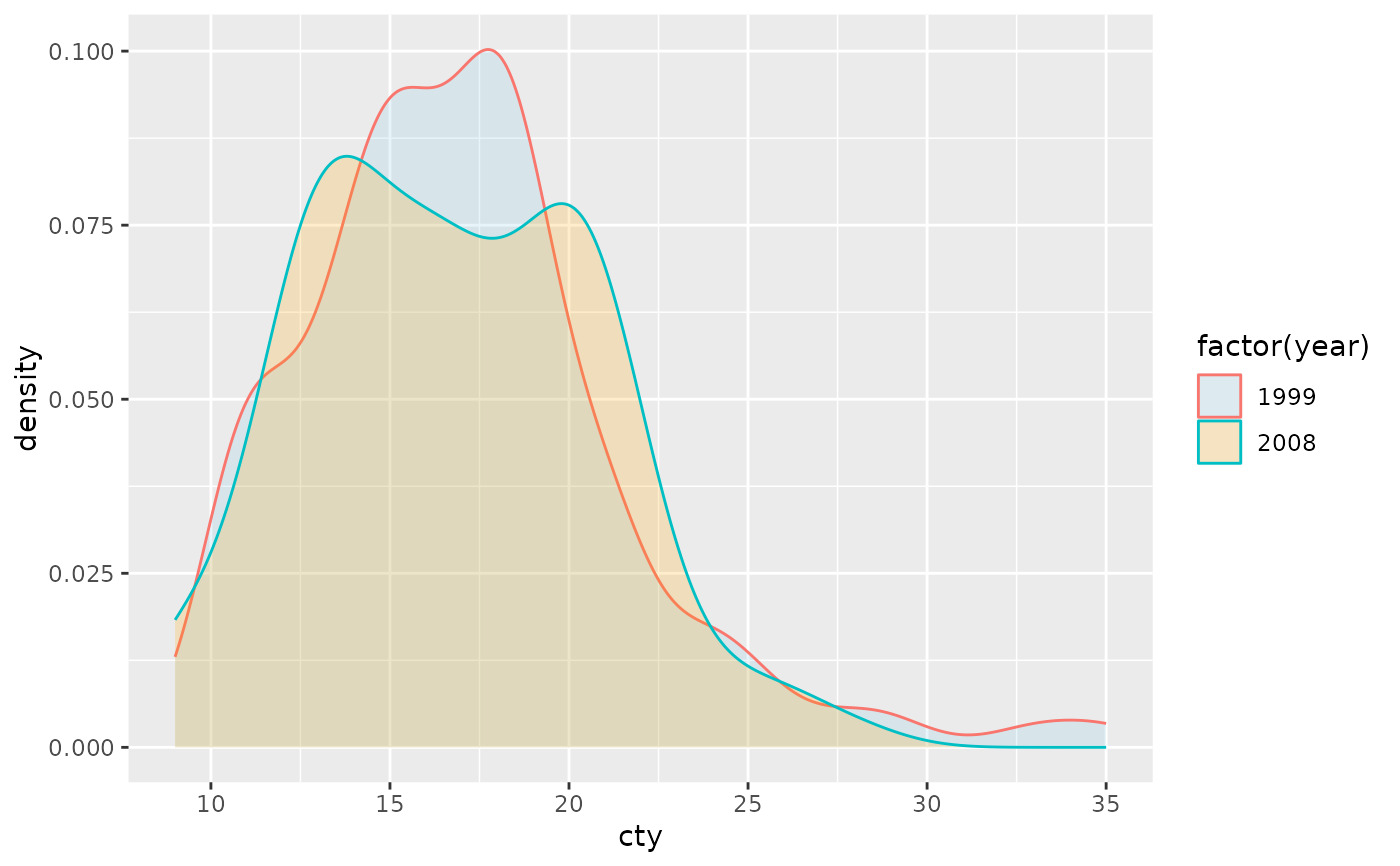
 # Define a collection of palettes to alter the default based on number of levels to encode
discrete_palettes <- list(
c("skyblue", "orange"),
RColorBrewer::brewer.pal(3, "Set2"),
RColorBrewer::brewer.pal(6, "Accent")
)
withr::with_options(
list(ggplot2.discrete.fill = discrete_palettes), {
# 1st palette is used when there 1-2 levels (e.g., year)
print(cty_by_var(year))
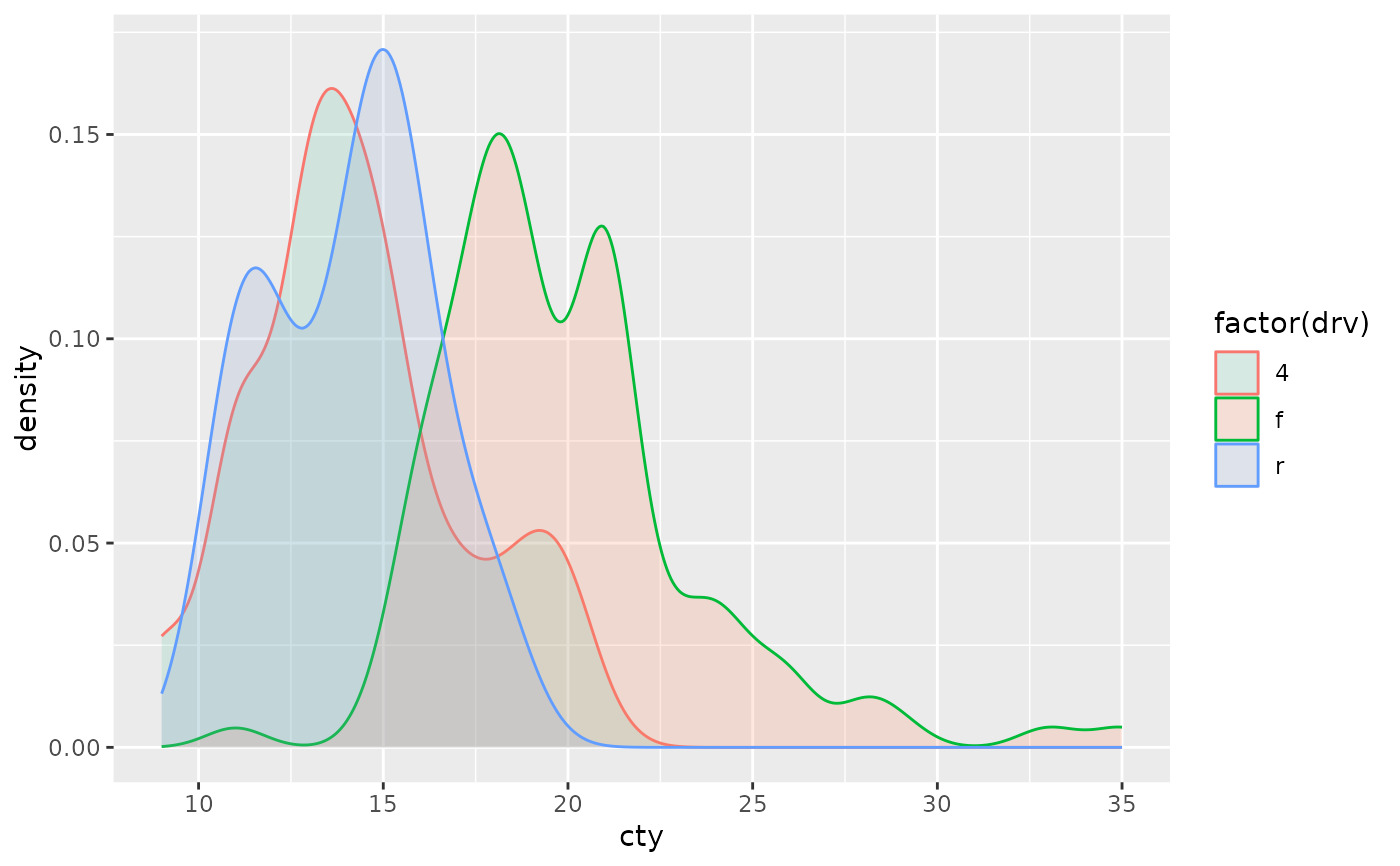
# 2nd palette is used when there are 3 levels
print(cty_by_var(drv))
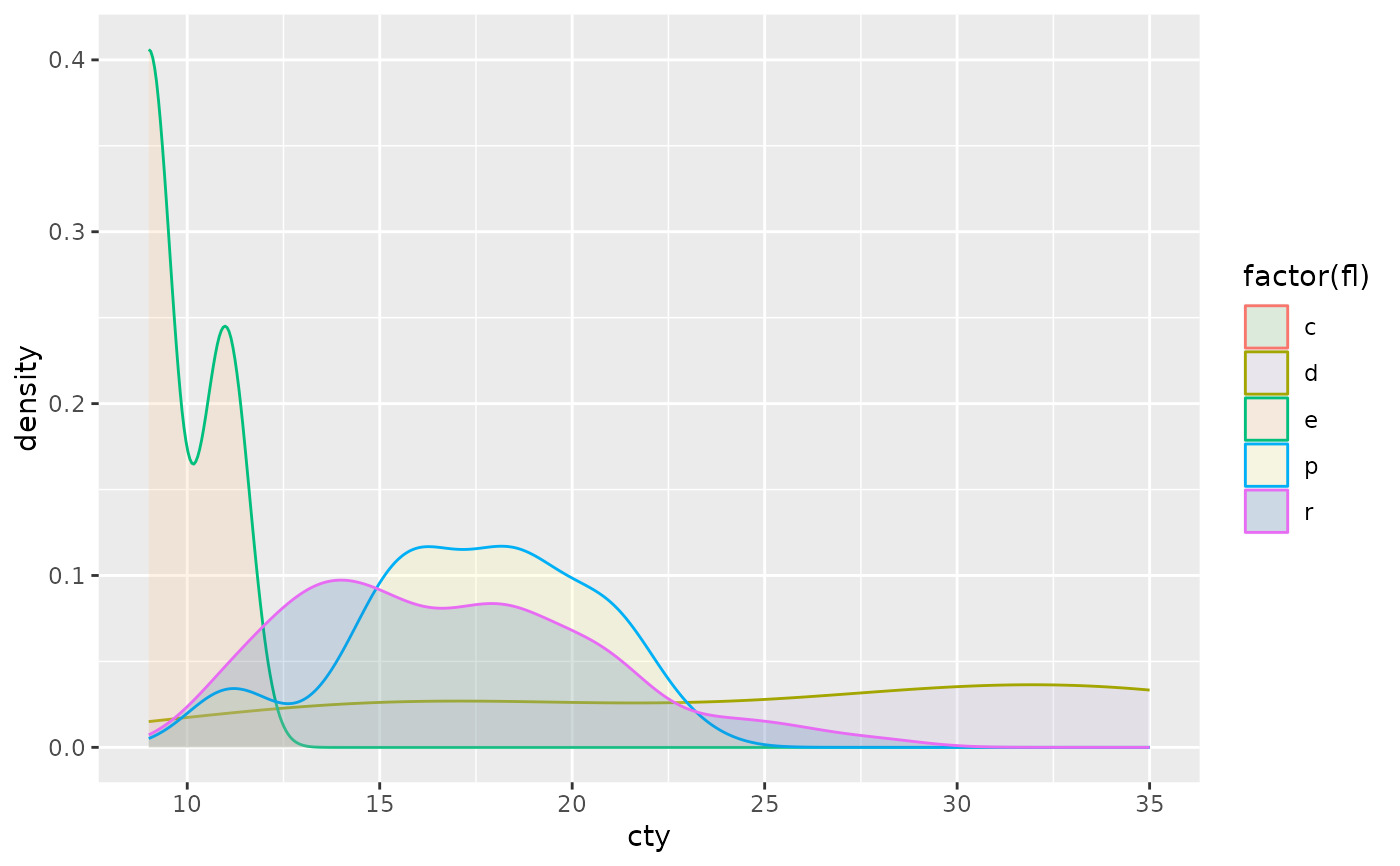
# 3rd palette is used when there are 4-6 levels
print(cty_by_var(fl))
})
# Define a collection of palettes to alter the default based on number of levels to encode
discrete_palettes <- list(
c("skyblue", "orange"),
RColorBrewer::brewer.pal(3, "Set2"),
RColorBrewer::brewer.pal(6, "Accent")
)
withr::with_options(
list(ggplot2.discrete.fill = discrete_palettes), {
# 1st palette is used when there 1-2 levels (e.g., year)
print(cty_by_var(year))
# 2nd palette is used when there are 3 levels
print(cty_by_var(drv))
# 3rd palette is used when there are 4-6 levels
print(cty_by_var(fl))
})
 #> Warning: Groups with fewer than two data points have been dropped.
#> Warning: no non-missing arguments to max; returning -Inf
#> Warning: Groups with fewer than two data points have been dropped.
#> Warning: no non-missing arguments to max; returning -Inf
相關用法
- R ggplot2 scale_colour_continuous 連續色標和分級色標
- R ggplot2 scale_continuous 連續數據的位置比例(x 和 y)
- R ggplot2 scale_gradient 漸變色階
- R ggplot2 scale_shape 形狀比例,又稱字形
- R ggplot2 scale_viridis 來自 viridisLite 的 Viridis 色標
- R ggplot2 scale_grey 連續灰度色階
- R ggplot2 scale_linetype 線條圖案的比例
- R ggplot2 scale_discrete 離散數據的位置尺度
- R ggplot2 scale_manual 創建您自己的離散尺度
- R ggplot2 scale_steps 分級漸變色標
- R ggplot2 scale_size 麵積或半徑比例
- R ggplot2 scale_date 日期/時間數據的位置刻度
- R ggplot2 scale_binned 用於對連續數據進行裝箱的位置比例(x 和 y)
- R ggplot2 scale_alpha Alpha 透明度比例
- R ggplot2 scale_identity 使用不縮放的值
- R ggplot2 scale_linewidth 線寬比例
- R ggplot2 scale_hue 離散數據的均勻間隔顏色
- R ggplot2 scale_brewer ColorBrewer 的連續、發散和定性色標
- R ggplot2 stat_ellipse 計算法行數據橢圓
- R ggplot2 stat_identity 保留數據原樣
- R ggplot2 stat_summary_2d 以二維形式進行分類和匯總(矩形和六邊形)
- R ggplot2 should_stop 在示例中用於說明何時應該發生錯誤。
- R ggplot2 stat_summary 總結唯一/分箱 x 處的 y 值
- R ggplot2 stat_sf_coordinates 從“sf”對象中提取坐標
- R ggplot2 stat_unique 刪除重複項
注:本文由純淨天空篩選整理自Hadley Wickham等大神的英文原創作品 Discrete colour scales。非經特殊聲明,原始代碼版權歸原作者所有,本譯文未經允許或授權,請勿轉載或複製。