scale_x_discrete() 和 scale_y_discrete() 用於設置離散 x 和 y 尺度美觀的值。為了簡單地操作刻度標簽和限製,您可能希望使用labs() 和lims() 代替。
用法
scale_x_discrete(..., expand = waiver(), guide = waiver(), position = "bottom")

scale_y_discrete(..., expand = waiver(), guide = waiver(), position = "left")
參數
- ...
-
參數傳遞給
discrete_scalepalette-
調色板函數,當使用單個整數參數(比例中的級別數)調用時,返回它們應采用的值(例如
scales::hue_pal())。 breaks-
之一:
limits-
之一:
-
NULL使用默認比例值 -
定義可能的比例值及其順序的字符向量
-
接受現有(自動)值並返回新值的函數。還接受 rlang lambda 函數表示法。
-
drop-
是否應該從量表中省略未使用的因子水平?默認值
TRUE使用數據中出現的級別;FALSE使用因子中的所有級別。 na.translate-
與連續尺度不同,離散尺度可以輕鬆顯示缺失值,並且默認情況下會這樣做。如果要從離散尺度中刪除缺失值,請指定
na.translate = FALSE。 na.value-
如果
na.translate = TRUE,缺失值應該顯示為什麽美學值?不適用於NA始終位於最右側的位置比例。 aesthetics-
該量表所適用的美學名稱。
scale_name-
應用於與該比例關聯的錯誤消息的比例名稱。
name-
秤的名稱。用作軸或圖例標題。如果
waiver()(默認值),則比例名稱取自用於該美學的第一個映射。如果是NULL,則圖例標題將被省略。 labels-
之一:
super-
用於構造比例的超類
- expand
-
對於位置刻度,範圍擴展常量的向量,用於在數據周圍添加一些填充,以確保它們放置在距軸一定距離的位置。使用便捷函數
expansion()生成expand參數的值。默認情況下,對於連續變量,每側擴展 5%,對於離散變量,每側擴展 0.6 個單位。 - guide
-
用於創建指南或其名稱的函數。有關詳細信息,請參閱
guides()。 - position
-
對於位置刻度,軸的位置。
left或right表示 y 軸,top或bottom表示 x 軸。
細節
即使使用離散位置刻度,您也可以使用連續位置 - 這允許您(例如)在條形圖中的條形之間放置標簽。連續位置是數字值,第一級從 1 開始,每個級別增加 1(即標簽放置在整數位置)。這就是抖動發揮作用的原因。
也可以看看
其他位置刻度:scale_x_binned()、scale_x_continuous()、scale_x_date()
例子
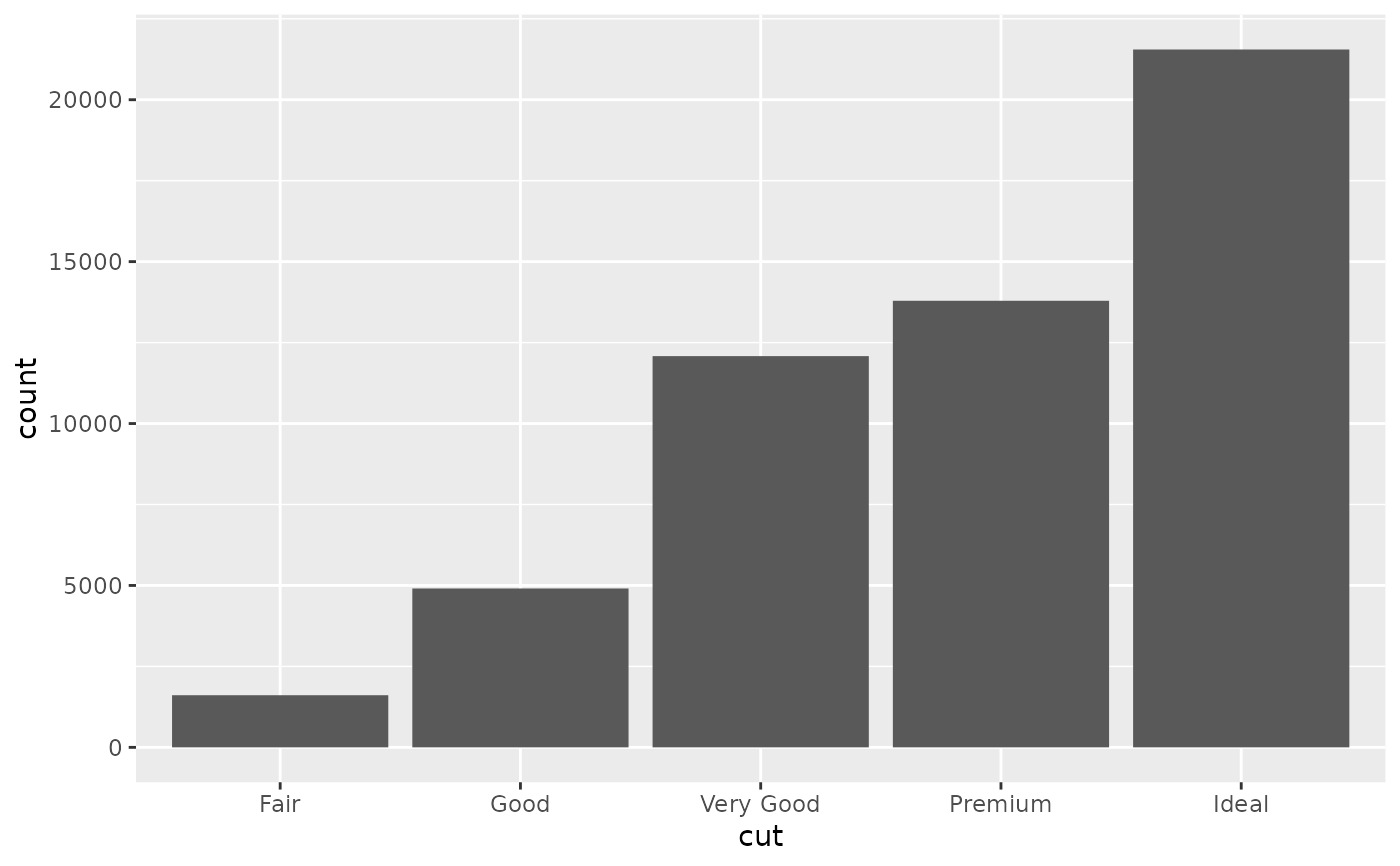
ggplot(diamonds, aes(cut)) + geom_bar()
 # \donttest{
# The discrete position scale is added automatically whenever you
# have a discrete position.
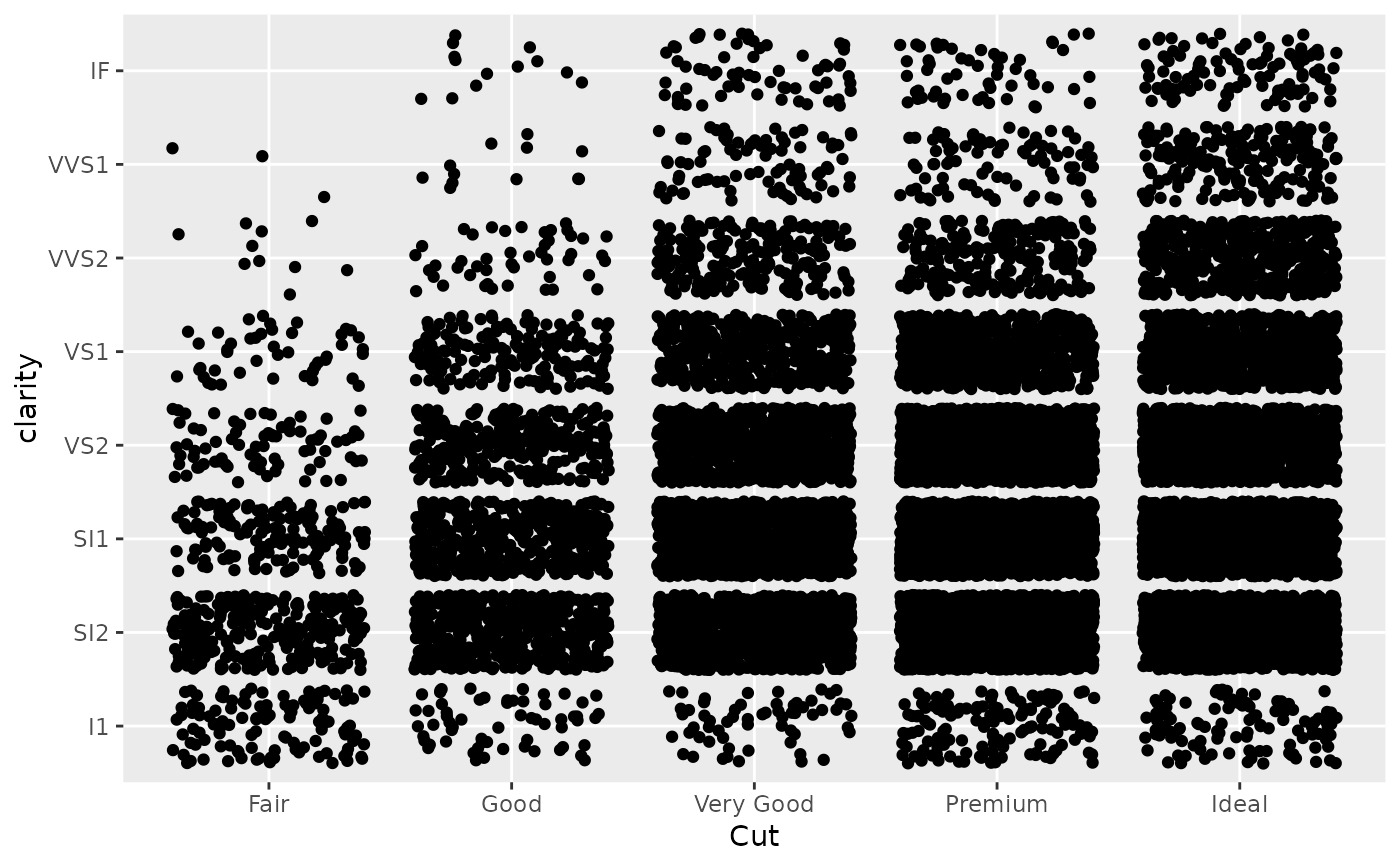
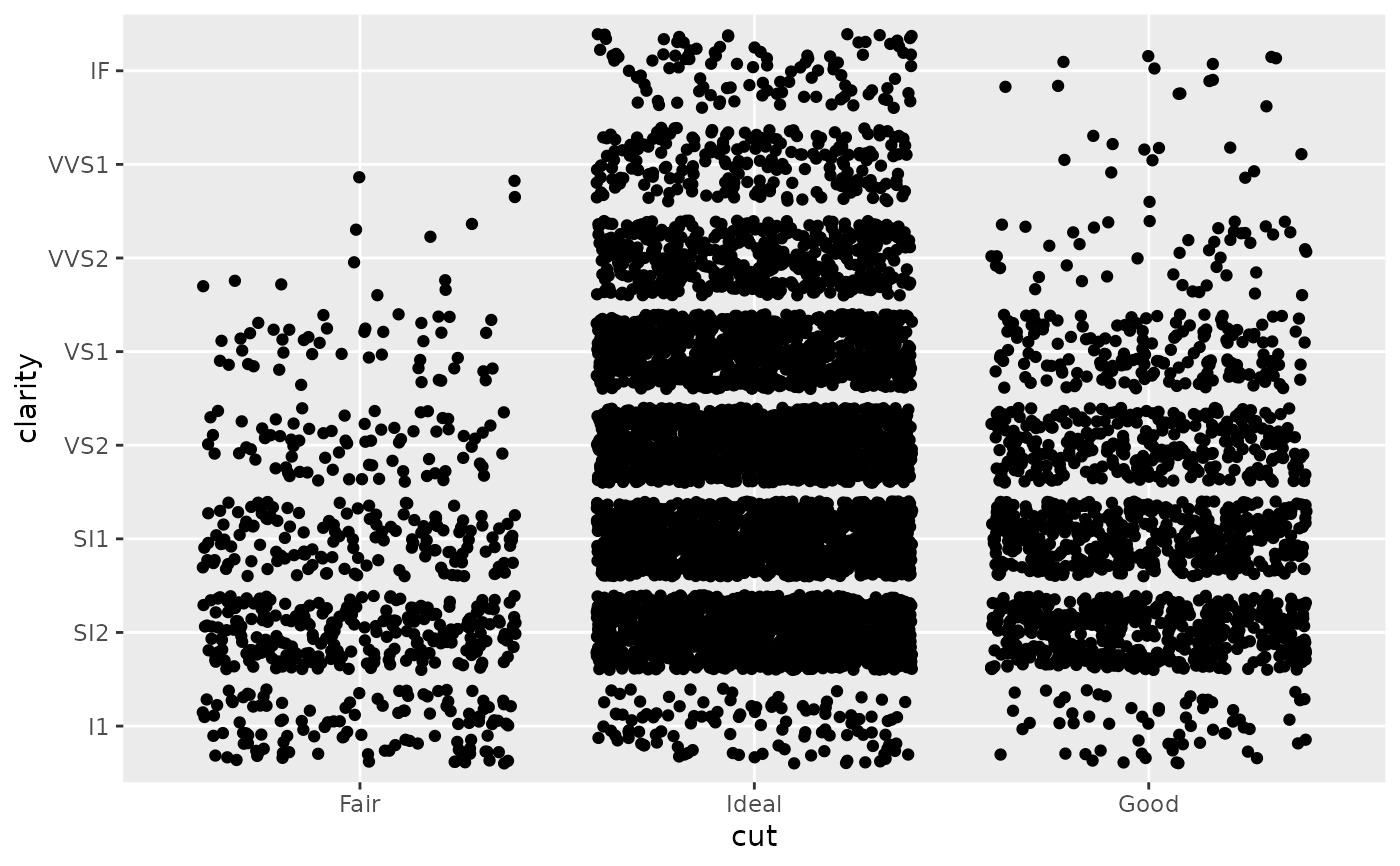
(d <- ggplot(subset(diamonds, carat > 1), aes(cut, clarity)) +
geom_jitter())
# \donttest{
# The discrete position scale is added automatically whenever you
# have a discrete position.
(d <- ggplot(subset(diamonds, carat > 1), aes(cut, clarity)) +
geom_jitter())
 d + scale_x_discrete("Cut")
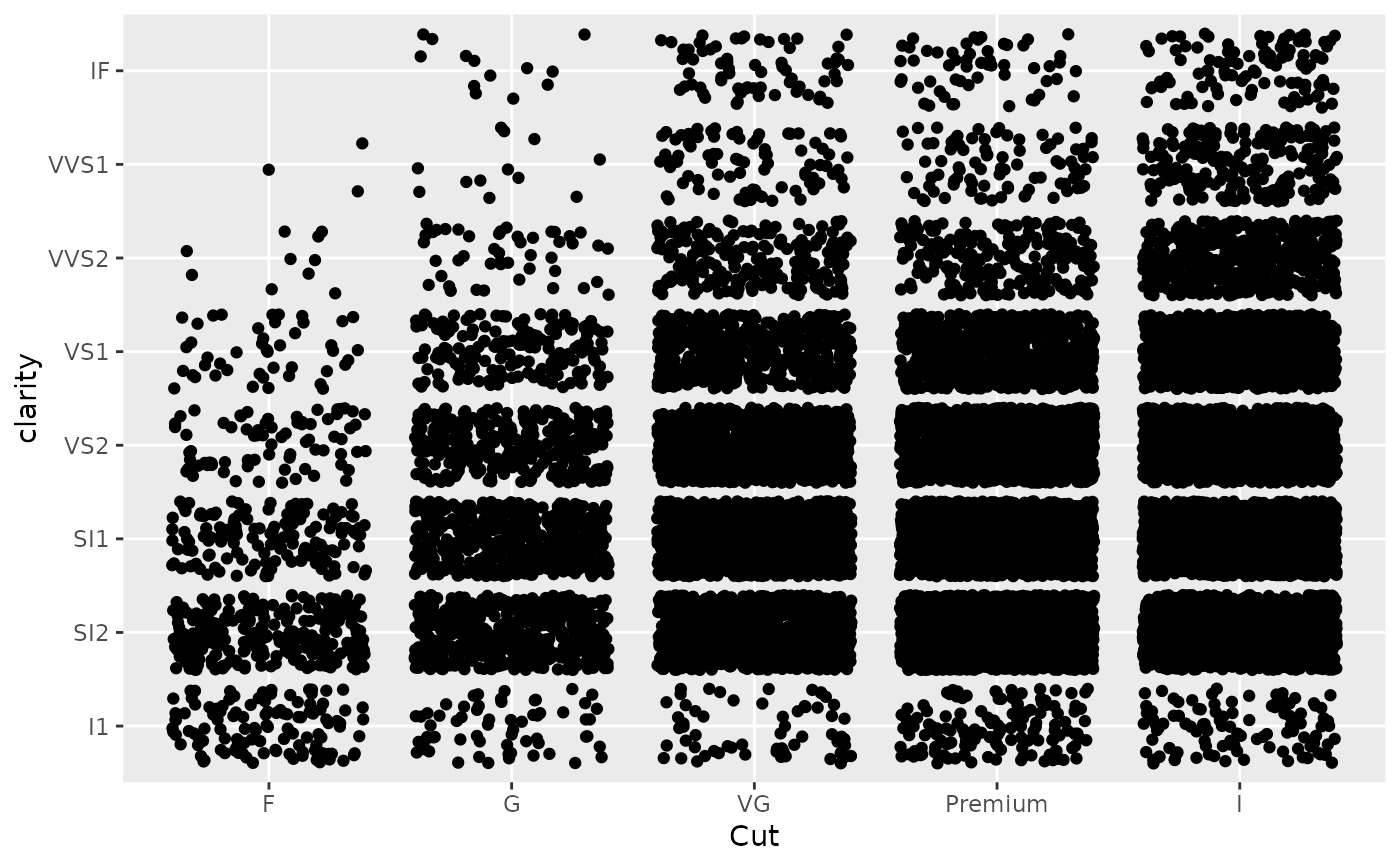
 d +
scale_x_discrete(
"Cut",
labels = c(
"Fair" = "F",
"Good" = "G",
"Very Good" = "VG",
"Perfect" = "P",
"Ideal" = "I"
)
)
d +
scale_x_discrete(
"Cut",
labels = c(
"Fair" = "F",
"Good" = "G",
"Very Good" = "VG",
"Perfect" = "P",
"Ideal" = "I"
)
)
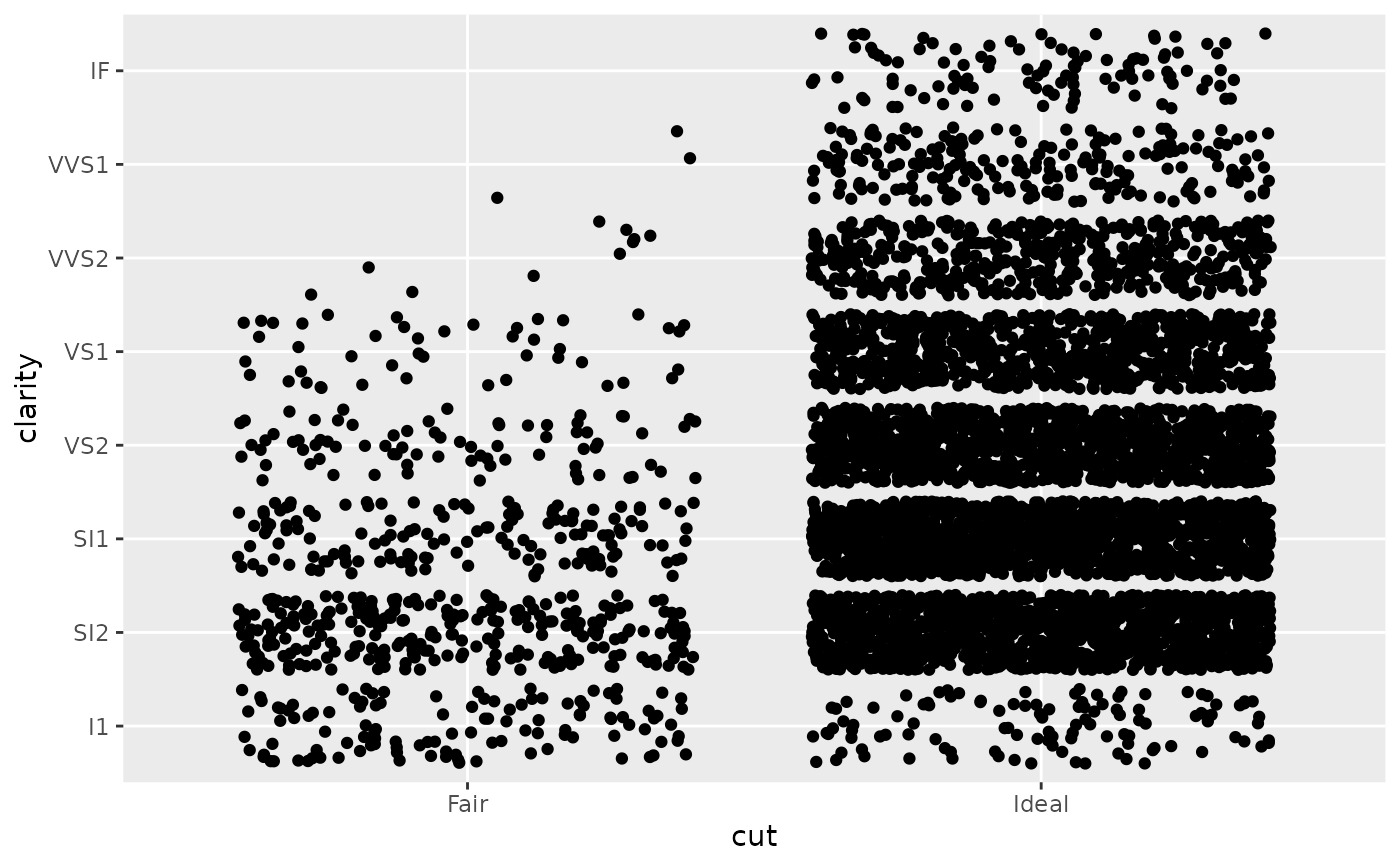
 # Use limits to adjust the which levels (and in what order)
# are displayed
d + scale_x_discrete(limits = c("Fair","Ideal"))
#> Warning: Removed 11189 rows containing missing values (`geom_point()`).
# Use limits to adjust the which levels (and in what order)
# are displayed
d + scale_x_discrete(limits = c("Fair","Ideal"))
#> Warning: Removed 11189 rows containing missing values (`geom_point()`).
 # you can also use the short hand functions xlim and ylim
d + xlim("Fair","Ideal", "Good")
#> Warning: Removed 9610 rows containing missing values (`geom_point()`).
# you can also use the short hand functions xlim and ylim
d + xlim("Fair","Ideal", "Good")
#> Warning: Removed 9610 rows containing missing values (`geom_point()`).
 d + ylim("I1", "IF")
#> Warning: Removed 16770 rows containing missing values (`geom_point()`).
d + ylim("I1", "IF")
#> Warning: Removed 16770 rows containing missing values (`geom_point()`).
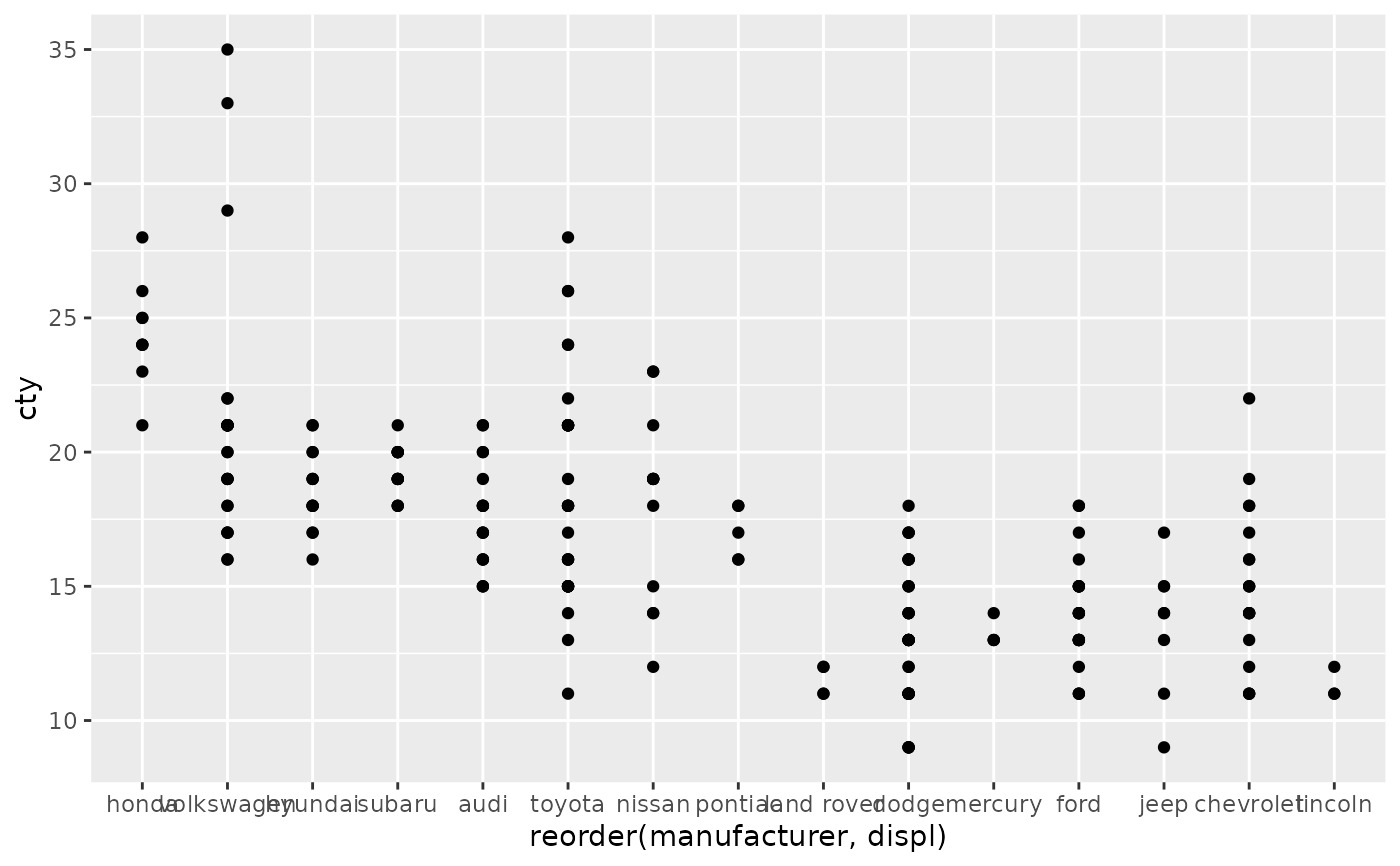
 # See ?reorder to reorder based on the values of another variable
ggplot(mpg, aes(manufacturer, cty)) +
geom_point()
# See ?reorder to reorder based on the values of another variable
ggplot(mpg, aes(manufacturer, cty)) +
geom_point()
 ggplot(mpg, aes(reorder(manufacturer, cty), cty)) +
geom_point()
ggplot(mpg, aes(reorder(manufacturer, cty), cty)) +
geom_point()
 ggplot(mpg, aes(reorder(manufacturer, displ), cty)) +
geom_point()
ggplot(mpg, aes(reorder(manufacturer, displ), cty)) +
geom_point()
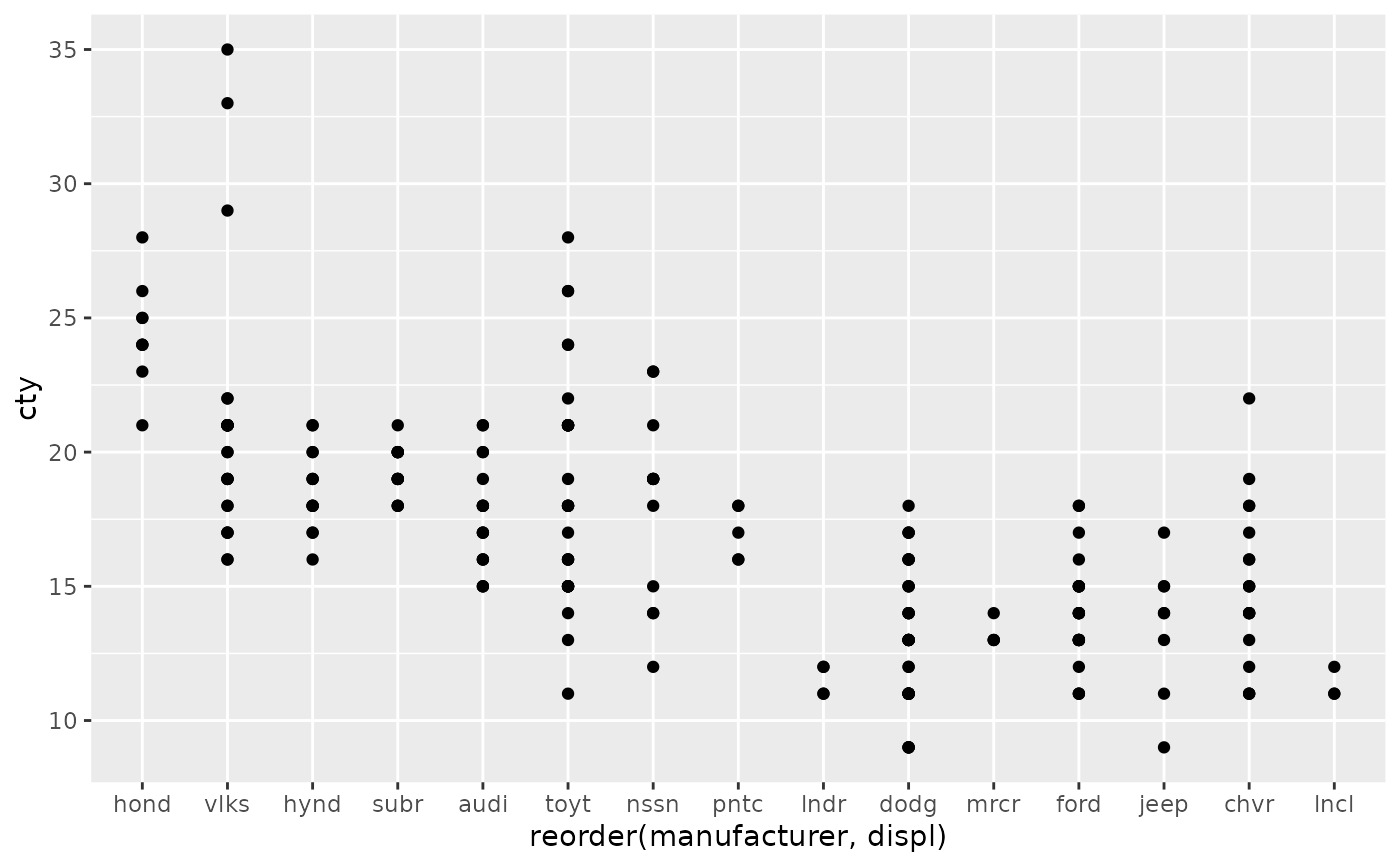
 # Use abbreviate as a formatter to reduce long names
ggplot(mpg, aes(reorder(manufacturer, displ), cty)) +
geom_point() +
scale_x_discrete(labels = abbreviate)
# Use abbreviate as a formatter to reduce long names
ggplot(mpg, aes(reorder(manufacturer, displ), cty)) +
geom_point() +
scale_x_discrete(labels = abbreviate)
 # }
# }
相關用法
- R ggplot2 scale_date 日期/時間數據的位置刻度
- R ggplot2 scale_gradient 漸變色階
- R ggplot2 scale_shape 形狀比例,又稱字形
- R ggplot2 scale_viridis 來自 viridisLite 的 Viridis 色標
- R ggplot2 scale_grey 連續灰度色階
- R ggplot2 scale_linetype 線條圖案的比例
- R ggplot2 scale_manual 創建您自己的離散尺度
- R ggplot2 scale_colour_discrete 離散色階
- R ggplot2 scale_steps 分級漸變色標
- R ggplot2 scale_size 麵積或半徑比例
- R ggplot2 scale_continuous 連續數據的位置比例(x 和 y)
- R ggplot2 scale_binned 用於對連續數據進行裝箱的位置比例(x 和 y)
- R ggplot2 scale_alpha Alpha 透明度比例
- R ggplot2 scale_colour_continuous 連續色標和分級色標
- R ggplot2 scale_identity 使用不縮放的值
- R ggplot2 scale_linewidth 線寬比例
- R ggplot2 scale_hue 離散數據的均勻間隔顏色
- R ggplot2 scale_brewer ColorBrewer 的連續、發散和定性色標
- R ggplot2 stat_ellipse 計算法行數據橢圓
- R ggplot2 stat_identity 保留數據原樣
- R ggplot2 stat_summary_2d 以二維形式進行分類和匯總(矩形和六邊形)
- R ggplot2 should_stop 在示例中用於說明何時應該發生錯誤。
- R ggplot2 stat_summary 總結唯一/分箱 x 處的 y 值
- R ggplot2 stat_sf_coordinates 從“sf”對象中提取坐標
- R ggplot2 stat_unique 刪除重複項
注:本文由純淨天空篩選整理自Hadley Wickham等大神的英文原創作品 Position scales for discrete data。非經特殊聲明,原始代碼版權歸原作者所有,本譯文未經允許或授權,請勿轉載或複製。