好的標簽對於讓更廣泛的受眾能夠理解您的情節至關重要。始終確保軸和圖例標簽顯示完整的變量名稱。使用圖 title 和 subtitle 來解釋主要發現。通常使用caption 來提供有關數據源的信息。 tag 可用於添加識別標簽以區分多個圖。
用法
labs(
  ...,
  title = waiver(),
  subtitle = waiver(),
  caption = waiver(),
  tag = waiver(),
  alt = waiver(),
  alt_insight = waiver()
)

xlab(label)

ylab(label)

ggtitle(label, subtitle = waiver())
參數
- ...
-
新name-value 對的列表。名字應該是有美感的。
- title
-
標題的文字。
- subtitle
-
繪圖副標題的文本將顯示在標題下方。
- caption
-
默認情況下,標題文本將顯示在繪圖的右下角。
- tag
-
默認情況下,標簽標簽的文本將顯示在繪圖的左上角。
- alt, alt_insight
-
用於生成繪圖alt-text 的文本。有關示例,請參閱get_alt_text。
- label
-
相應軸的標題(對於
xlab()或ylab())或繪圖的標題(對於ggtitle())。
細節
您還可以在各個比例中設置軸和圖例標簽(使用第一個參數 name )。如果您要更改其他比例選項,建議這樣做。
如果繪圖已有標題、副標題、說明文字等,並且您想將其刪除,則可以通過將相應參數設置為 NULL 來實現。例如,如果圖 p 有副標題,則 p + labs(subtitle = NULL) 將從圖中刪除副標題。
例子
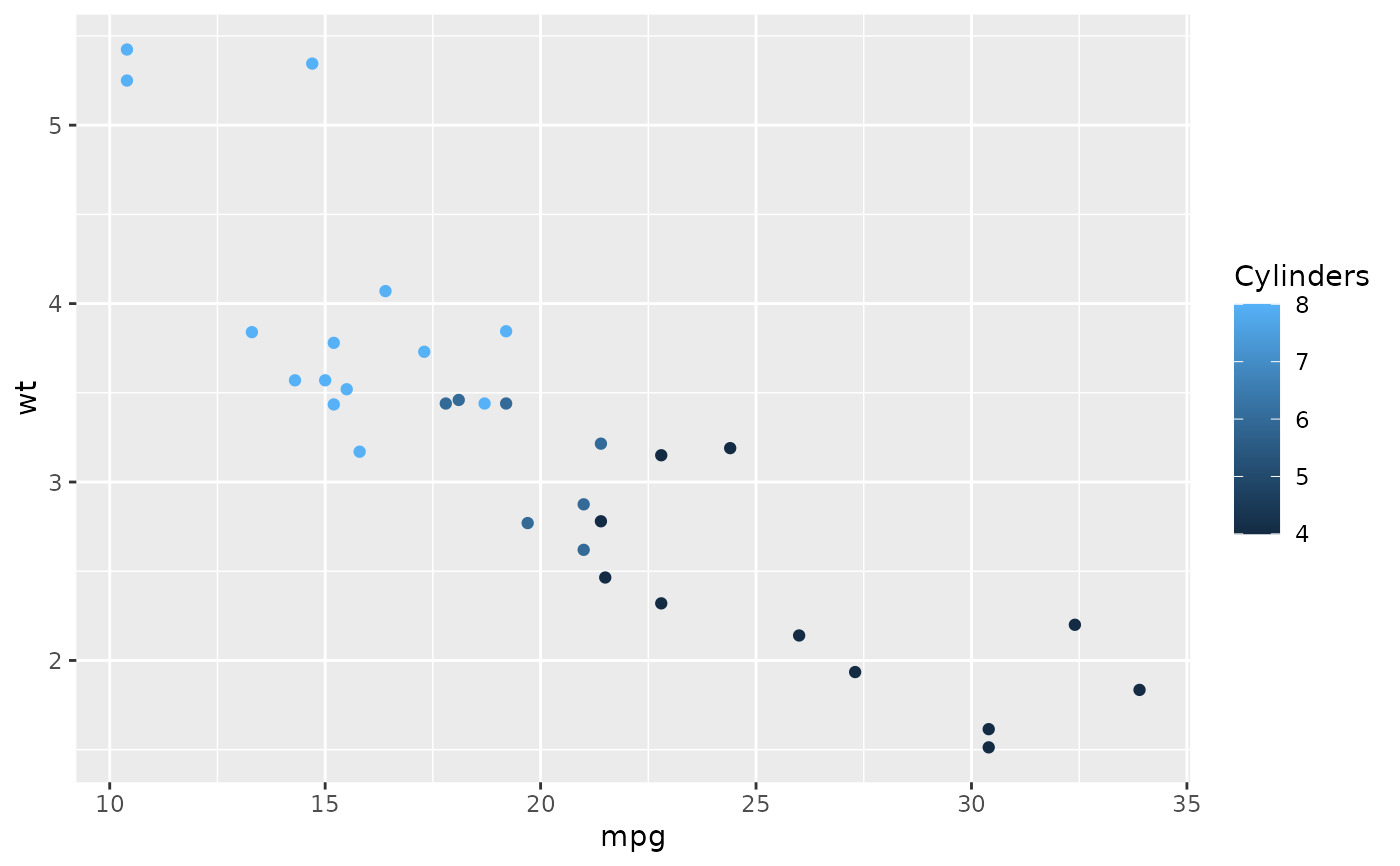
p <- ggplot(mtcars, aes(mpg, wt, colour = cyl)) + geom_point()
p + labs(colour = "Cylinders")
 p + labs(x = "New x label")
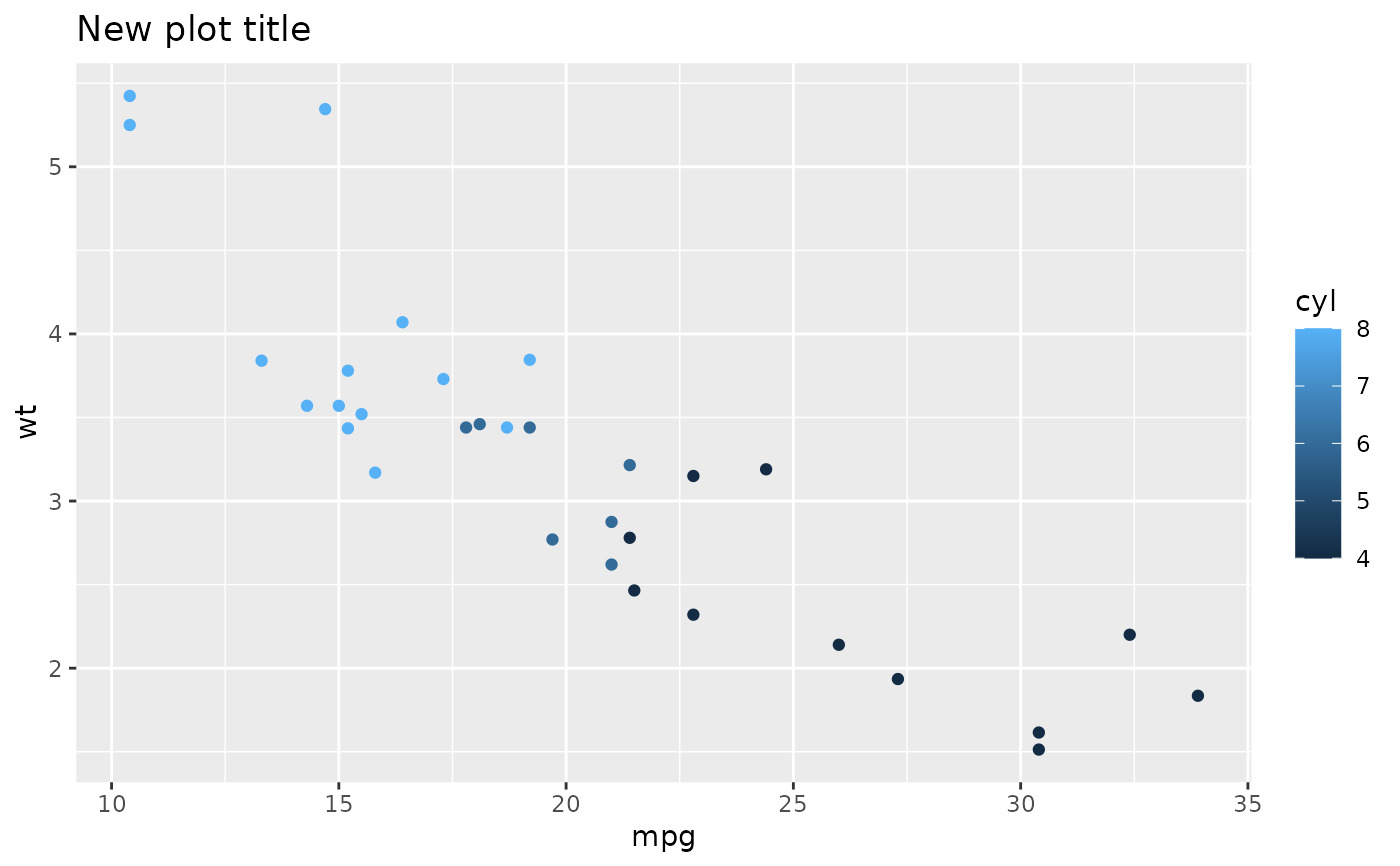
 # The plot title appears at the top-left, with the subtitle
# display in smaller text underneath it
p + labs(title = "New plot title")
# The plot title appears at the top-left, with the subtitle
# display in smaller text underneath it
p + labs(title = "New plot title")
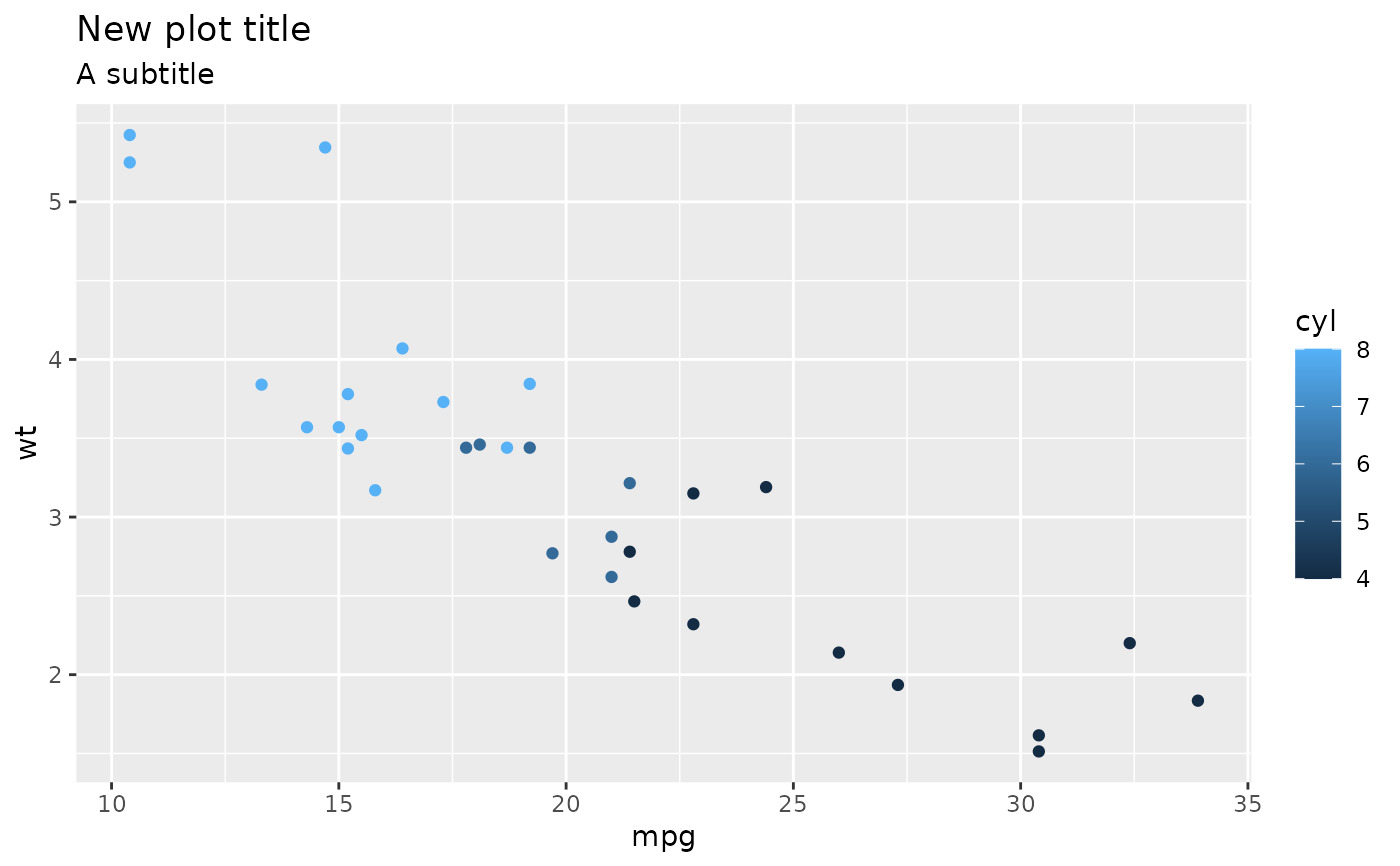
 p + labs(title = "New plot title", subtitle = "A subtitle")
 # The caption appears in the bottom-right, and is often used for
# sources, notes or copyright
p + labs(caption = "(based on data from ...)")
# The caption appears in the bottom-right, and is often used for
# sources, notes or copyright
p + labs(caption = "(based on data from ...)")
 # The plot tag appears at the top-left, and is typically used
# for labelling a subplot with a letter.
p + labs(title = "title", tag = "A")
# The plot tag appears at the top-left, and is typically used
# for labelling a subplot with a letter.
p + labs(title = "title", tag = "A")
 # If you want to remove a label, set it to NULL.
p +
labs(title = "title") +
labs(title = NULL)
# If you want to remove a label, set it to NULL.
p +
labs(title = "title") +
labs(title = NULL)

相關用法
- R ggplot2 label_bquote 帶有數學表達式的標簽
- R ggplot2 labeller 構建標簽規範
- R ggplot2 labellers 有用的貼標機函數
- R ggplot2 layer 創建一個新層
- R ggplot2 lims 設置規模限製
- R ggplot2 annotation_logticks 注釋:記錄刻度線
- R ggplot2 vars 引用分麵變量
- R ggplot2 position_stack 將重疊的對象堆疊在一起
- R ggplot2 geom_qq 分位數-分位數圖
- R ggplot2 geom_spoke 由位置、方向和距離參數化的線段
- R ggplot2 geom_quantile 分位數回歸
- R ggplot2 geom_text 文本
- R ggplot2 get_alt_text 從繪圖中提取替代文本
- R ggplot2 annotation_custom 注釋:自定義grob
- R ggplot2 geom_ribbon 函數區和麵積圖
- R ggplot2 stat_ellipse 計算法行數據橢圓
- R ggplot2 resolution 計算數值向量的“分辨率”
- R ggplot2 geom_boxplot 盒須圖(Tukey 風格)
- R ggplot2 geom_hex 二維箱計數的六邊形熱圖
- R ggplot2 scale_gradient 漸變色階
- R ggplot2 scale_shape 形狀比例,又稱字形
- R ggplot2 geom_bar 條形圖
- R ggplot2 draw_key 圖例的關鍵字形
- R ggplot2 annotate 創建注釋層
- R ggplot2 annotation_map 注釋:Map
注:本文由純淨天空篩選整理自Hadley Wickham等大神的英文原創作品 Modify axis, legend, and plot labels。非經特殊聲明,原始代碼版權歸原作者所有,本譯文未經允許或授權,請勿轉載或複製。