此函數可以輕鬆地將不同的貼標機分配給不同的因子。貼標器可以是一個函數,也可以是用作查找表的命名字符向量。
用法
labeller(
  ...,
  .rows = NULL,
  .cols = NULL,
  keep.as.numeric = deprecated(),
  .multi_line = TRUE,
  .default = label_value
)
參數
- ...
-
形式為
variable = labeller的命名參數。每個標簽器都會傳遞給as_labeller(),並且可以是查找表、獲取和返回字符向量的函數,或者隻是一個標簽器函數。 - .rows, .cols
-
整個邊距(行或列)的貼標機。它被傳遞給
as_labeller()。設置 margin-wide 貼標機時,請確保不要在...中提及屬於邊距的任何變量。 - keep.as.numeric
-
所有提供的標簽器和on-labeller函數應該能夠使用字符標簽。
- .multi_line
-
是否在單獨的行上顯示多個因子的標簽。這被傳遞給貼標器函數。
- .default
-
未指定變量的默認標簽器。也可與查找表或非標簽函數一起使用。
細節
對於函數,如果貼標器具有類 labeller ,則它會直接應用於標簽的 DataFrame 。否則,它將應用於標簽 DataFrame 的列。然後使用 .default 參數中指定的函數處理數據幀。這旨在與采用字符向量的函數一起使用,例如 Hmisc::capitalize() 。
例子
# \donttest{
p1 <- ggplot(mtcars, aes(x = mpg, y = wt)) + geom_point()

# You can assign different labellers to variables:
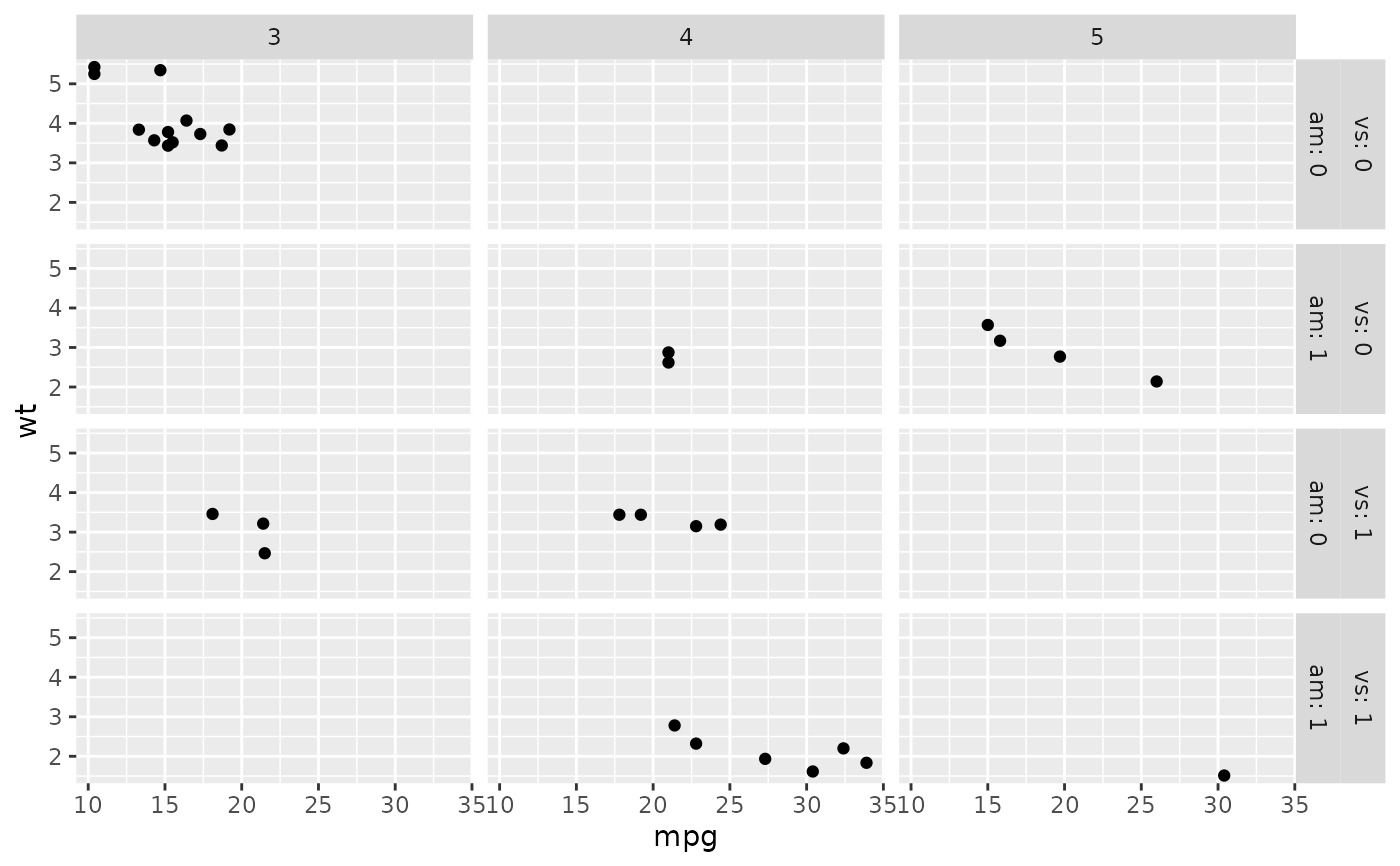
p1 + facet_grid(
  vs + am ~ gear,
  labeller = labeller(vs = label_both, am = label_value)
)


# Or whole margins:
p1 + facet_grid(
  vs + am ~ gear,
  labeller = labeller(.rows = label_both, .cols = label_value)
)


# You can supply functions operating on strings:
capitalize <- function(string) {
  substr(string, 1, 1) <- toupper(substr(string, 1, 1))
  string
}
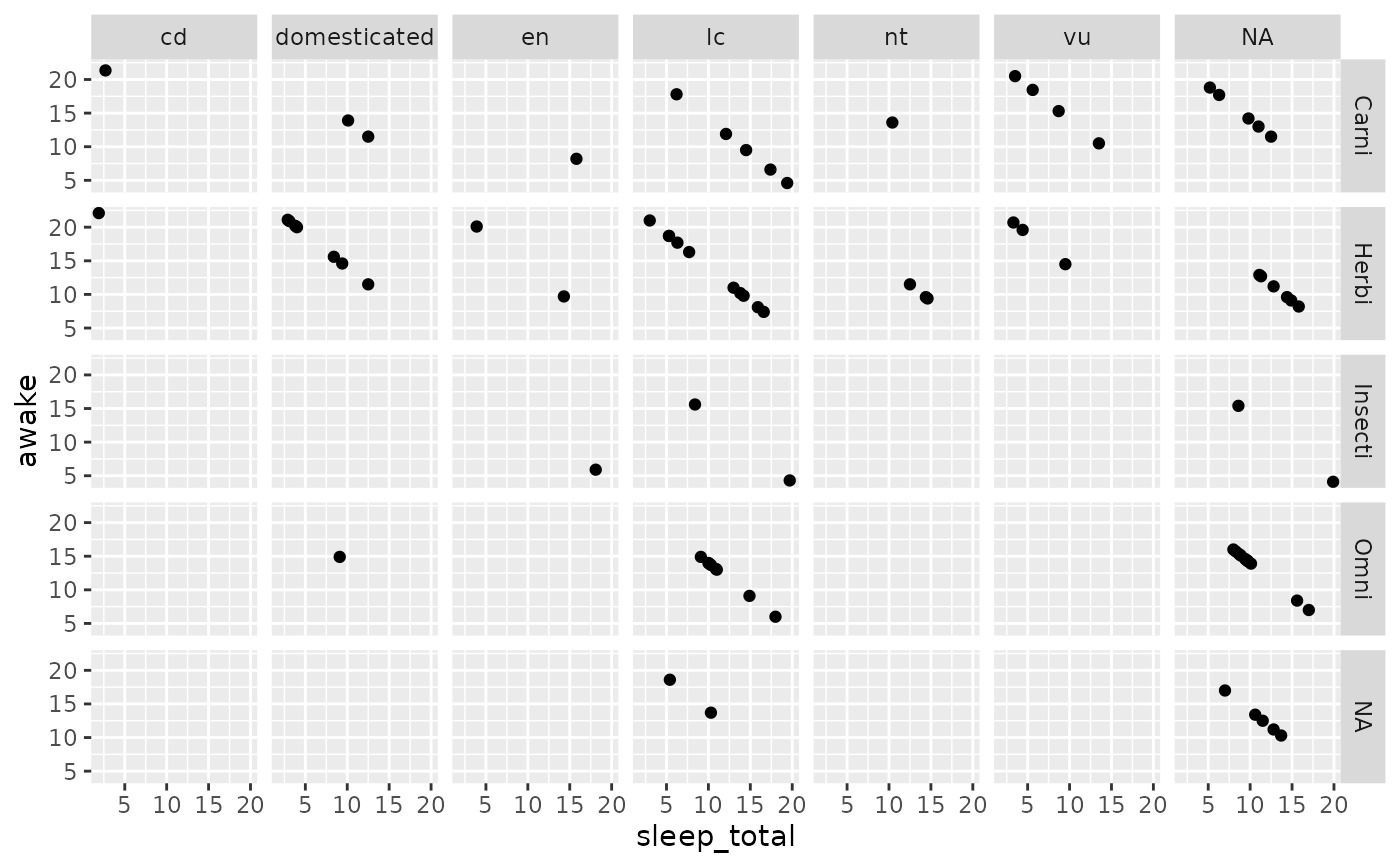
p2 <- ggplot(msleep, aes(x = sleep_total, y = awake)) + geom_point()
p2 + facet_grid(vore ~ conservation, labeller = labeller(vore = capitalize))


# Or use character vectors as lookup tables:
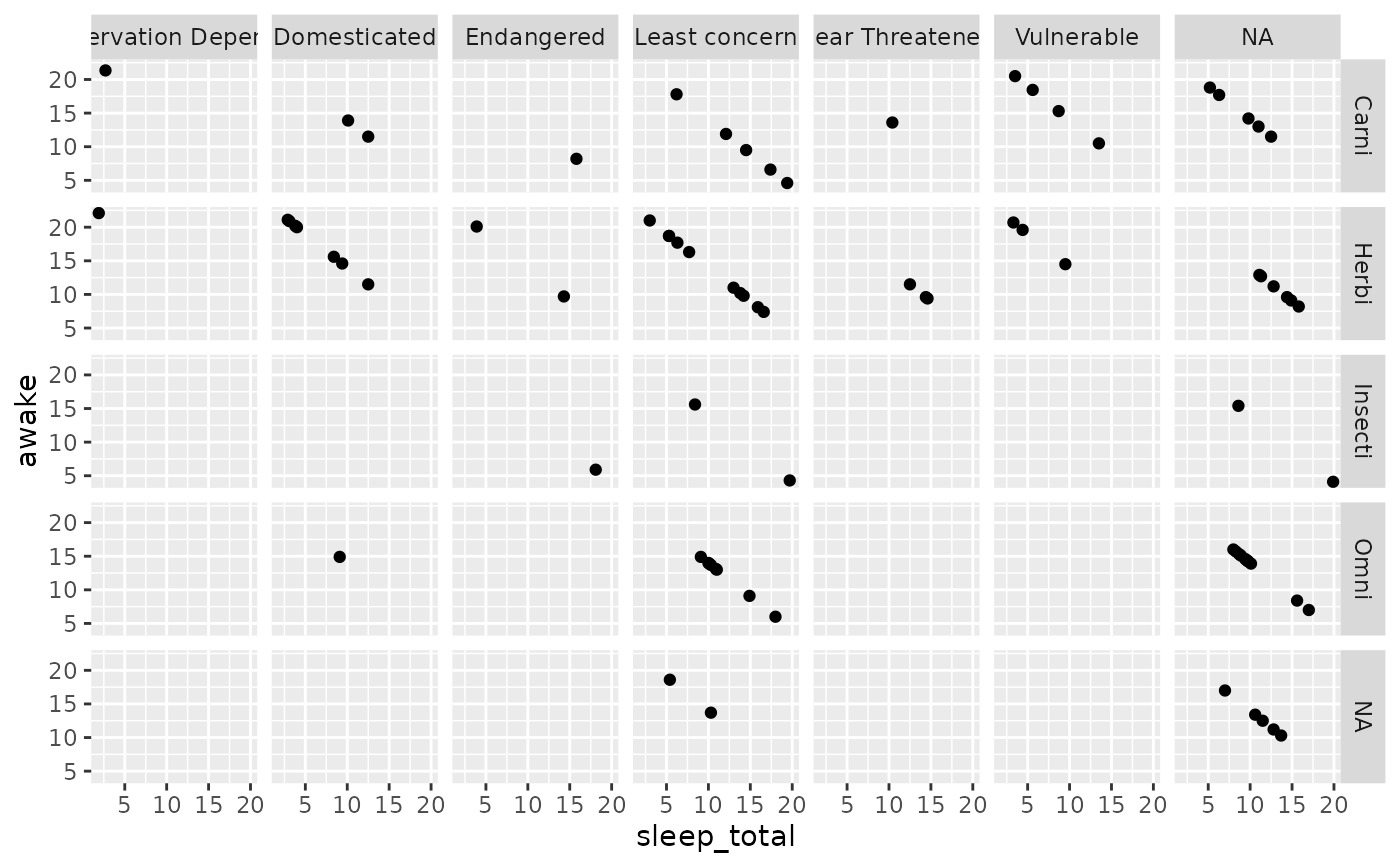
conservation_status <- c(
  cd = "Conservation Dependent",
  en = "Endangered",
  lc = "Least concern",
  nt = "Near Threatened",
  vu = "Vulnerable",
  domesticated = "Domesticated"
)
## Source: http://en.wikipedia.org/wiki/Wikipedia:Conservation_status

p2 + facet_grid(vore ~ conservation, labeller = labeller(
  .default = capitalize,
  conservation = conservation_status
))


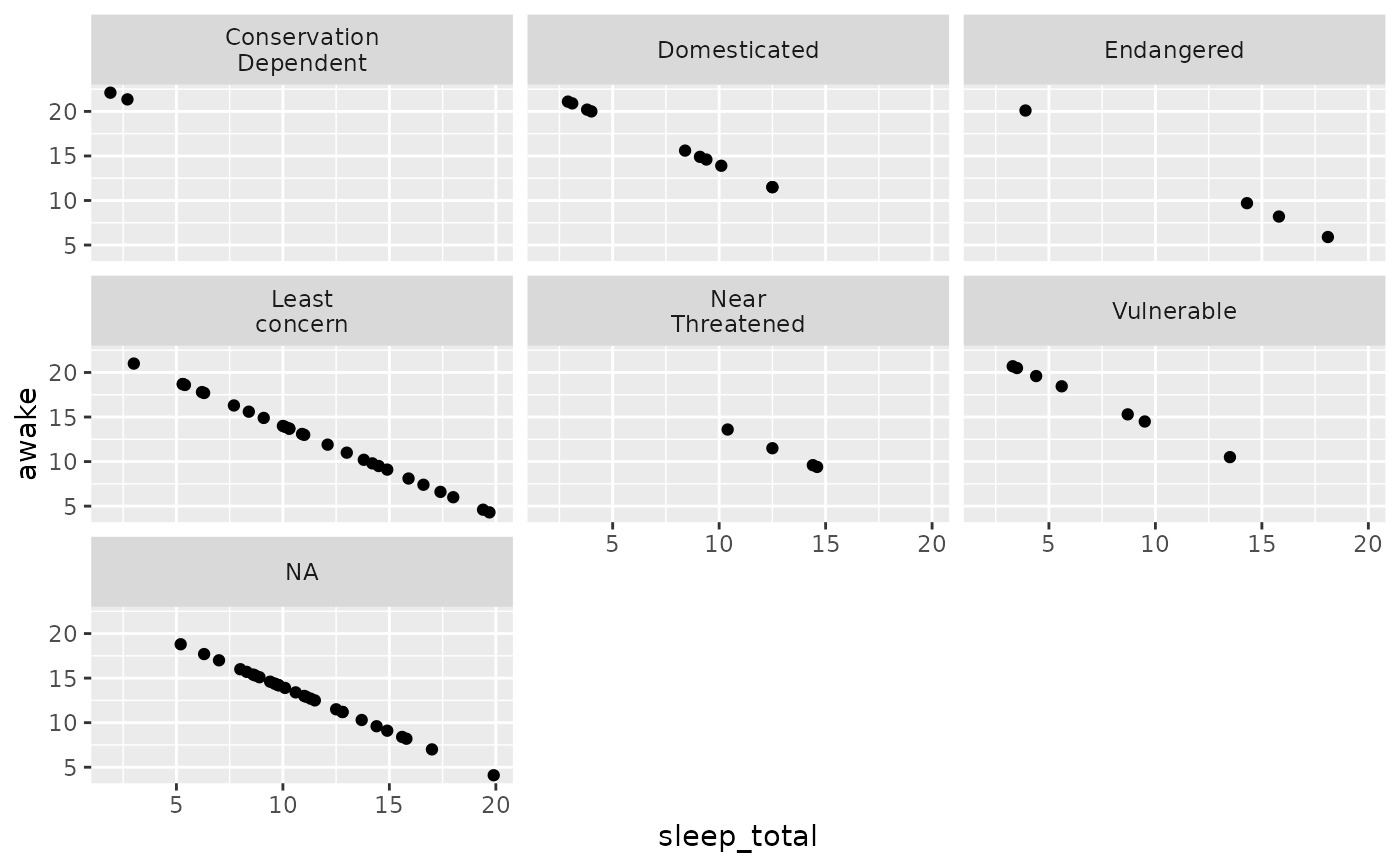
# In the following example, we rename the levels to the long form,
# then apply a wrap labeller to the columns to prevent cropped text
idx <- match(msleep$conservation, names(conservation_status))
msleep$conservation2 <- conservation_status[idx]

p3 <- ggplot(msleep, aes(x = sleep_total, y = awake)) + geom_point()
p3 +
  facet_grid(vore ~ conservation2,
    labeller = labeller(conservation2 = label_wrap_gen(10))
  )


# labeller() is especially useful to act as a global labeller. You
# can set it up once and use it on a range of different plots with
# different facet specifications.

global_labeller <- labeller(
  vore = capitalize,
  conservation = conservation_status,
  conservation2 = label_wrap_gen(10),
  .default = label_both
)

p2 + facet_grid(vore ~ conservation, labeller = global_labeller)

p3 + facet_wrap(~conservation2, labeller = global_labeller)

# }
# }
相關用法
- R ggplot2 labellers 有用的貼標機函數
- R ggplot2 label_bquote 帶有數學表達式的標簽
- R ggplot2 labs 修改軸、圖例和繪圖標簽
- R ggplot2 layer 創建一個新層
- R ggplot2 lims 設置規模限製
- R ggplot2 annotation_logticks 注釋:記錄刻度線
- R ggplot2 vars 引用分麵變量
- R ggplot2 position_stack 將重疊的對象堆疊在一起
- R ggplot2 geom_qq 分位數-分位數圖
- R ggplot2 geom_spoke 由位置、方向和距離參數化的線段
- R ggplot2 geom_quantile 分位數回歸
- R ggplot2 geom_text 文本
- R ggplot2 get_alt_text 從繪圖中提取替代文本
- R ggplot2 annotation_custom 注釋:自定義grob
- R ggplot2 geom_ribbon 函數區和麵積圖
- R ggplot2 stat_ellipse 計算法行數據橢圓
- R ggplot2 resolution 計算數值向量的“分辨率”
- R ggplot2 geom_boxplot 盒須圖(Tukey 風格)
- R ggplot2 geom_hex 二維箱計數的六邊形熱圖
- R ggplot2 scale_gradient 漸變色階
- R ggplot2 scale_shape 形狀比例,又稱字形
- R ggplot2 geom_bar 條形圖
- R ggplot2 draw_key 圖例的關鍵字形
- R ggplot2 annotate 創建注釋層
- R ggplot2 annotation_map 注釋:Map
注:本文由純淨天空篩選整理自Hadley Wickham等大神的英文原創作品 Construct labelling specification。非經特殊聲明,原始代碼版權歸原作者所有,本譯文未經允許或授權,請勿轉載或複製。
