scale_shape() 將離散變量映射到六個易於辨別的形狀。如果你的關卡超過六個,你會收到一條警告消息,第七個及後續關卡將不會出現在情節上。使用scale_shape_manual() 提供您自己的值。除非使用scale_shape_binned(),否則無法將連續變量映射到形狀。不過,由於形狀沒有固有的順序,因此不建議使用此方法。
參數
- ...
-
參數傳遞給
discrete_scalepalette-
調色板函數,當使用單個整數參數(比例中的級別數)調用時,返回它們應采用的值(例如
scales::hue_pal())。 breaks-
之一:
limits-
之一:
-
NULL使用默認比例值 -
定義可能的比例值及其順序的字符向量
-
接受現有(自動)值並返回新值的函數。還接受 rlang lambda 函數表示法。
-
drop-
是否應該從量表中省略未使用的因子水平?默認值
TRUE使用數據中出現的級別;FALSE使用因子中的所有級別。 na.translate-
與連續尺度不同,離散尺度可以輕鬆顯示缺失值,並且默認情況下會這樣做。如果要從離散尺度中刪除缺失值,請指定
na.translate = FALSE。 na.value-
如果
na.translate = TRUE,缺失值應該顯示為什麽美學值?不適用於NA始終位於最右側的位置比例。 aesthetics-
該量表所適用的美學名稱。
scale_name-
應用於與該比例關聯的錯誤消息的比例名稱。
name-
秤的名稱。用作軸或圖例標題。如果
waiver()(默認值),則比例名稱取自用於該美學的第一個映射。如果是NULL,則圖例標題將被省略。 labels-
之一:
guide-
用於創建指南或其名稱的函數。有關詳細信息,請參閱
guides()。 super-
用於構造比例的超類
- solid
-
形狀應該是實心的
TRUE,還是空心的FALSE?
例子
set.seed(596)
dsmall <- diamonds[sample(nrow(diamonds), 100), ]
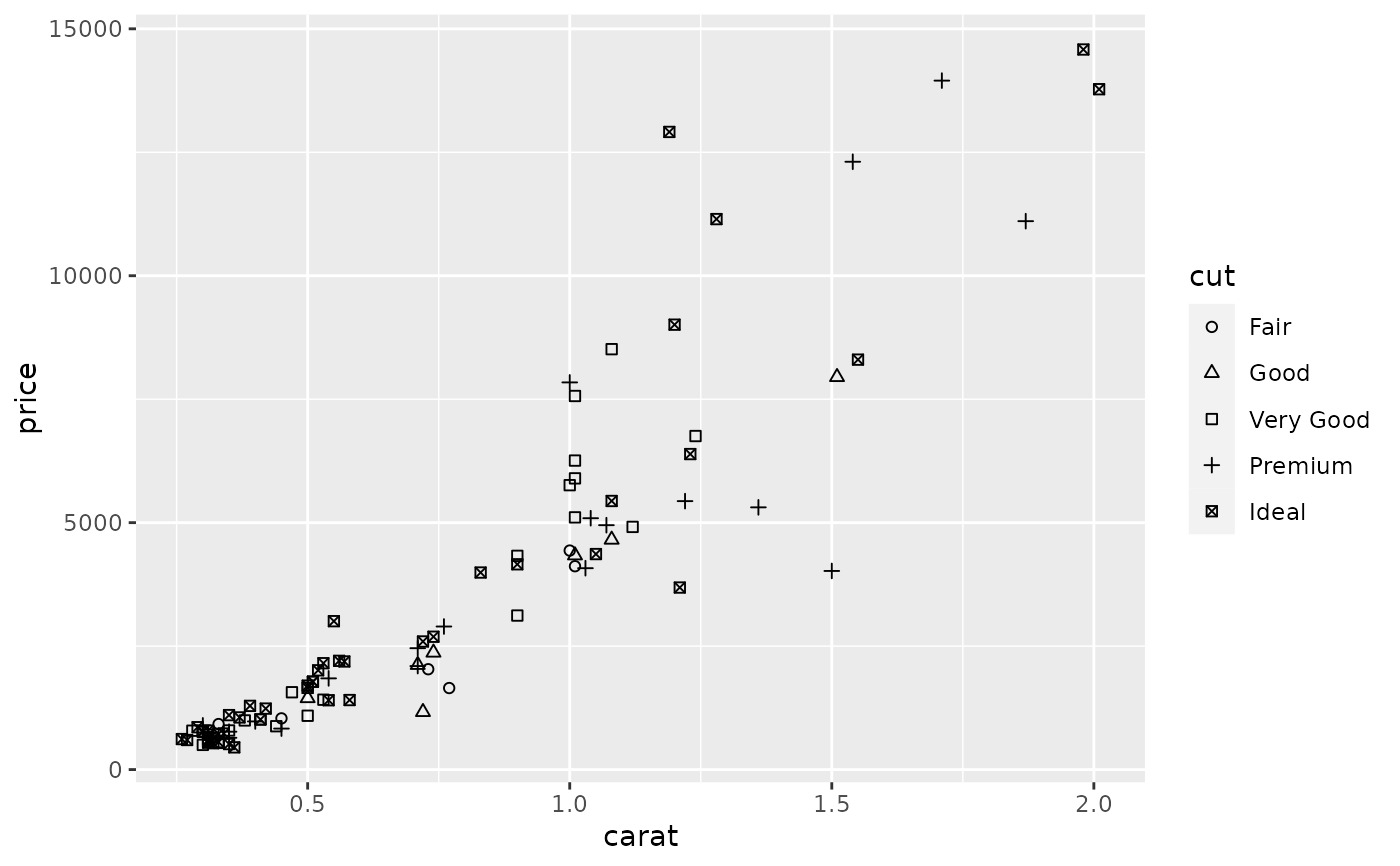
(d <- ggplot(dsmall, aes(carat, price)) + geom_point(aes(shape = cut)))
#> Warning: Using shapes for an ordinal variable is not advised
 d + scale_shape(solid = TRUE) # the default
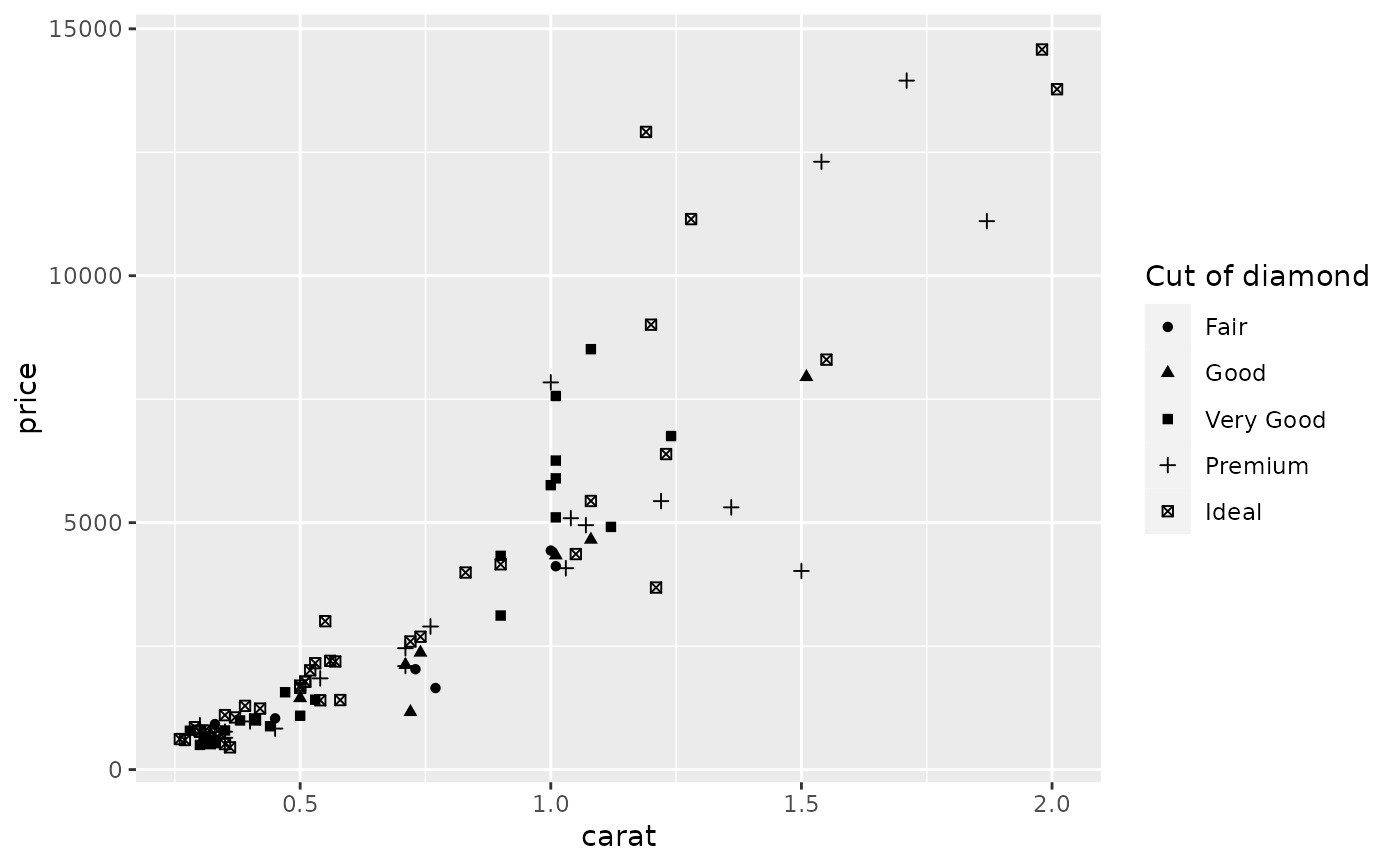
 d + scale_shape(solid = FALSE)
 d + scale_shape(name = "Cut of diamond")
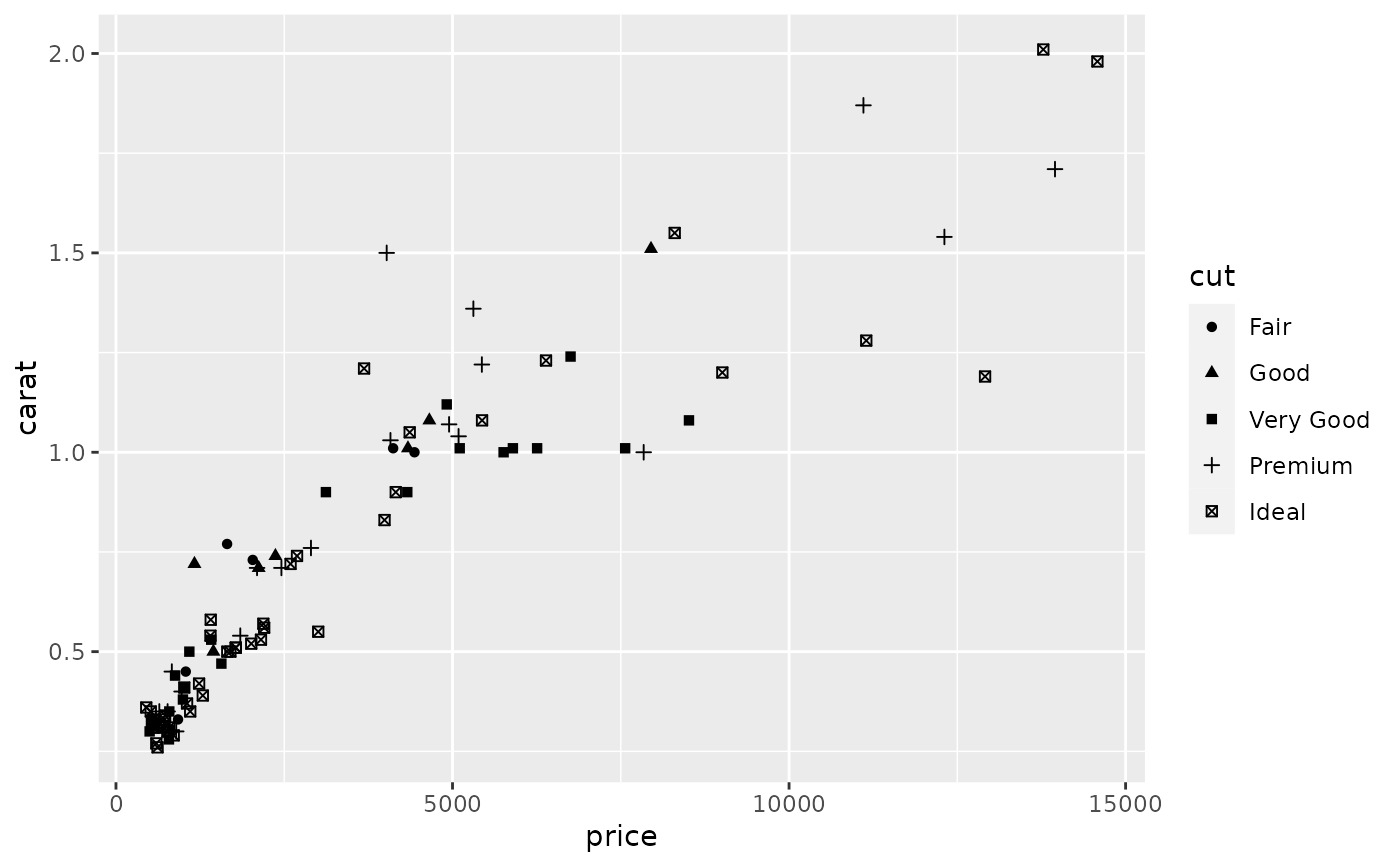
 # To change order of levels, change order of
# underlying factor
levels(dsmall$cut) <- c("Fair", "Good", "Very Good", "Premium", "Ideal")
# Need to recreate plot to pick up new data
ggplot(dsmall, aes(price, carat)) + geom_point(aes(shape = cut))
#> Warning: Using shapes for an ordinal variable is not advised
# To change order of levels, change order of
# underlying factor
levels(dsmall$cut) <- c("Fair", "Good", "Very Good", "Premium", "Ideal")
# Need to recreate plot to pick up new data
ggplot(dsmall, aes(price, carat)) + geom_point(aes(shape = cut))
#> Warning: Using shapes for an ordinal variable is not advised
 # Show a list of available shapes
df_shapes <- data.frame(shape = 0:24)
ggplot(df_shapes, aes(0, 0, shape = shape)) +
geom_point(aes(shape = shape), size = 5, fill = 'red') +
scale_shape_identity() +
facet_wrap(~shape) +
theme_void()
# Show a list of available shapes
df_shapes <- data.frame(shape = 0:24)
ggplot(df_shapes, aes(0, 0, shape = shape)) +
geom_point(aes(shape = shape), size = 5, fill = 'red') +
scale_shape_identity() +
facet_wrap(~shape) +
theme_void()

相關用法
- R ggplot2 scale_steps 分級漸變色標
- R ggplot2 scale_size 麵積或半徑比例
- R ggplot2 scale_gradient 漸變色階
- R ggplot2 scale_viridis 來自 viridisLite 的 Viridis 色標
- R ggplot2 scale_grey 連續灰度色階
- R ggplot2 scale_linetype 線條圖案的比例
- R ggplot2 scale_discrete 離散數據的位置尺度
- R ggplot2 scale_manual 創建您自己的離散尺度
- R ggplot2 scale_colour_discrete 離散色階
- R ggplot2 scale_date 日期/時間數據的位置刻度
- R ggplot2 scale_continuous 連續數據的位置比例(x 和 y)
- R ggplot2 scale_binned 用於對連續數據進行裝箱的位置比例(x 和 y)
- R ggplot2 scale_alpha Alpha 透明度比例
- R ggplot2 scale_colour_continuous 連續色標和分級色標
- R ggplot2 scale_identity 使用不縮放的值
- R ggplot2 scale_linewidth 線寬比例
- R ggplot2 scale_hue 離散數據的均勻間隔顏色
- R ggplot2 scale_brewer ColorBrewer 的連續、發散和定性色標
- R ggplot2 stat_ellipse 計算法行數據橢圓
- R ggplot2 stat_identity 保留數據原樣
- R ggplot2 stat_summary_2d 以二維形式進行分類和匯總(矩形和六邊形)
- R ggplot2 should_stop 在示例中用於說明何時應該發生錯誤。
- R ggplot2 stat_summary 總結唯一/分箱 x 處的 y 值
- R ggplot2 stat_sf_coordinates 從“sf”對象中提取坐標
- R ggplot2 stat_unique 刪除重複項
注:本文由純淨天空篩選整理自Hadley Wickham等大神的英文原創作品 Scales for shapes, aka glyphs。非經特殊聲明,原始代碼版權歸原作者所有,本譯文未經允許或授權,請勿轉載或複製。