當您的數據已經縮放時,即它已經代表 ggplot2 可以直接處理的美學值時,請使用這組比例。這些比例不會產生圖例,除非您還提供 breaks 、 labels 以及所需的 guide 類型。
用法
scale_colour_identity(..., guide = "none", aesthetics = "colour")

scale_fill_identity(..., guide = "none", aesthetics = "fill")

scale_shape_identity(..., guide = "none")

scale_linetype_identity(..., guide = "none")

scale_linewidth_identity(..., guide = "none")

scale_alpha_identity(..., guide = "none")

scale_size_identity(..., guide = "none")

scale_discrete_identity(aesthetics, ..., guide = "none")

scale_continuous_identity(aesthetics, ..., guide = "none")
參數
- ...
-
其他參數傳遞給
discrete_scale()或continuous_scale() - guide
-
該量表的使用指南。默認為
"none"。 - aesthetics
-
字符串或字符串向量,列出了該比例所使用的美學名稱。例如,這可以用於通過
aesthetics = c("colour", "fill")同時將顏色設置應用於colour和fill美學。
細節
函數 scale_colour_identity() 、 scale_fill_identity() 、 scale_size_identity() 等適用於比例名稱中指定的美觀: colour 、 fill 、 size 等。但是,函數 scale_colour_identity() 和 scale_fill_identity() 還有一個可選的 aesthetics 參數,可用於通過單個函數調用定義 colour 和 fill 美學映射。函數 scale_discrete_identity() 和 scale_continuous_identity() 是通用尺度,可以與通過 aesthetics 參數提供的任何美學或一組美學一起使用。
例子
ggplot(luv_colours, aes(u, v)) +
geom_point(aes(colour = col), size = 3) +
scale_color_identity() +
coord_fixed()
 df <- data.frame(
x = 1:4,
y = 1:4,
colour = c("red", "green", "blue", "yellow")
)
ggplot(df, aes(x, y)) + geom_tile(aes(fill = colour))
df <- data.frame(
x = 1:4,
y = 1:4,
colour = c("red", "green", "blue", "yellow")
)
ggplot(df, aes(x, y)) + geom_tile(aes(fill = colour))
 ggplot(df, aes(x, y)) +
geom_tile(aes(fill = colour)) +
scale_fill_identity()
ggplot(df, aes(x, y)) +
geom_tile(aes(fill = colour)) +
scale_fill_identity()
 # To get a legend guide, specify guide = "legend"
ggplot(df, aes(x, y)) +
geom_tile(aes(fill = colour)) +
scale_fill_identity(guide = "legend")
# To get a legend guide, specify guide = "legend"
ggplot(df, aes(x, y)) +
geom_tile(aes(fill = colour)) +
scale_fill_identity(guide = "legend")
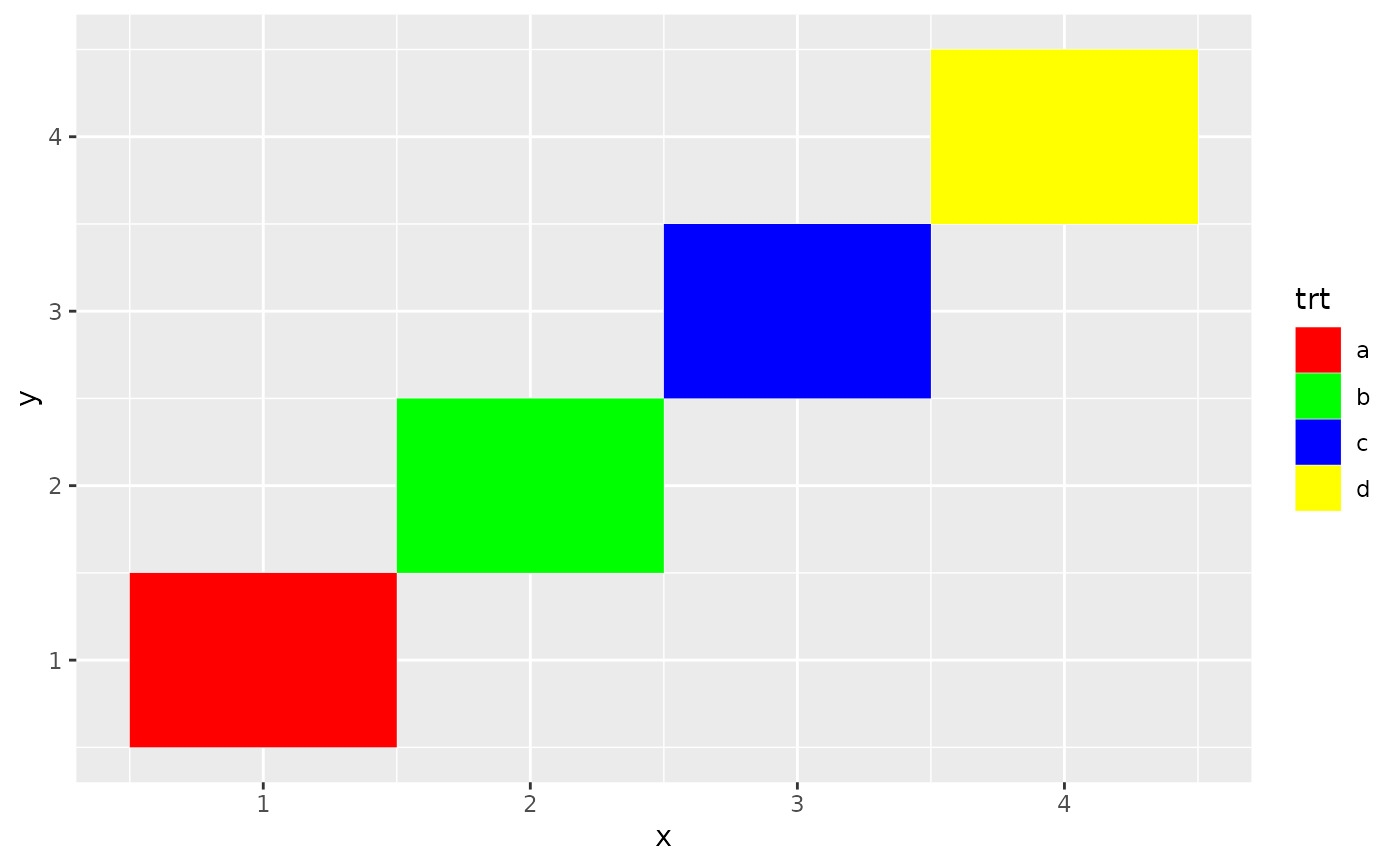
 # But you'll typically also need to supply breaks and labels:
ggplot(df, aes(x, y)) +
geom_tile(aes(fill = colour)) +
scale_fill_identity("trt", labels = letters[1:4], breaks = df$colour,
guide = "legend")
# But you'll typically also need to supply breaks and labels:
ggplot(df, aes(x, y)) +
geom_tile(aes(fill = colour)) +
scale_fill_identity("trt", labels = letters[1:4], breaks = df$colour,
guide = "legend")
 # cyl scaled to appropriate size
ggplot(mtcars, aes(mpg, wt)) +
geom_point(aes(size = cyl))
# cyl scaled to appropriate size
ggplot(mtcars, aes(mpg, wt)) +
geom_point(aes(size = cyl))
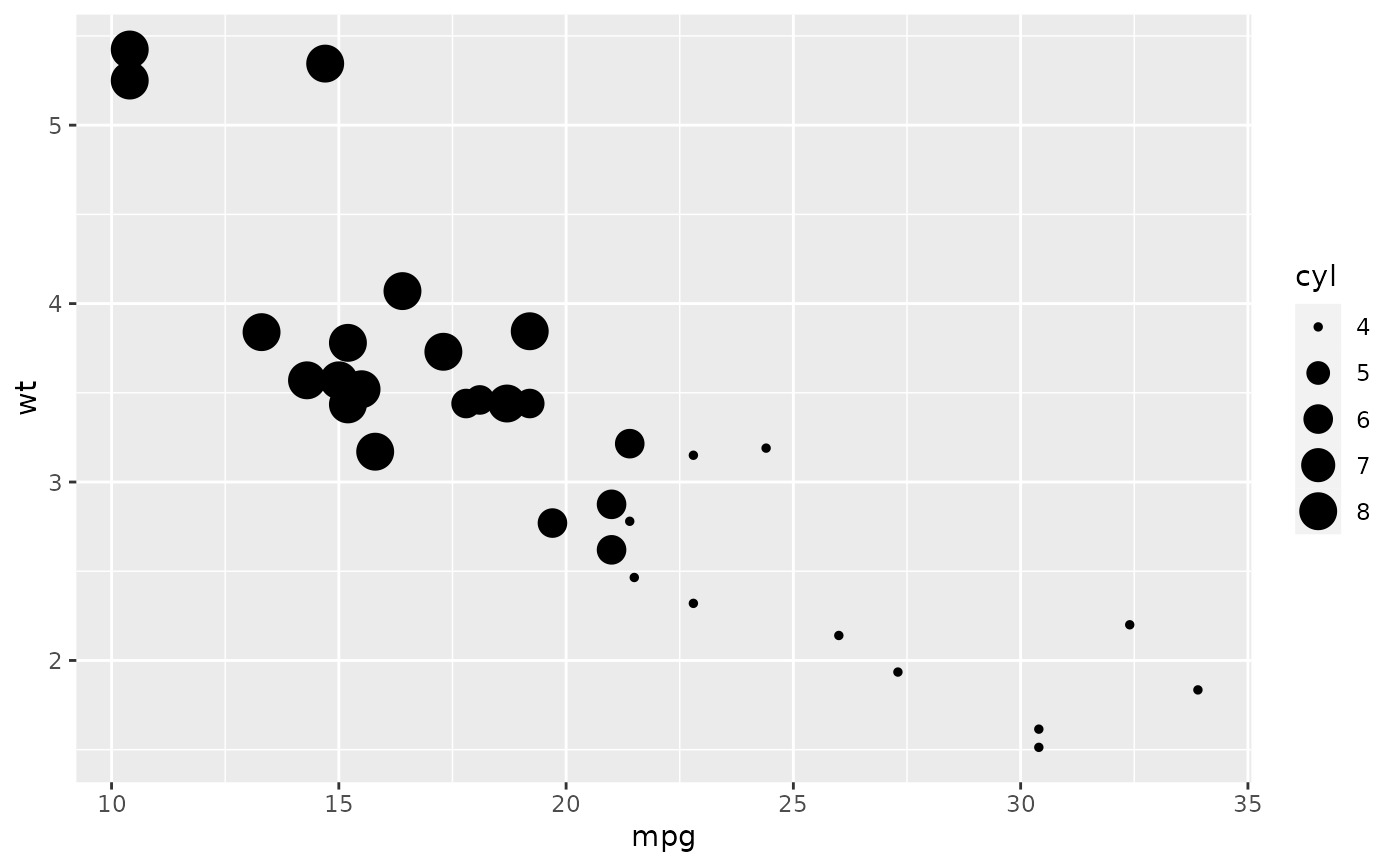 # cyl used as point size
ggplot(mtcars, aes(mpg, wt)) +
geom_point(aes(size = cyl)) +
scale_size_identity()
# cyl used as point size
ggplot(mtcars, aes(mpg, wt)) +
geom_point(aes(size = cyl)) +
scale_size_identity()

相關用法
- R ggplot2 scale_gradient 漸變色階
- R ggplot2 scale_shape 形狀比例,又稱字形
- R ggplot2 scale_viridis 來自 viridisLite 的 Viridis 色標
- R ggplot2 scale_grey 連續灰度色階
- R ggplot2 scale_linetype 線條圖案的比例
- R ggplot2 scale_discrete 離散數據的位置尺度
- R ggplot2 scale_manual 創建您自己的離散尺度
- R ggplot2 scale_colour_discrete 離散色階
- R ggplot2 scale_steps 分級漸變色標
- R ggplot2 scale_size 麵積或半徑比例
- R ggplot2 scale_date 日期/時間數據的位置刻度
- R ggplot2 scale_continuous 連續數據的位置比例(x 和 y)
- R ggplot2 scale_binned 用於對連續數據進行裝箱的位置比例(x 和 y)
- R ggplot2 scale_alpha Alpha 透明度比例
- R ggplot2 scale_colour_continuous 連續色標和分級色標
- R ggplot2 scale_linewidth 線寬比例
- R ggplot2 scale_hue 離散數據的均勻間隔顏色
- R ggplot2 scale_brewer ColorBrewer 的連續、發散和定性色標
- R ggplot2 stat_ellipse 計算法行數據橢圓
- R ggplot2 stat_identity 保留數據原樣
- R ggplot2 stat_summary_2d 以二維形式進行分類和匯總(矩形和六邊形)
- R ggplot2 should_stop 在示例中用於說明何時應該發生錯誤。
- R ggplot2 stat_summary 總結唯一/分箱 x 處的 y 值
- R ggplot2 stat_sf_coordinates 從“sf”對象中提取坐標
- R ggplot2 stat_unique 刪除重複項
注:本文由純淨天空篩選整理自Hadley Wickham等大神的英文原創作品 Use values without scaling。非經特殊聲明,原始代碼版權歸原作者所有,本譯文未經允許或授權,請勿轉載或複製。