翻转笛卡尔坐标,使水平变为垂直,垂直变为水平。这主要用于将显示以 x 为条件的 y 的几何图形和统计数据转换为以 y 为条件的 x。
参数
- xlim, ylim
-
x 轴和 y 轴的限制。
- expand
-
如果
TRUE(默认值)会在限制中添加一个小的扩展因子,以确保数据和轴不重叠。如果FALSE,则完全从数据或xlim/ylim中获取限制。 - clip
-
是否应该将绘图裁剪到绘图面板的范围内?设置
"on"(默认)表示是,设置"off"表示否。在大多数情况下,不应更改"on"的默认值,因为设置clip = "off"可能会导致意外结果。它允许在绘图上的任何位置绘制数据点,包括绘图边。如果通过xlim和ylim设置限制,并且某些数据点超出这些限制,则这些数据点可能会显示在轴、图例、绘图标题或绘图边距等位置。
例子
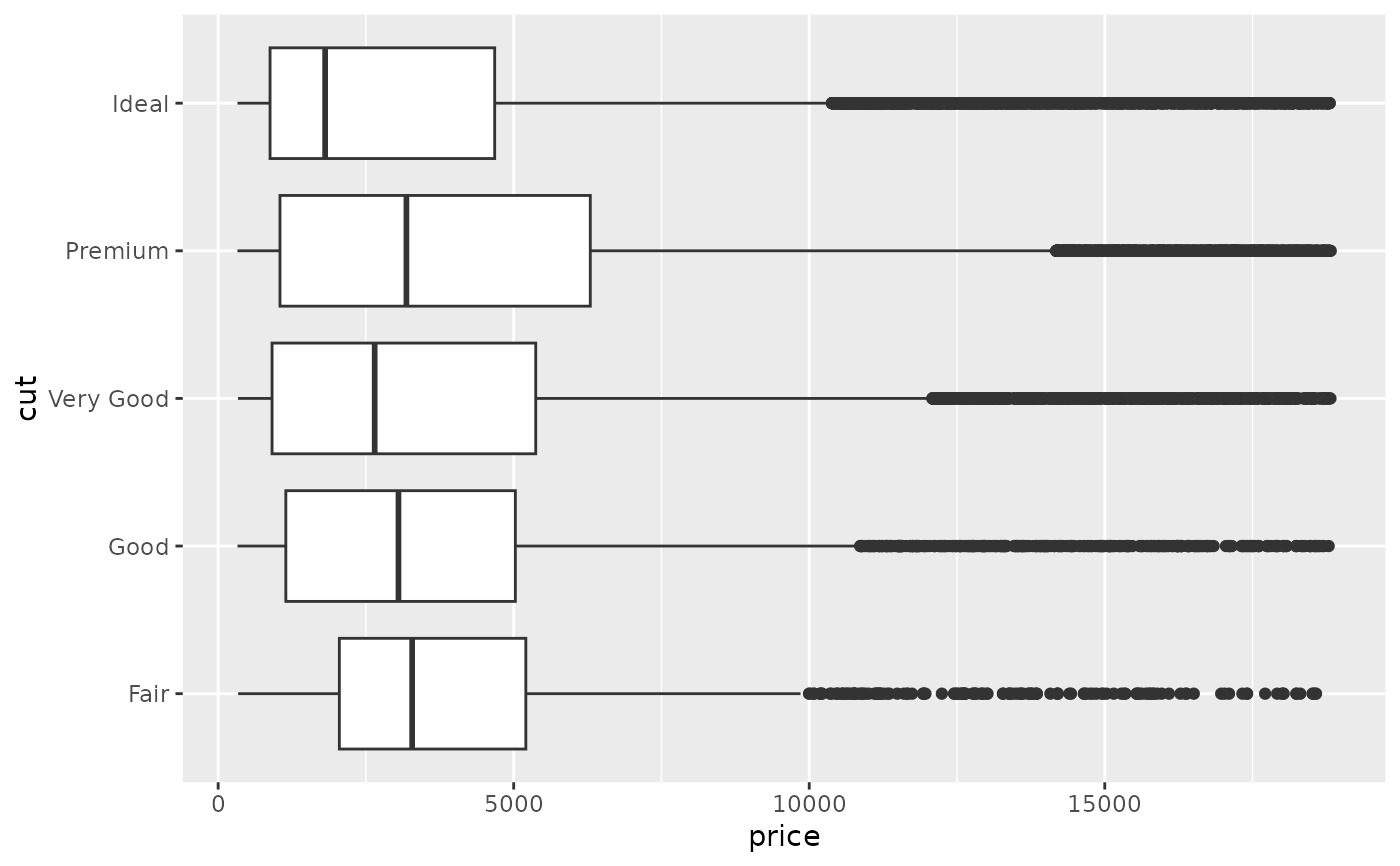
# Very useful for creating boxplots, and other interval
# geoms in the horizontal instead of vertical position.
ggplot(diamonds, aes(cut, price)) +
geom_boxplot() +
coord_flip()
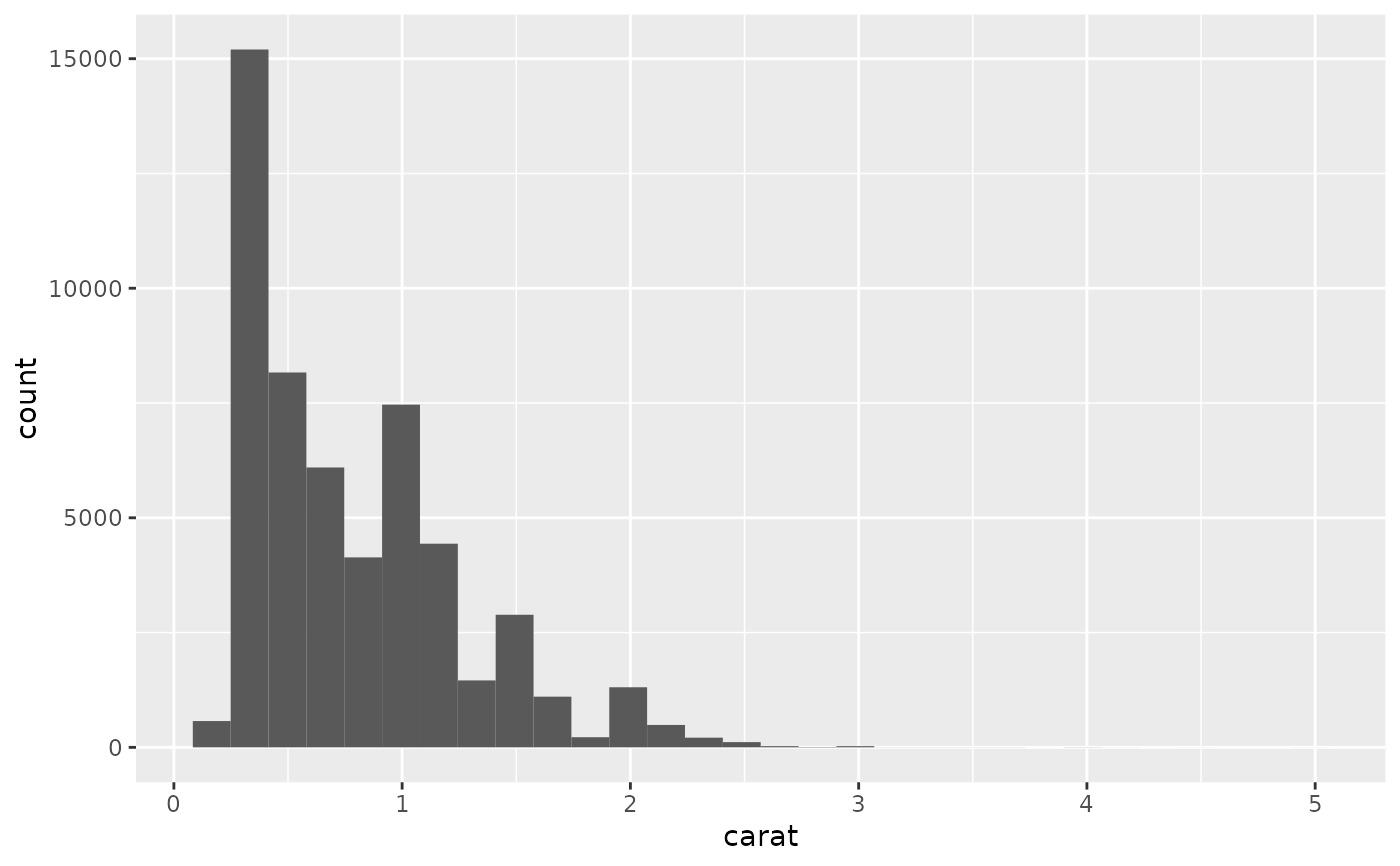
 h <- ggplot(diamonds, aes(carat)) +
geom_histogram()
h
#> `stat_bin()` using `bins = 30`. Pick better value with `binwidth`.
h <- ggplot(diamonds, aes(carat)) +
geom_histogram()
h
#> `stat_bin()` using `bins = 30`. Pick better value with `binwidth`.
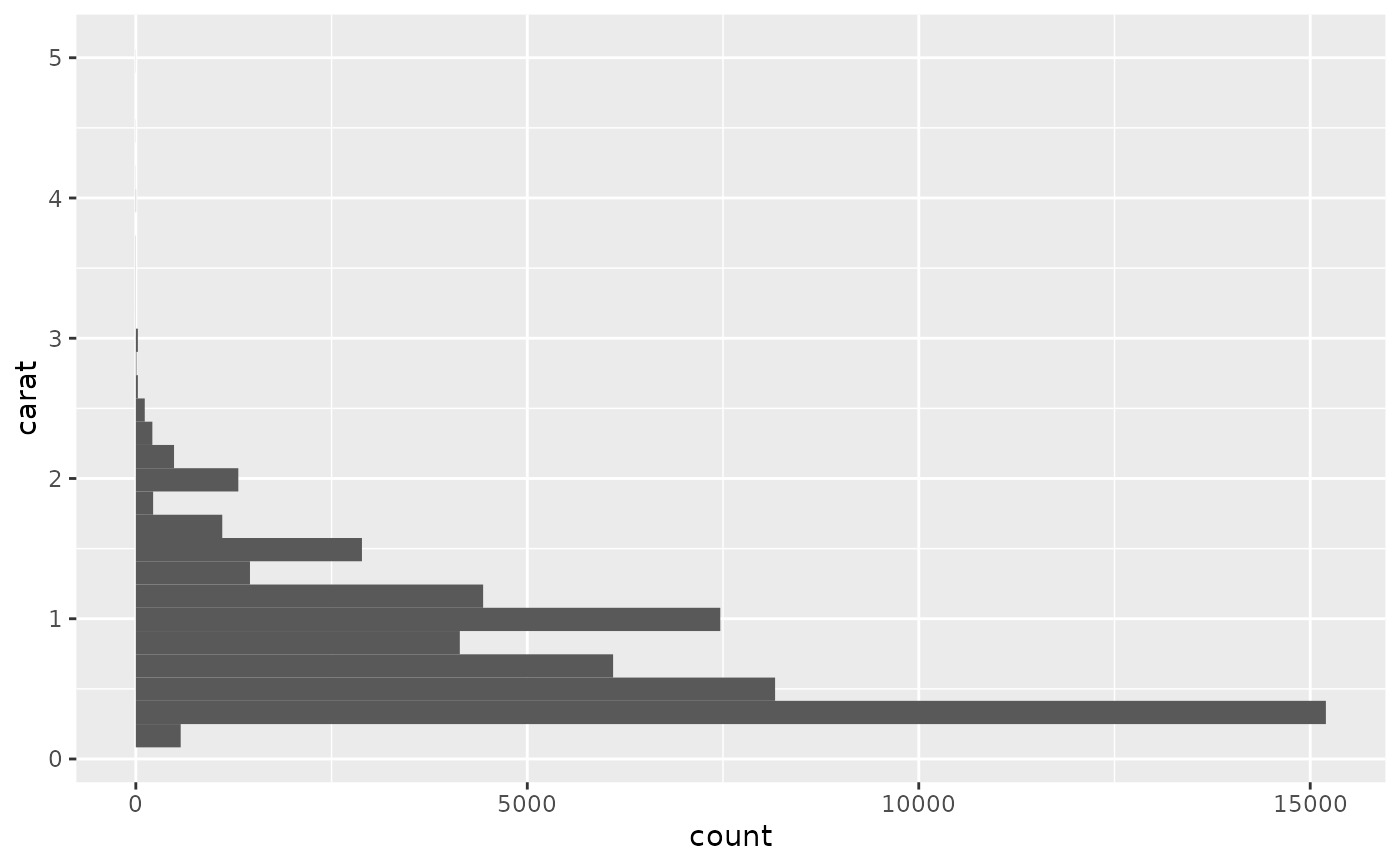
 h + coord_flip()
#> `stat_bin()` using `bins = 30`. Pick better value with `binwidth`.
h + coord_flip()
#> `stat_bin()` using `bins = 30`. Pick better value with `binwidth`.
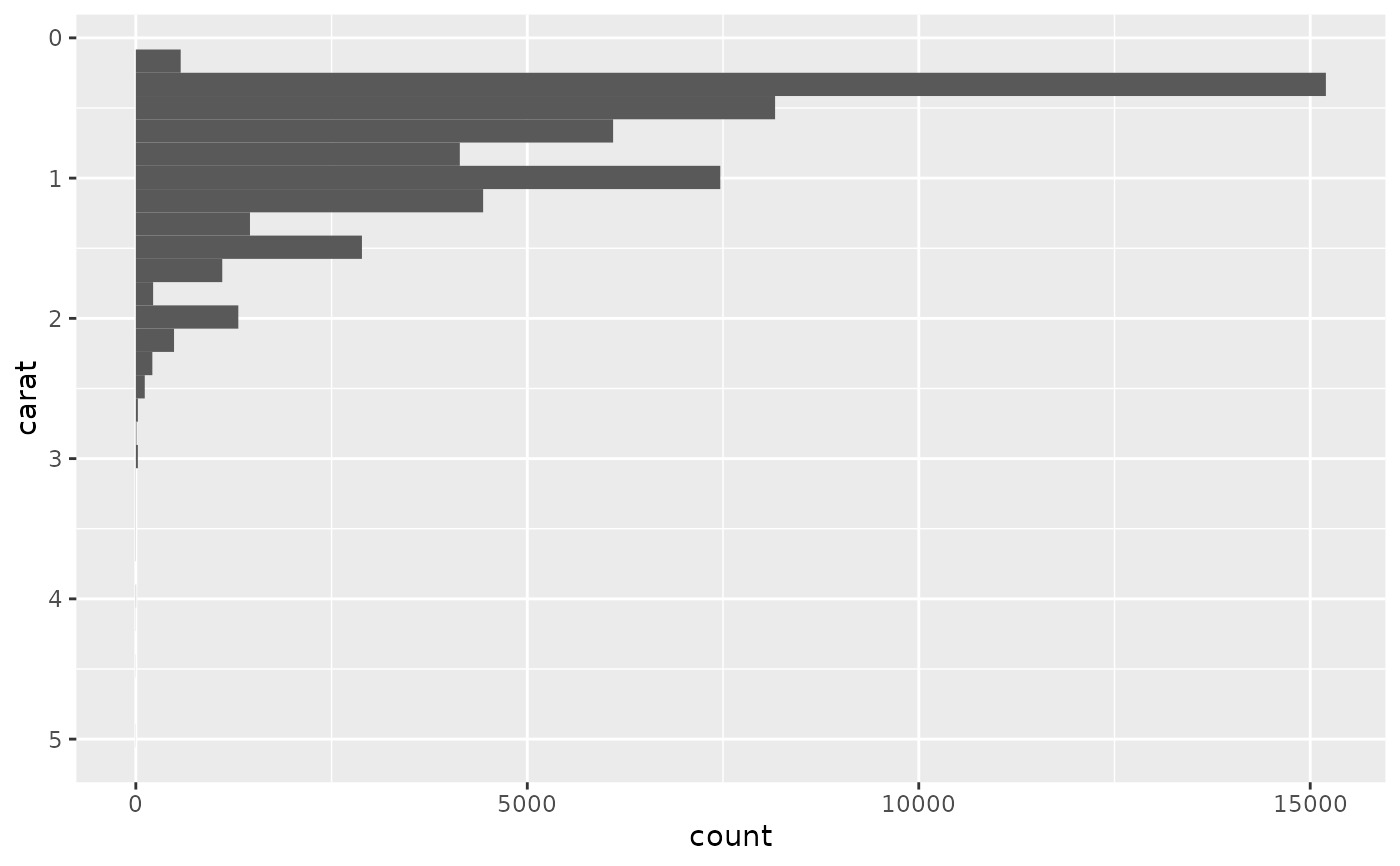
 h + coord_flip() + scale_x_reverse()
#> `stat_bin()` using `bins = 30`. Pick better value with `binwidth`.
h + coord_flip() + scale_x_reverse()
#> `stat_bin()` using `bins = 30`. Pick better value with `binwidth`.
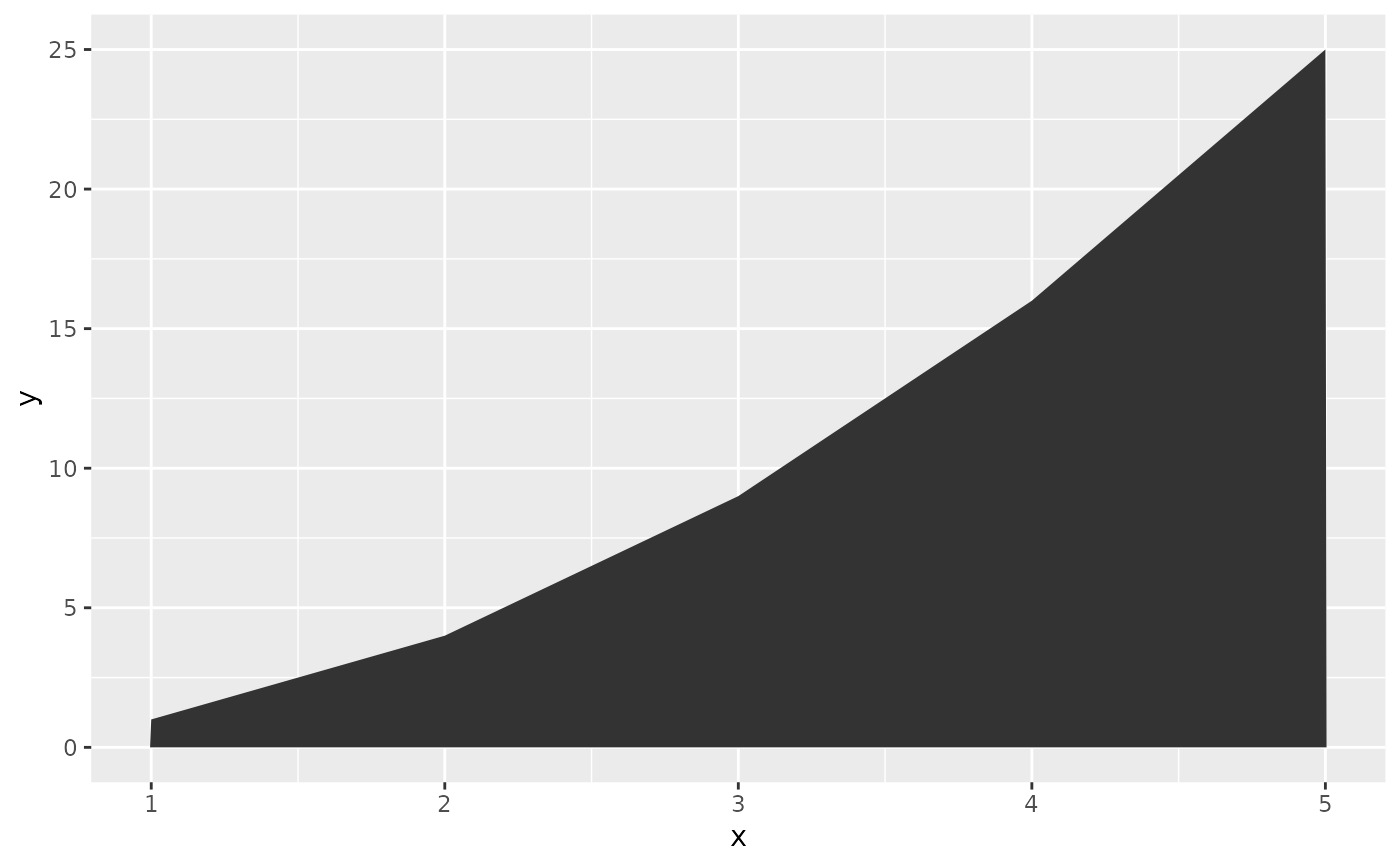
 # You can also use it to flip line and area plots:
df <- data.frame(x = 1:5, y = (1:5) ^ 2)
ggplot(df, aes(x, y)) +
geom_area()
# You can also use it to flip line and area plots:
df <- data.frame(x = 1:5, y = (1:5) ^ 2)
ggplot(df, aes(x, y)) +
geom_area()
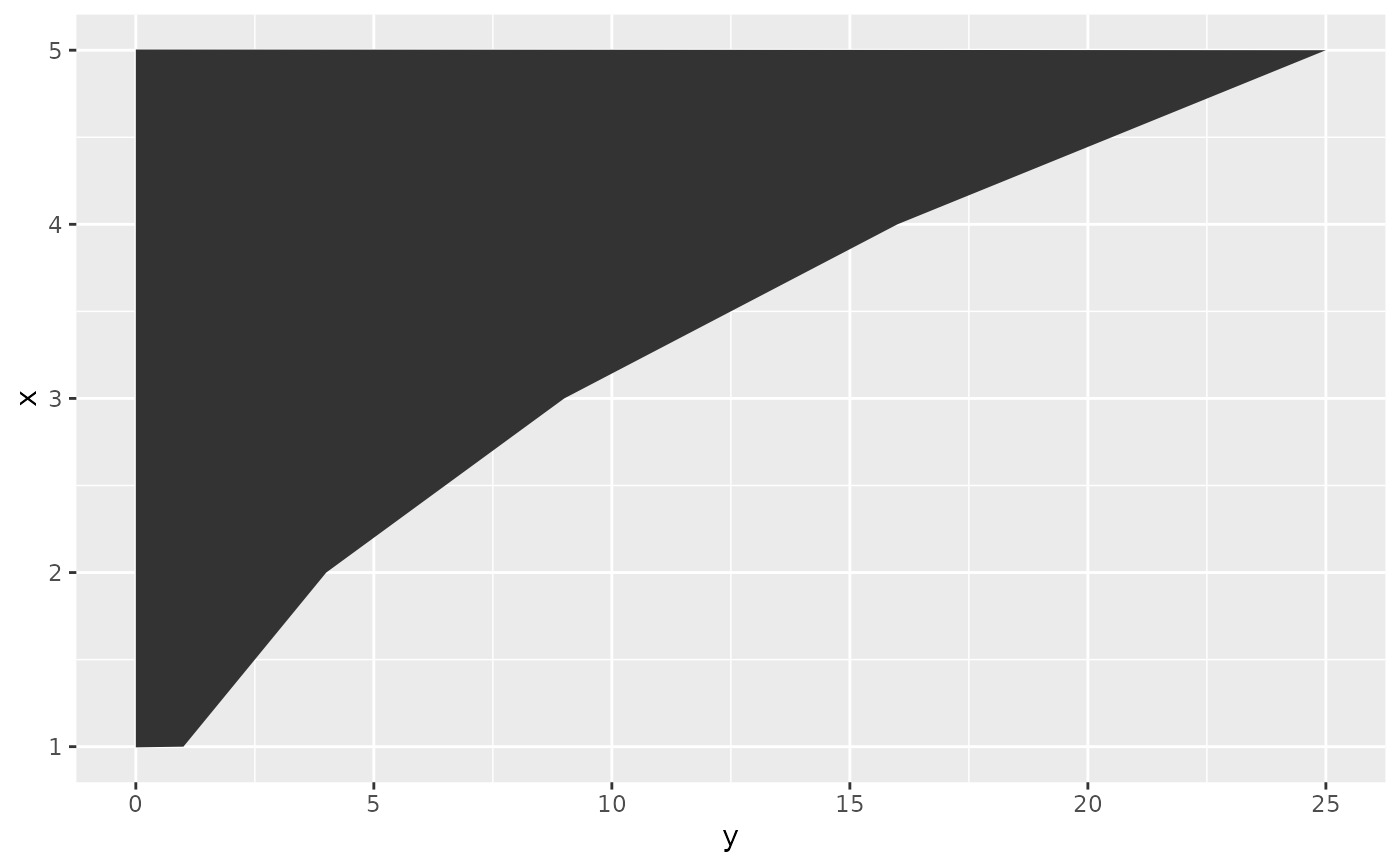
 last_plot() + coord_flip()
相关用法
- R ggplot2 coord_fixed 具有固定“纵横比”的笛卡尔坐标
- R ggplot2 coord_map Map投影
- R ggplot2 coord_polar 极坐标
- R ggplot2 coord_cartesian 笛卡尔坐标
- R ggplot2 coord_trans 变换后的笛卡尔坐标系
- R ggplot2 cut_interval 将数值数据离散化为分类数据
- R ggplot2 annotation_logticks 注释:记录刻度线
- R ggplot2 vars 引用分面变量
- R ggplot2 position_stack 将重叠的对象堆叠在一起
- R ggplot2 geom_qq 分位数-分位数图
- R ggplot2 geom_spoke 由位置、方向和距离参数化的线段
- R ggplot2 geom_quantile 分位数回归
- R ggplot2 geom_text 文本
- R ggplot2 get_alt_text 从绘图中提取替代文本
- R ggplot2 annotation_custom 注释:自定义grob
- R ggplot2 geom_ribbon 函数区和面积图
- R ggplot2 stat_ellipse 计算法行数据椭圆
- R ggplot2 resolution 计算数值向量的“分辨率”
- R ggplot2 geom_boxplot 盒须图(Tukey 风格)
- R ggplot2 lims 设置规模限制
- R ggplot2 geom_hex 二维箱计数的六边形热图
- R ggplot2 scale_gradient 渐变色阶
- R ggplot2 scale_shape 形状比例,又称字形
- R ggplot2 geom_bar 条形图
- R ggplot2 draw_key 图例的关键字形
注:本文由纯净天空筛选整理自Hadley Wickham等大神的英文原创作品 Cartesian coordinates with x and y flipped。非经特殊声明,原始代码版权归原作者所有,本译文未经允许或授权,请勿转载或复制。