这是一个方便的函数,用于为 scale_(x|y)_continuous 和 scale_(x|y)_discrete 的 expand 参数生成尺度扩展向量。展开向量用于在数据和轴之间添加一些空间。
参数
- mult
-
乘法范围扩展因子的向量。如果长度为 1,则比例的下限和上限均向外扩展
mult。如果长度为 2,则下限将扩展mult[1],上限将扩展mult[2]。 - add
-
加法范围扩展常数的向量。如果长度为 1,则标度的下限和上限均向外扩展
add单位。如果长度为 2,则下限将扩展add[1],上限将扩展add[2]。
例子
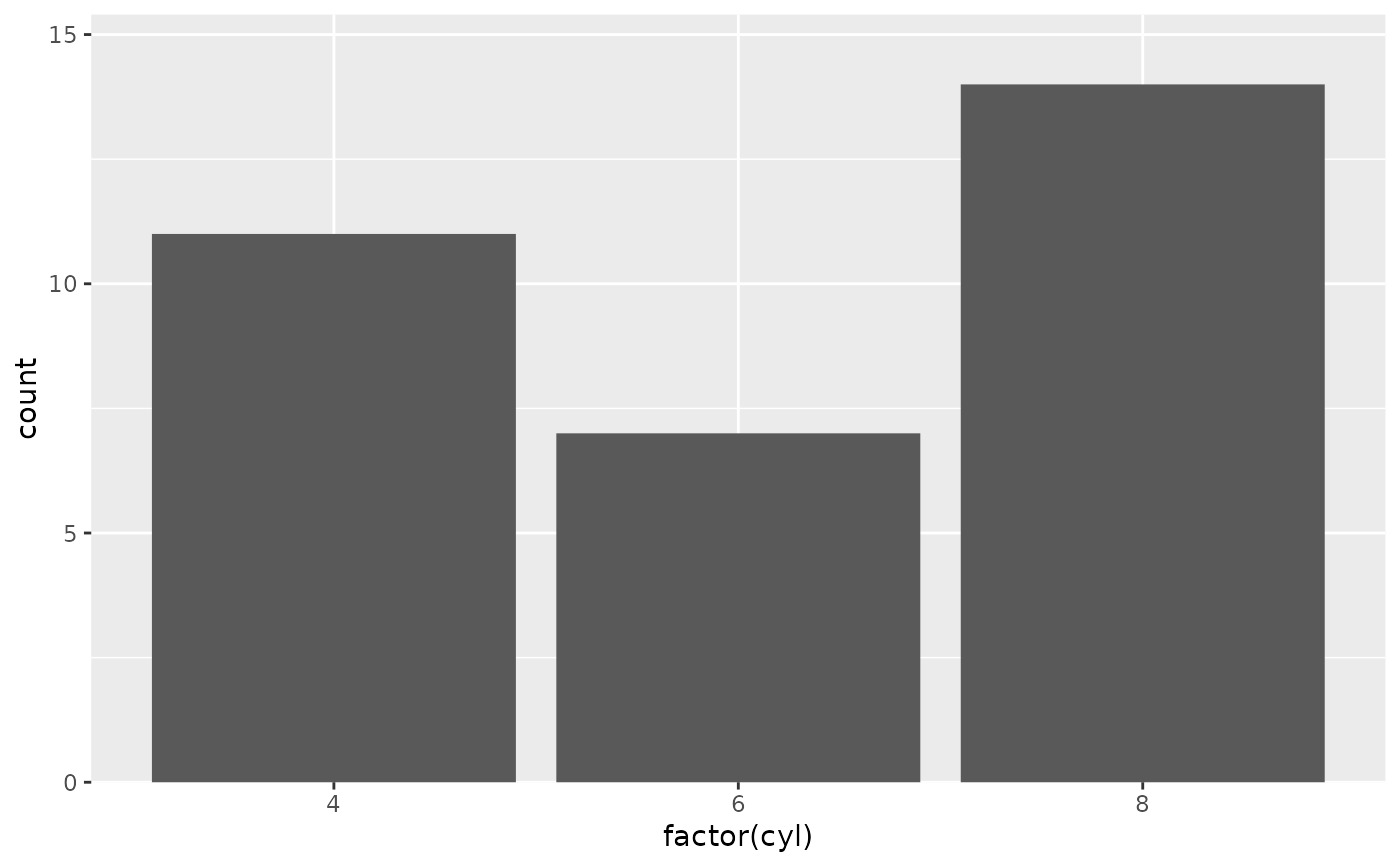
# No space below the bars but 10% above them
ggplot(mtcars) +
geom_bar(aes(x = factor(cyl))) +
scale_y_continuous(expand = expansion(mult = c(0, .1)))
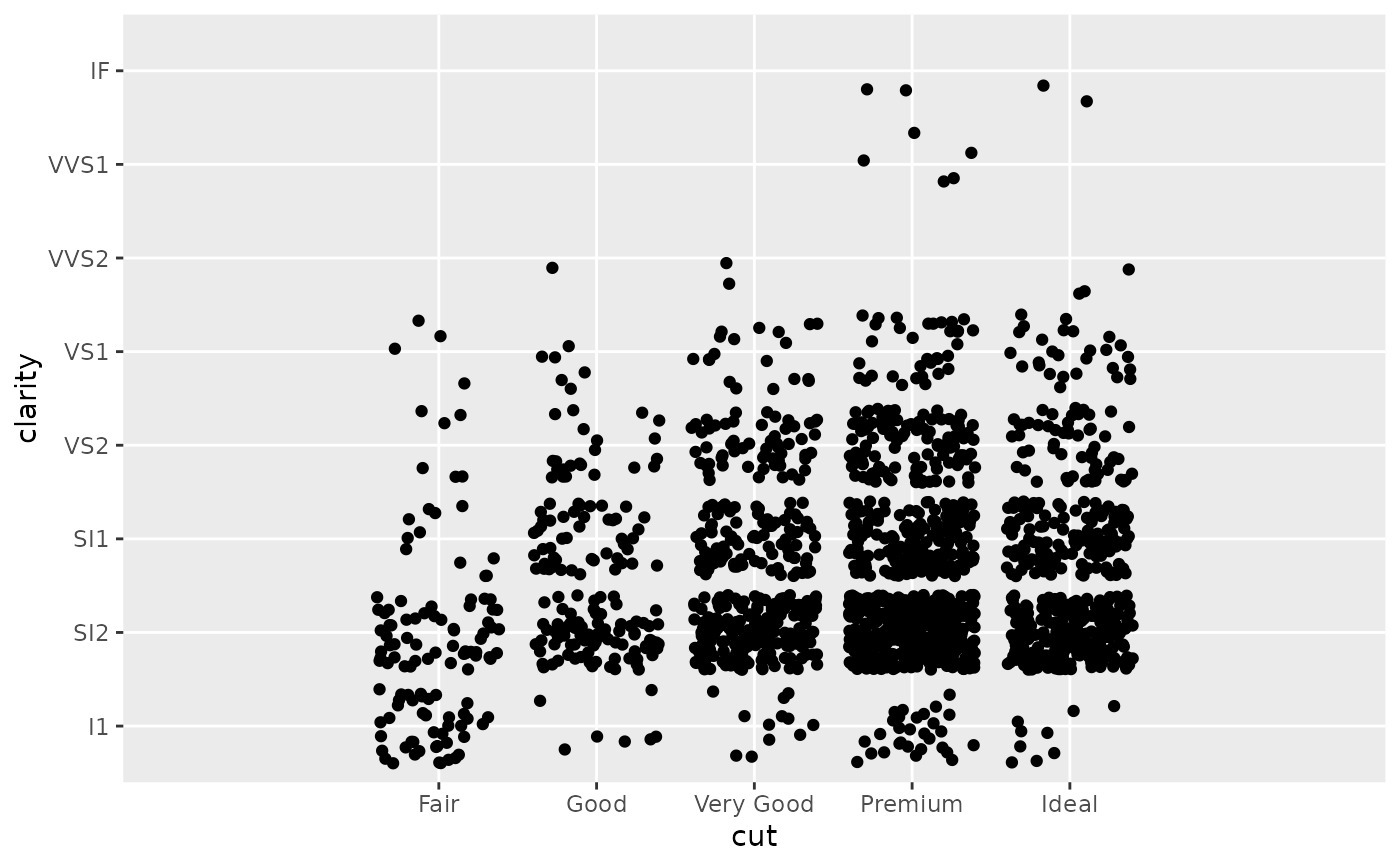
 # Add 2 units of space on the left and right of the data
ggplot(subset(diamonds, carat > 2), aes(cut, clarity)) +
geom_jitter() +
scale_x_discrete(expand = expansion(add = 2))
# Add 2 units of space on the left and right of the data
ggplot(subset(diamonds, carat > 2), aes(cut, clarity)) +
geom_jitter() +
scale_x_discrete(expand = expansion(add = 2))
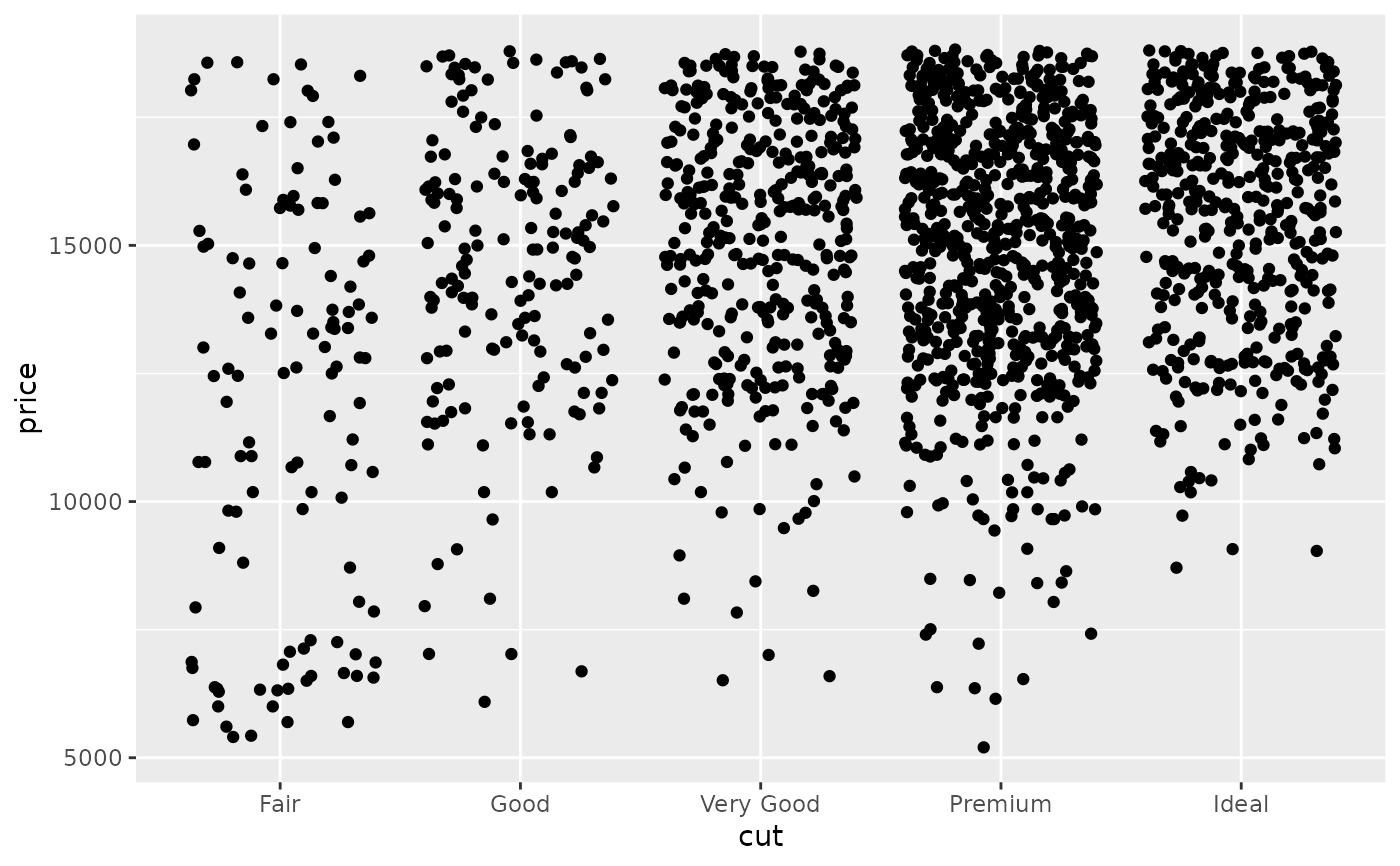
 # Reproduce the default range expansion used
# when the 'expand' argument is not specified
ggplot(subset(diamonds, carat > 2), aes(cut, price)) +
geom_jitter() +
scale_x_discrete(expand = expansion(add = .6)) +
scale_y_continuous(expand = expansion(mult = .05))
# Reproduce the default range expansion used
# when the 'expand' argument is not specified
ggplot(subset(diamonds, carat > 2), aes(cut, price)) +
geom_jitter() +
scale_x_discrete(expand = expansion(add = .6)) +
scale_y_continuous(expand = expansion(mult = .05))
相关用法
- R ggplot2 expand_limits 使用数据扩大绘图限制
- R ggplot2 element 主题元素
- R ggplot2 annotation_logticks 注释:记录刻度线
- R ggplot2 vars 引用分面变量
- R ggplot2 position_stack 将重叠的对象堆叠在一起
- R ggplot2 geom_qq 分位数-分位数图
- R ggplot2 geom_spoke 由位置、方向和距离参数化的线段
- R ggplot2 geom_quantile 分位数回归
- R ggplot2 geom_text 文本
- R ggplot2 get_alt_text 从绘图中提取替代文本
- R ggplot2 annotation_custom 注释:自定义grob
- R ggplot2 geom_ribbon 函数区和面积图
- R ggplot2 stat_ellipse 计算法行数据椭圆
- R ggplot2 resolution 计算数值向量的“分辨率”
- R ggplot2 geom_boxplot 盒须图(Tukey 风格)
- R ggplot2 lims 设置规模限制
- R ggplot2 geom_hex 二维箱计数的六边形热图
- R ggplot2 scale_gradient 渐变色阶
- R ggplot2 scale_shape 形状比例,又称字形
- R ggplot2 geom_bar 条形图
- R ggplot2 draw_key 图例的关键字形
- R ggplot2 annotate 创建注释层
- R ggplot2 label_bquote 带有数学表达式的标签
- R ggplot2 annotation_map 注释:Map
- R ggplot2 scale_viridis 来自 viridisLite 的 Viridis 色标
注:本文由纯净天空筛选整理自Hadley Wickham等大神的英文原创作品 Generate expansion vector for scales。非经特殊声明,原始代码版权归原作者所有,本译文未经允许或授权,请勿转载或复制。