与 theme 系统结合使用,element_ 函数指定如何绘制绘图的非数据部分的显示。
-
element_blank():不绘制任何内容,也不分配空间。 -
element_rect():边框和背景。 -
element_line():行。 -
element_text():文本。
rel() 用于指定相对于父元素的大小,margin() 用于指定元素的边距。
用法
margin(t = 0, r = 0, b = 0, l = 0, unit = "pt")

element_blank()

element_rect(
  fill = NULL,
  colour = NULL,
  linewidth = NULL,
  linetype = NULL,
  color = NULL,
  inherit.blank = FALSE,
  size = deprecated()
)

element_line(
  colour = NULL,
  linewidth = NULL,
  linetype = NULL,
  lineend = NULL,
  color = NULL,
  arrow = NULL,
  inherit.blank = FALSE,
  size = deprecated()
)

element_text(
  family = NULL,
  face = NULL,
  colour = NULL,
  size = NULL,
  hjust = NULL,
  vjust = NULL,
  angle = NULL,
  lineheight = NULL,
  color = NULL,
  margin = NULL,
  debug = NULL,
  inherit.blank = FALSE
)

rel(x)
参数
- t, r, b, l
-
每个边距的尺寸。 (记住顺序,想想麻烦)。
- unit
-
默认尺寸单位。默认为"pt",因此可以最轻松地随文本缩放。
- fill
-
填充颜色。
- colour, color
-
线条/边框颜色。颜色是颜色的别名。
- linewidth
-
线条/边框尺寸(毫米)。
- linetype
-
线路类型。整数 (0:8)、名称(空白、实线、虚线、点线、点线、长线、双线)或具有偶数个(最多 8 个)十六进制数字的字符串,这些数字给出了序列中连续位置的长度 String 。
- inherit.blank
-
该元素是否应该继承其父元素中
element_blank的存在?如果TRUE,其父元素中存在空白元素将导致该元素也为空白。如果FALSE,在计算最终元素状态时将忽略任何空白父元素。 - size
-
文本大小(以磅为单位)。
- lineend
-
线端 线端样式(圆形、对接、方形)
- arrow
-
箭头规范,由
grid::arrow()创建 - family
-
字体系列
- face
-
字体("plain"、"italic"、"bold"、"bold.italic")
- hjust
-
水平对齐(在 \([0, 1]\) 中)
- vjust
-
垂直对齐(在 \([0, 1]\) 中)
- angle
-
角度(以 \([0, 360]\) 为单位)
- lineheight
-
线高
- margin
-
文本周围的边距。有关更多详细信息,请参阅
margin()。创建主题时,边距应放置在面向情节中心的文本一侧。 - debug
-
如果
TRUE,通过在完整文本区域后面绘制一个实心矩形以及每个标签的锚定点来帮助可视化调试。 - x
-
指定相对于父元素的大小的单个数字。
例子
plot <- ggplot(mpg, aes(displ, hwy)) + geom_point()
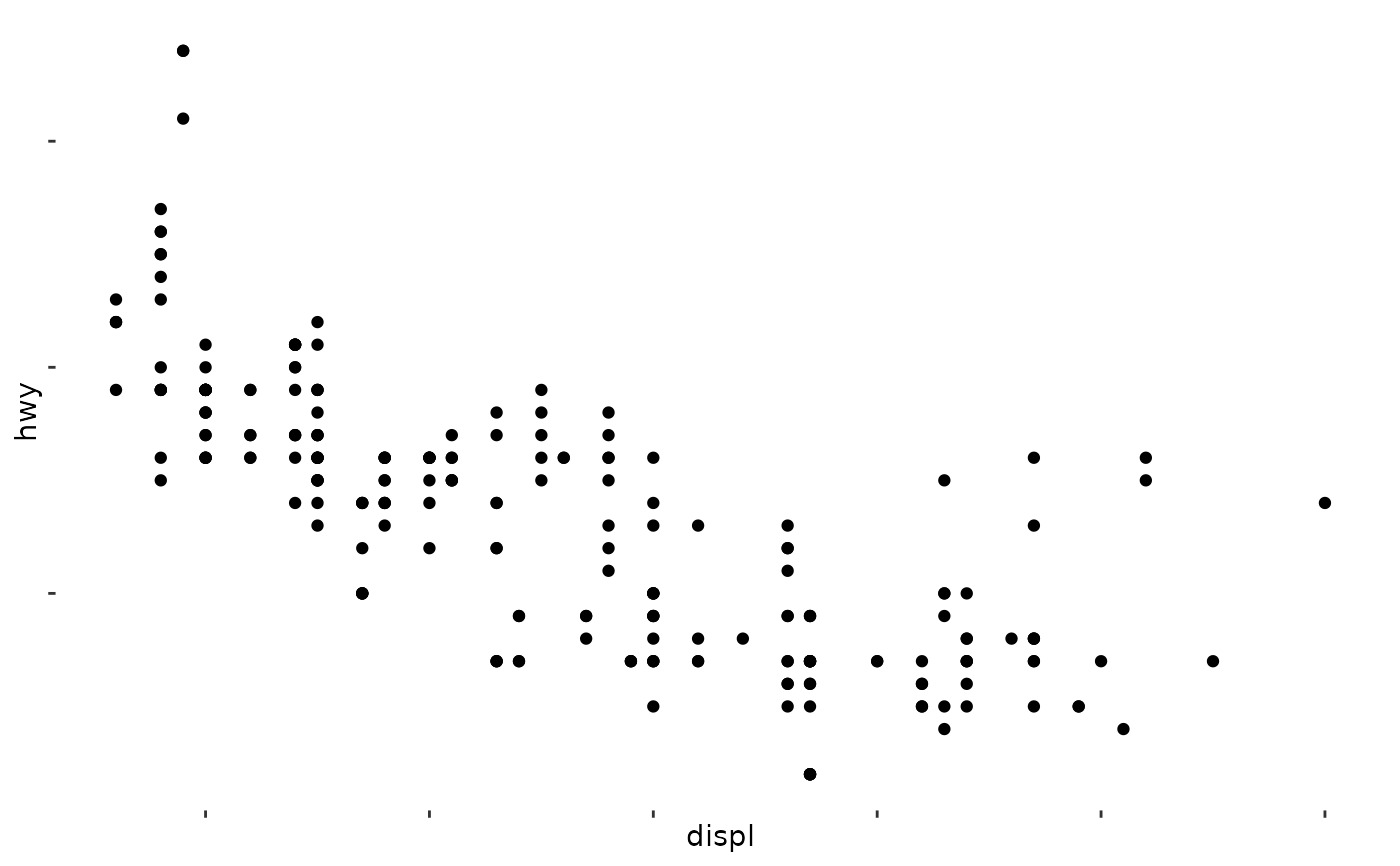
plot + theme(
panel.background = element_blank(),
axis.text = element_blank()
)
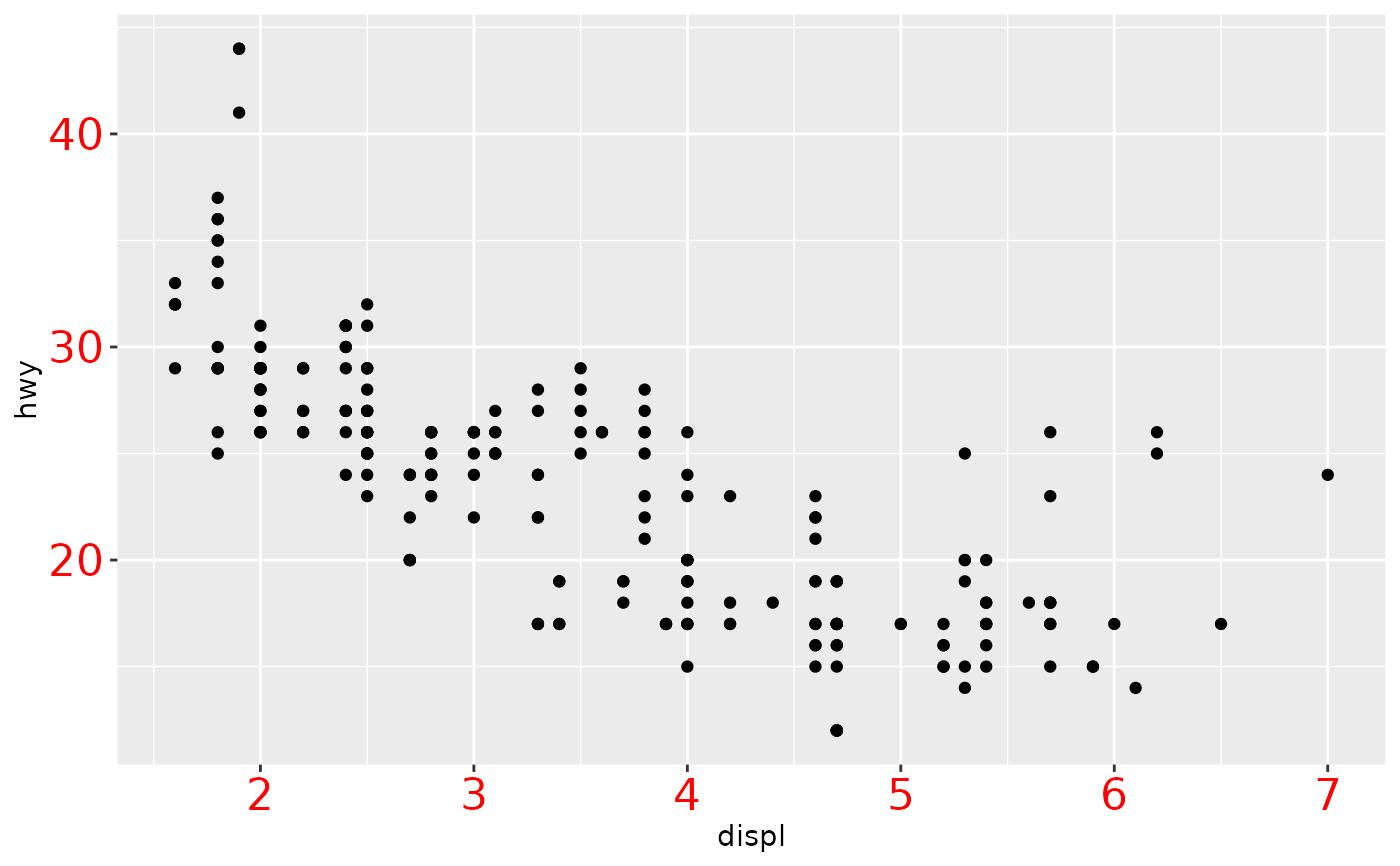
 plot + theme(
axis.text = element_text(colour = "red", size = rel(1.5))
)
plot + theme(
axis.text = element_text(colour = "red", size = rel(1.5))
)
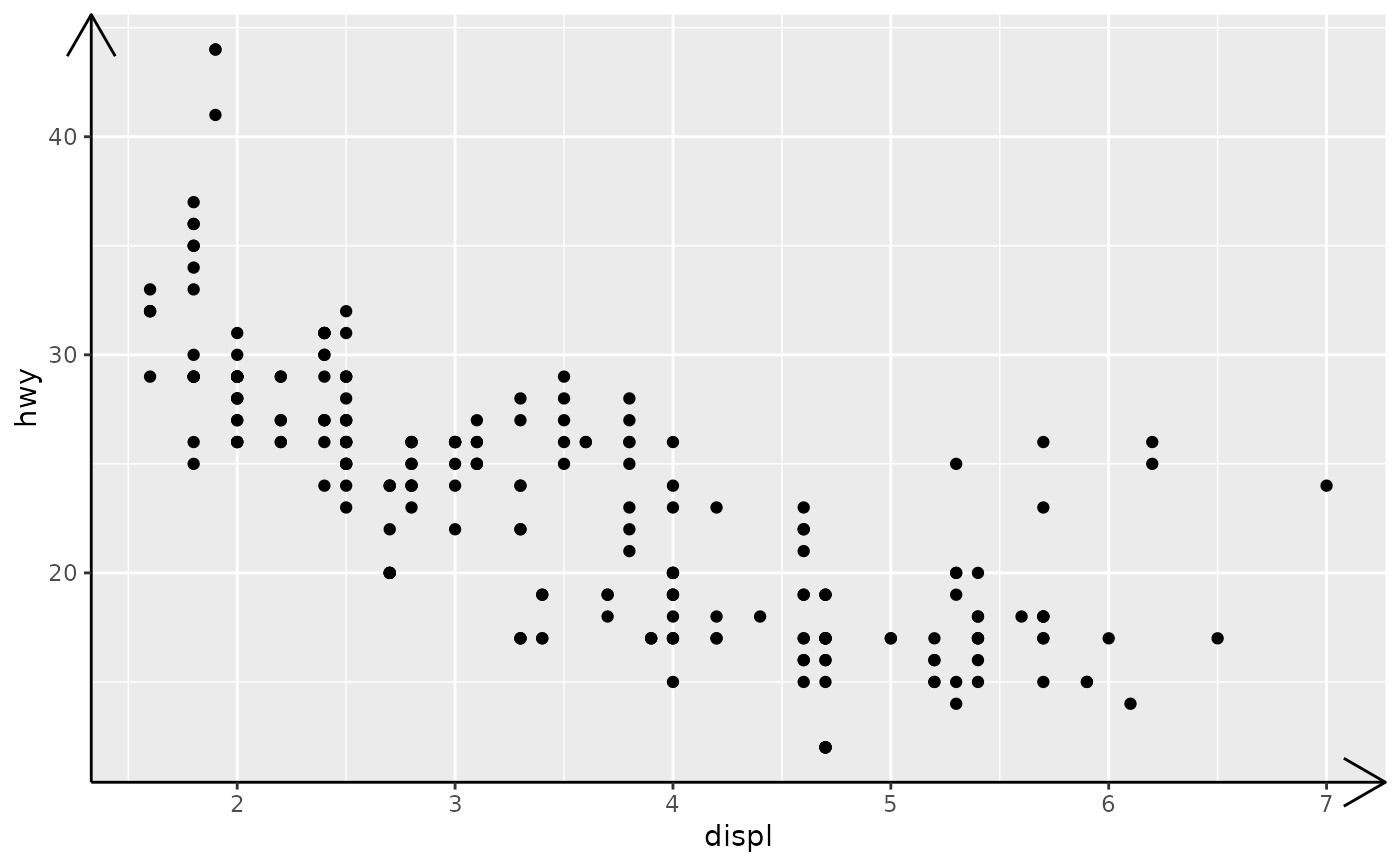
 plot + theme(
axis.line = element_line(arrow = arrow())
)
plot + theme(
axis.line = element_line(arrow = arrow())
)
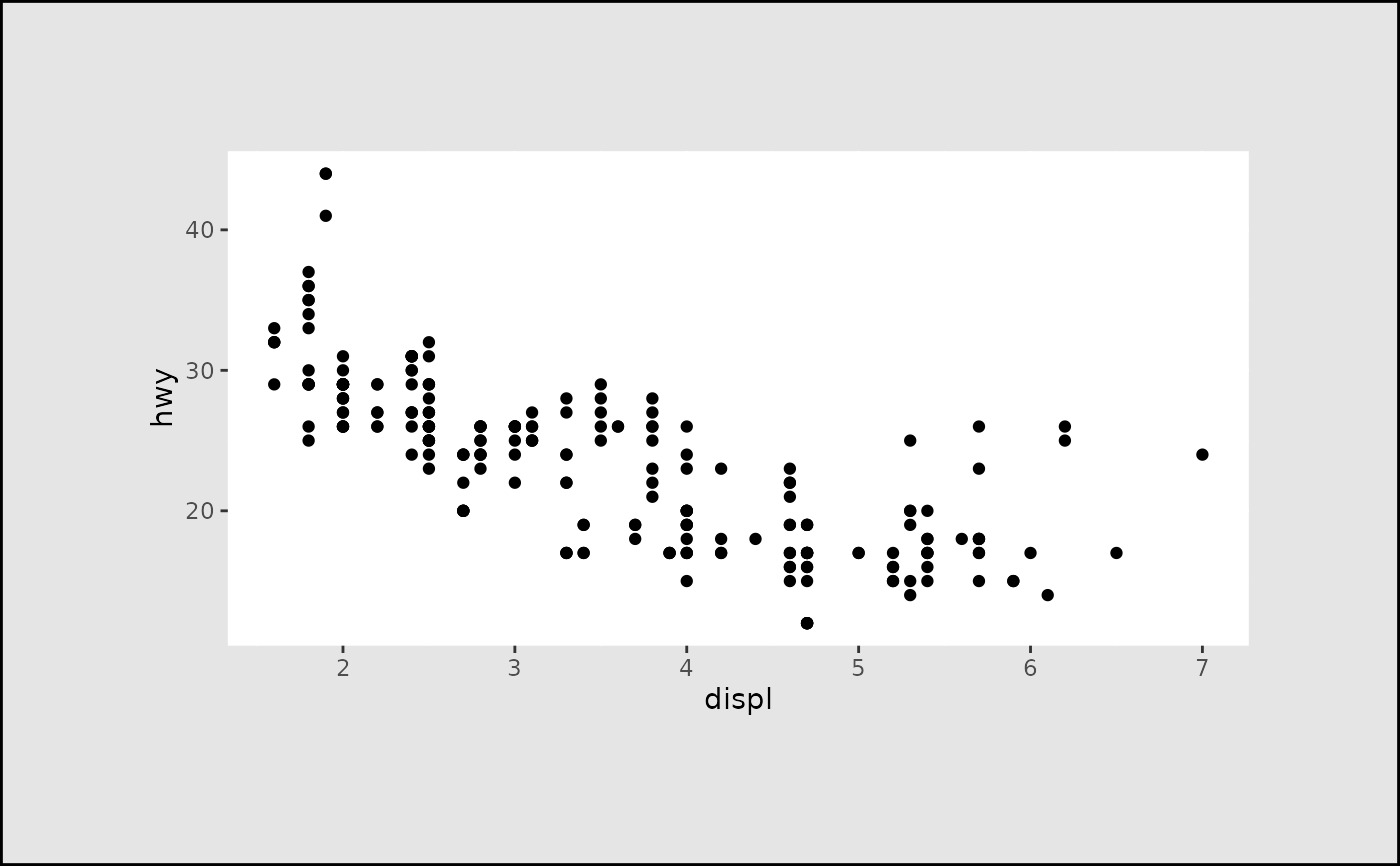
 plot + theme(
panel.background = element_rect(fill = "white"),
plot.margin = margin(2, 2, 2, 2, "cm"),
plot.background = element_rect(
fill = "grey90",
colour = "black",
linewidth = 1
)
)
plot + theme(
panel.background = element_rect(fill = "white"),
plot.margin = margin(2, 2, 2, 2, "cm"),
plot.background = element_rect(
fill = "grey90",
colour = "black",
linewidth = 1
)
)
相关用法
- R ggplot2 expand_limits 使用数据扩大绘图限制
- R ggplot2 expansion 生成尺度的展开向量
- R ggplot2 annotation_logticks 注释:记录刻度线
- R ggplot2 vars 引用分面变量
- R ggplot2 position_stack 将重叠的对象堆叠在一起
- R ggplot2 geom_qq 分位数-分位数图
- R ggplot2 geom_spoke 由位置、方向和距离参数化的线段
- R ggplot2 geom_quantile 分位数回归
- R ggplot2 geom_text 文本
- R ggplot2 get_alt_text 从绘图中提取替代文本
- R ggplot2 annotation_custom 注释:自定义grob
- R ggplot2 geom_ribbon 函数区和面积图
- R ggplot2 stat_ellipse 计算法行数据椭圆
- R ggplot2 resolution 计算数值向量的“分辨率”
- R ggplot2 geom_boxplot 盒须图(Tukey 风格)
- R ggplot2 lims 设置规模限制
- R ggplot2 geom_hex 二维箱计数的六边形热图
- R ggplot2 scale_gradient 渐变色阶
- R ggplot2 scale_shape 形状比例,又称字形
- R ggplot2 geom_bar 条形图
- R ggplot2 draw_key 图例的关键字形
- R ggplot2 annotate 创建注释层
- R ggplot2 label_bquote 带有数学表达式的标签
- R ggplot2 annotation_map 注释:Map
- R ggplot2 scale_viridis 来自 viridisLite 的 Viridis 色标
注:本文由纯净天空筛选整理自Hadley Wickham等大神的英文原创作品 Theme elements。非经特殊声明,原始代码版权归原作者所有,本译文未经允许或授权,请勿转载或复制。