主题是自定义绘图的非数据组件的强大方法:即标题、标签、字体、背景、网格线和图例。主题可用于为绘图提供一致的定制外观。使用 theme() 修改单个图的主题;如果您想修改活动主题以影响所有后续绘图,请参阅theme_update()。如果您想使用完整的主题,例如 theme_bw() 、 theme_minimal() 等,请使用 complete themes 中提供的主题。主题元素根据继承一起记录,请阅读下面有关主题继承的更多信息。
用法
theme(
  line,
  rect,
  text,
  title,
  aspect.ratio,
  axis.title,
  axis.title.x,
  axis.title.x.top,
  axis.title.x.bottom,
  axis.title.y,
  axis.title.y.left,
  axis.title.y.right,
  axis.text,
  axis.text.x,
  axis.text.x.top,
  axis.text.x.bottom,
  axis.text.y,
  axis.text.y.left,
  axis.text.y.right,
  axis.ticks,
  axis.ticks.x,
  axis.ticks.x.top,
  axis.ticks.x.bottom,
  axis.ticks.y,
  axis.ticks.y.left,
  axis.ticks.y.right,
  axis.ticks.length,
  axis.ticks.length.x,
  axis.ticks.length.x.top,
  axis.ticks.length.x.bottom,
  axis.ticks.length.y,
  axis.ticks.length.y.left,
  axis.ticks.length.y.right,
  axis.line,
  axis.line.x,
  axis.line.x.top,
  axis.line.x.bottom,
  axis.line.y,
  axis.line.y.left,
  axis.line.y.right,
  legend.background,
  legend.margin,
  legend.spacing,
  legend.spacing.x,
  legend.spacing.y,
  legend.key,
  legend.key.size,
  legend.key.height,
  legend.key.width,
  legend.text,
  legend.text.align,
  legend.title,
  legend.title.align,
  legend.position,
  legend.direction,
  legend.justification,
  legend.box,
  legend.box.just,
  legend.box.margin,
  legend.box.background,
  legend.box.spacing,
  panel.background,
  panel.border,
  panel.spacing,
  panel.spacing.x,
  panel.spacing.y,
  panel.grid,
  panel.grid.major,
  panel.grid.minor,
  panel.grid.major.x,
  panel.grid.major.y,
  panel.grid.minor.x,
  panel.grid.minor.y,
  panel.ontop,
  plot.background,
  plot.title,
  plot.title.position,
  plot.subtitle,
  plot.caption,
  plot.caption.position,
  plot.tag,
  plot.tag.position,
  plot.margin,
  strip.background,
  strip.background.x,
  strip.background.y,
  strip.clip,
  strip.placement,
  strip.text,
  strip.text.x,
  strip.text.x.bottom,
  strip.text.x.top,
  strip.text.y,
  strip.text.y.left,
  strip.text.y.right,
  strip.switch.pad.grid,
  strip.switch.pad.wrap,
  ...,
  complete = FALSE,
  validate = TRUE
)
参数
- line
-
所有行元素(
element_line()) - rect
-
所有矩形元素(
element_rect()) - text
-
所有文本元素 (
element_text()) - title
-
所有标题元素:绘图、轴、图例(
element_text();继承自text) - aspect.ratio
-
面板的长宽比
- axis.title, axis.title.x, axis.title.y, axis.title.x.top, axis.title.x.bottom, axis.title.y.left, axis.title.y.right
-
轴标签 (
element_text())。指定所有轴的标签 (axis.title)、按平面的标签(使用axis.title.x或axis.title.y)或为每个轴单独指定标签(使用axis.title.x.bottom、axis.title.x.top、axis.title.y.left、axis.title.y.right)。axis.title.*.*继承自axis.title.*,axis.title.*又继承自axis.title,而axis.title又继承自text - axis.text, axis.text.x, axis.text.y, axis.text.x.top, axis.text.x.bottom, axis.text.y.left, axis.text.y.right
-
沿轴勾选标签 (
element_text())。指定所有轴刻度标签 (axis.text)、按平面刻度标签(使用axis.text.x或axis.text.y)或为每个轴单独指定刻度标签(使用axis.text.x.bottom、axis.text.x.top、axis.text.y.left、axis.text.y.right)。axis.text.*.*继承自axis.text.*,axis.text.*又继承自axis.text,而axis.text又继承自text - axis.ticks, axis.ticks.x, axis.ticks.x.top, axis.ticks.x.bottom, axis.ticks.y, axis.ticks.y.left, axis.ticks.y.right
-
沿轴的刻度线 (
element_line())。指定所有刻度线 (axis.ticks)、按平面刻度(使用axis.ticks.x或axis.ticks.y)或为每个轴单独指定(使用axis.ticks.x.bottom、axis.ticks.x.top、axis.ticks.y.left、axis.ticks.y.right)。axis.ticks.*.*继承自axis.ticks.*,axis.ticks.*又继承自axis.ticks,而axis.ticks又继承自line - axis.ticks.length, axis.ticks.length.x, axis.ticks.length.x.top, axis.ticks.length.x.bottom, axis.ticks.length.y, axis.ticks.length.y.left, axis.ticks.length.y.right
-
刻度线的长度 (
unit) - axis.line, axis.line.x, axis.line.x.top, axis.line.x.bottom, axis.line.y, axis.line.y.left, axis.line.y.right
-
沿轴的线(
element_line())。指定沿所有轴 (axis.line) 的线、每个平面的线(使用axis.line.x或axis.line.y)或单独为每个轴指定线(使用axis.line.x.bottom、axis.line.x.top、axis.line.y.left、axis.line.y.right)。axis.line.*.*继承自axis.line.*,axis.line.*又继承自axis.line,而axis.line又继承自line - legend.background
-
图例背景(
element_rect();继承自rect) - legend.margin
-
每个图例周围的边距 (
margin()) - legend.spacing, legend.spacing.x, legend.spacing.y
-
图例之间的间距 (
unit)。legend.spacing.x和legend.spacing.y继承自legend.spacing或可以单独指定 - legend.key
-
图例键下方的背景(
element_rect();继承自rect) - legend.key.size, legend.key.height, legend.key.width
-
图例键的大小(
unit);关键背景高度和宽度继承自legend.key.size或可以单独指定 - legend.text
-
图例项标签(
element_text();继承自text) - legend.text.align
-
图例标签的对齐方式(数字从 0(左)到 1(右))
- legend.title
-
图例标题(
element_text();继承自title) - legend.title.align
-
图例标题的对齐方式(从 0(左)到 1(右)的数字)
- legend.position
-
图例的位置("none"、"left"、"right"、"bottom"、"top" 或二元素数值向量)
- legend.direction
-
图例中项目的布局("horizontal" 或 "vertical")
- legend.justification
-
用于将图例定位在绘图内部的锚点("center" 或二元素数值向量)或定位在绘图外部时根据绘图区域进行的调整
- legend.box
-
多个图例的排列("horizontal" 或 "vertical")
- legend.box.just
-
当有多个图例("top"、"bottom"、"left" 或 "right")时,整个边界框中每个图例的对齐方式
- legend.box.margin
-
整个图例区域周围的边距,使用
margin()指定 - legend.box.background
-
图例区域的背景(
element_rect();继承自rect) - legend.box.spacing
-
绘图区域和图例框之间的间距(
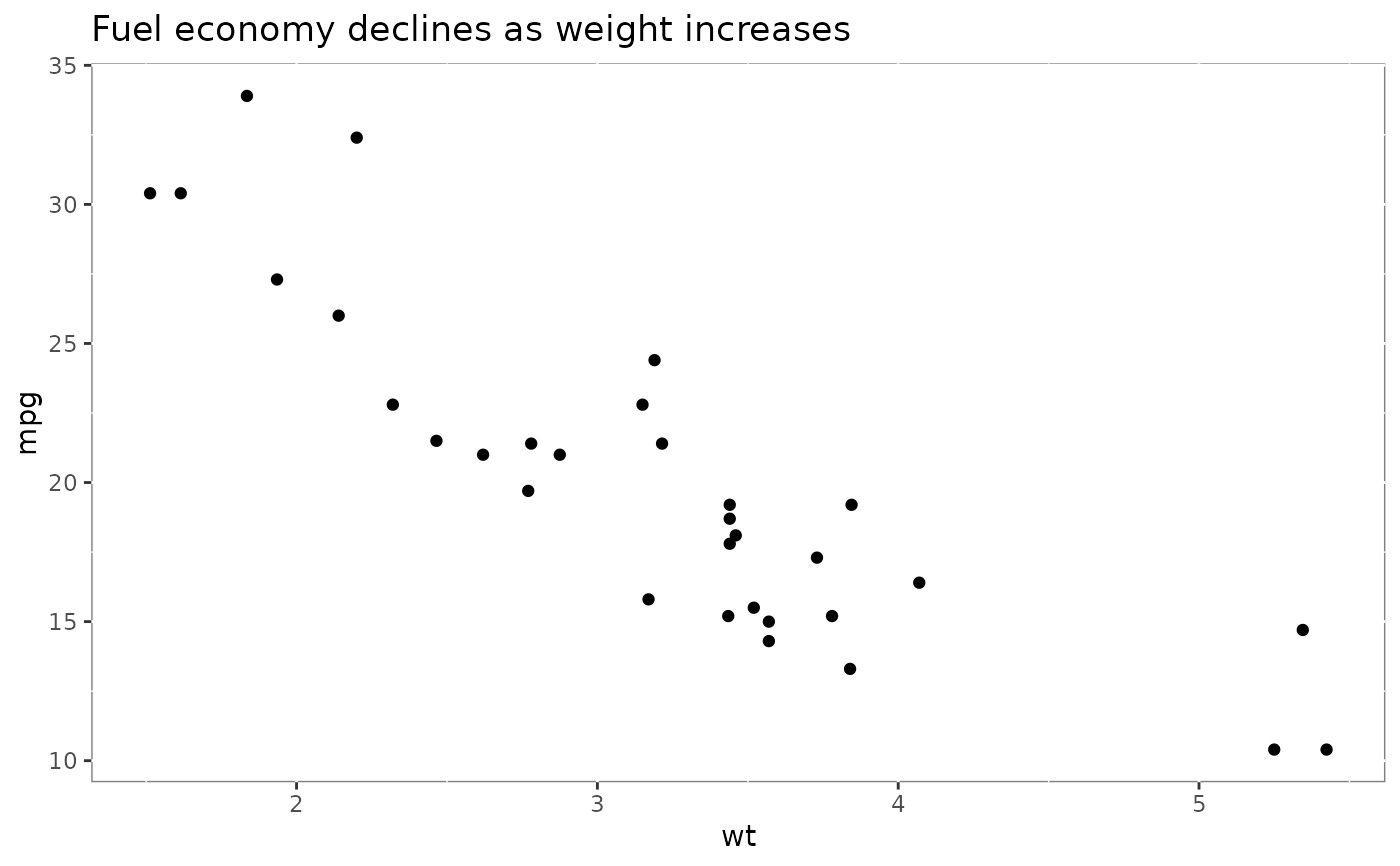
unit) - panel.background
-
绘图区域的背景,绘制在图下方(
element_rect();继承自rect) - panel.border
-
绘图区域周围的边框,绘制在绘图顶部,以便覆盖刻度线和网格线。这应该与
fill = NA一起使用(element_rect();继承自rect) - panel.spacing, panel.spacing.x, panel.spacing.y
-
小平面面板之间的间距 (
unit)。panel.spacing.x和panel.spacing.y继承自panel.spacing,也可以单独指定。 - panel.grid, panel.grid.major, panel.grid.minor, panel.grid.major.x, panel.grid.major.y, panel.grid.minor.x, panel.grid.minor.y
-
网格线(
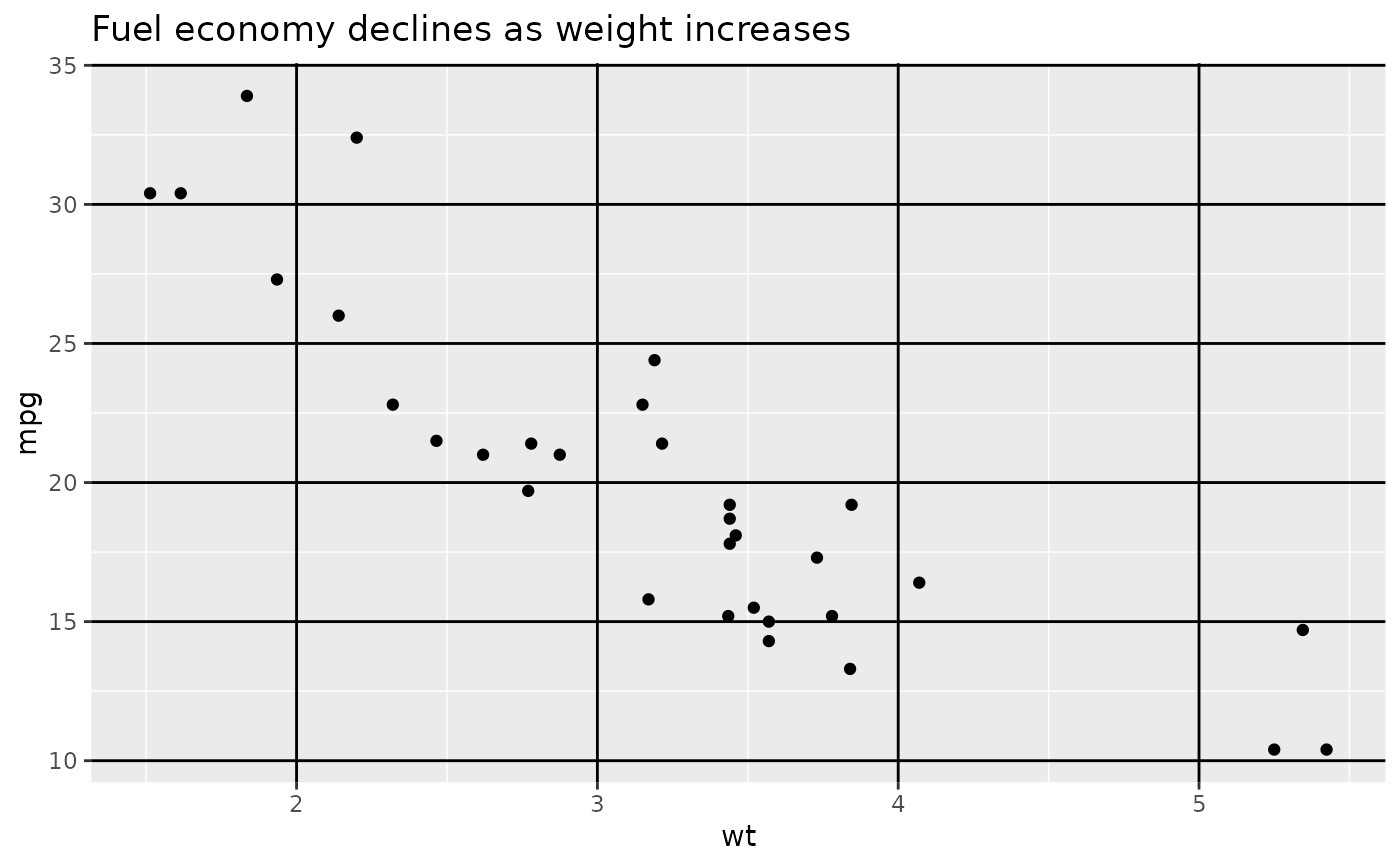
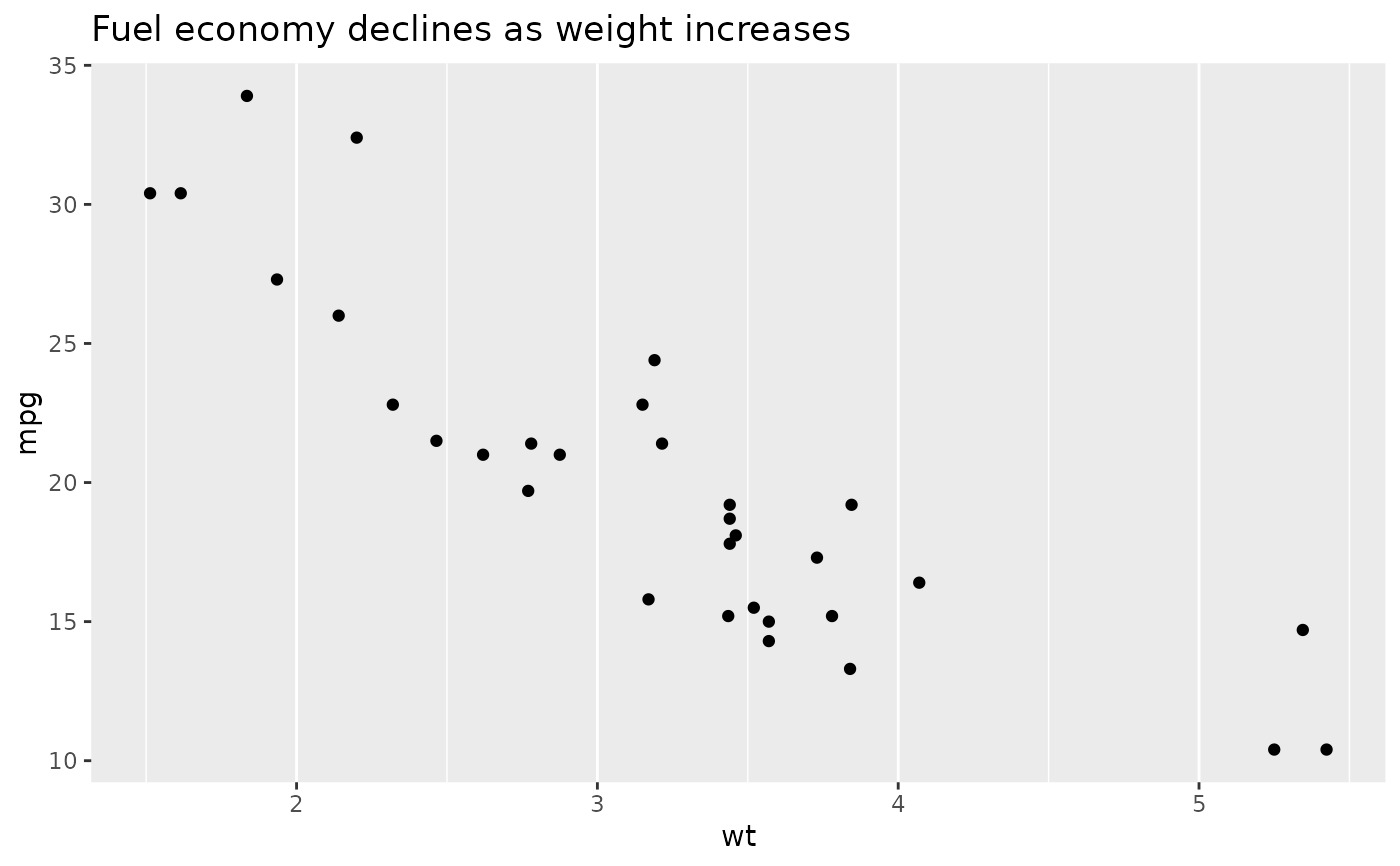
element_line())。分别指定主网格线或次网格线(使用panel.grid.major或panel.grid.minor),或为每个轴单独指定主网格线或次网格线(使用panel.grid.major.x、panel.grid.minor.x、panel.grid.major.y、panel.grid.minor.y)。 Y 轴网格线是水平的,x 轴网格线是垂直的。panel.grid.*.*继承自panel.grid.*,而panel.grid.*又继承自panel.grid,而panel.grid又继承自line - panel.ontop
-
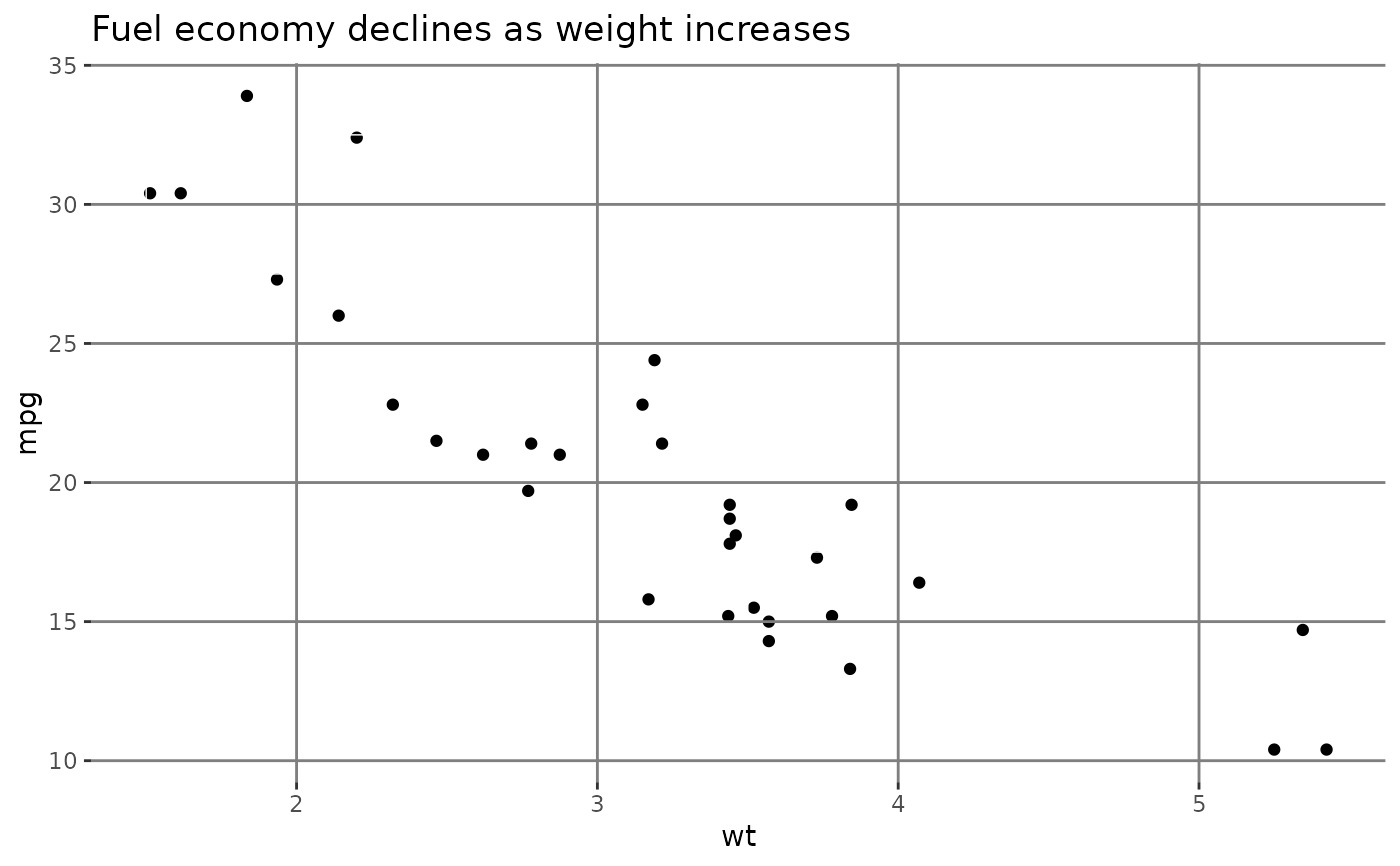
将面板(背景、网格线)放置在数据层上的选项(
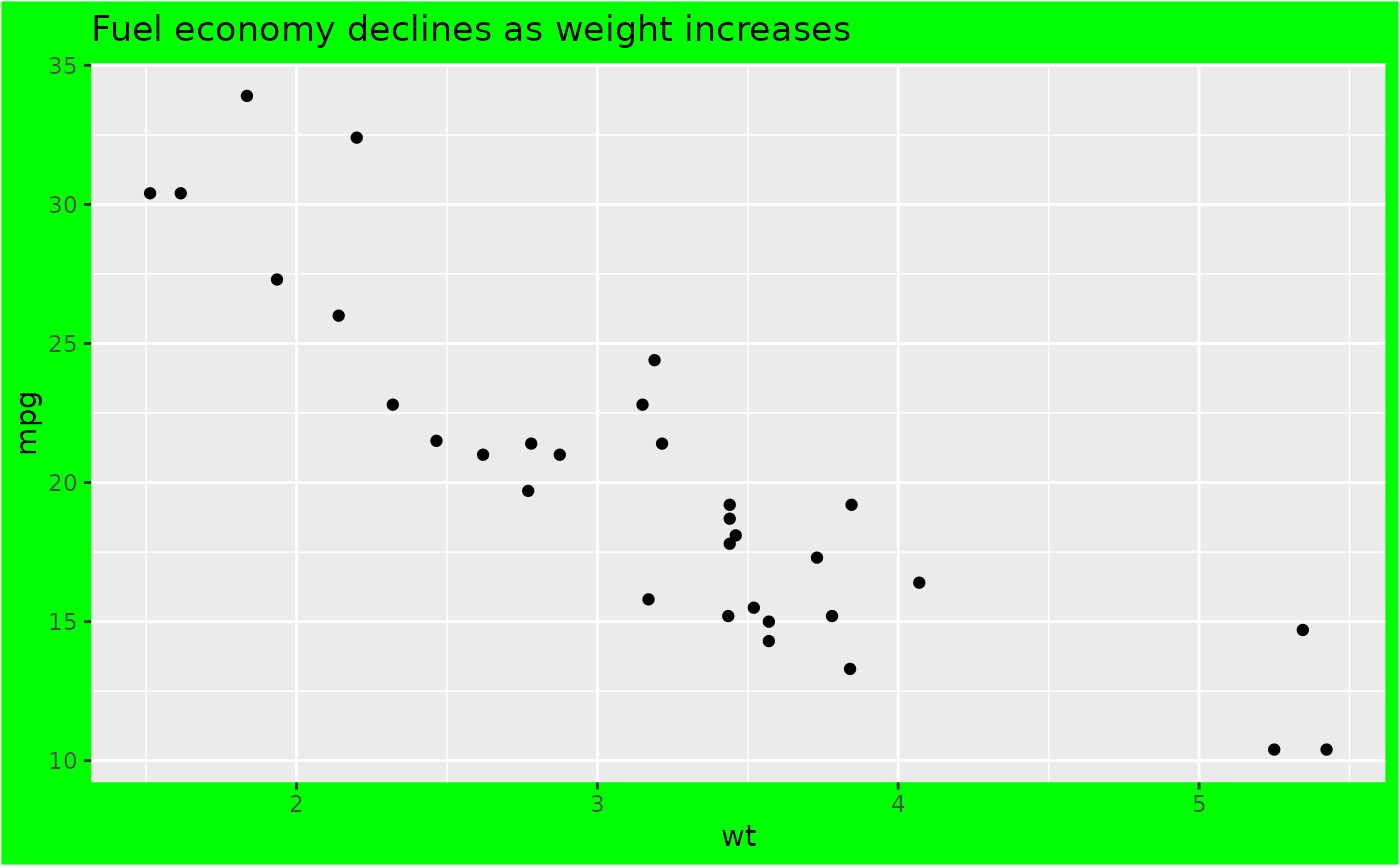
logical)。通常与透明或空白panel.background一起使用。 - plot.background
-
整个情节的背景(
element_rect();继承自rect) - plot.title
-
绘图标题(文本外观)(
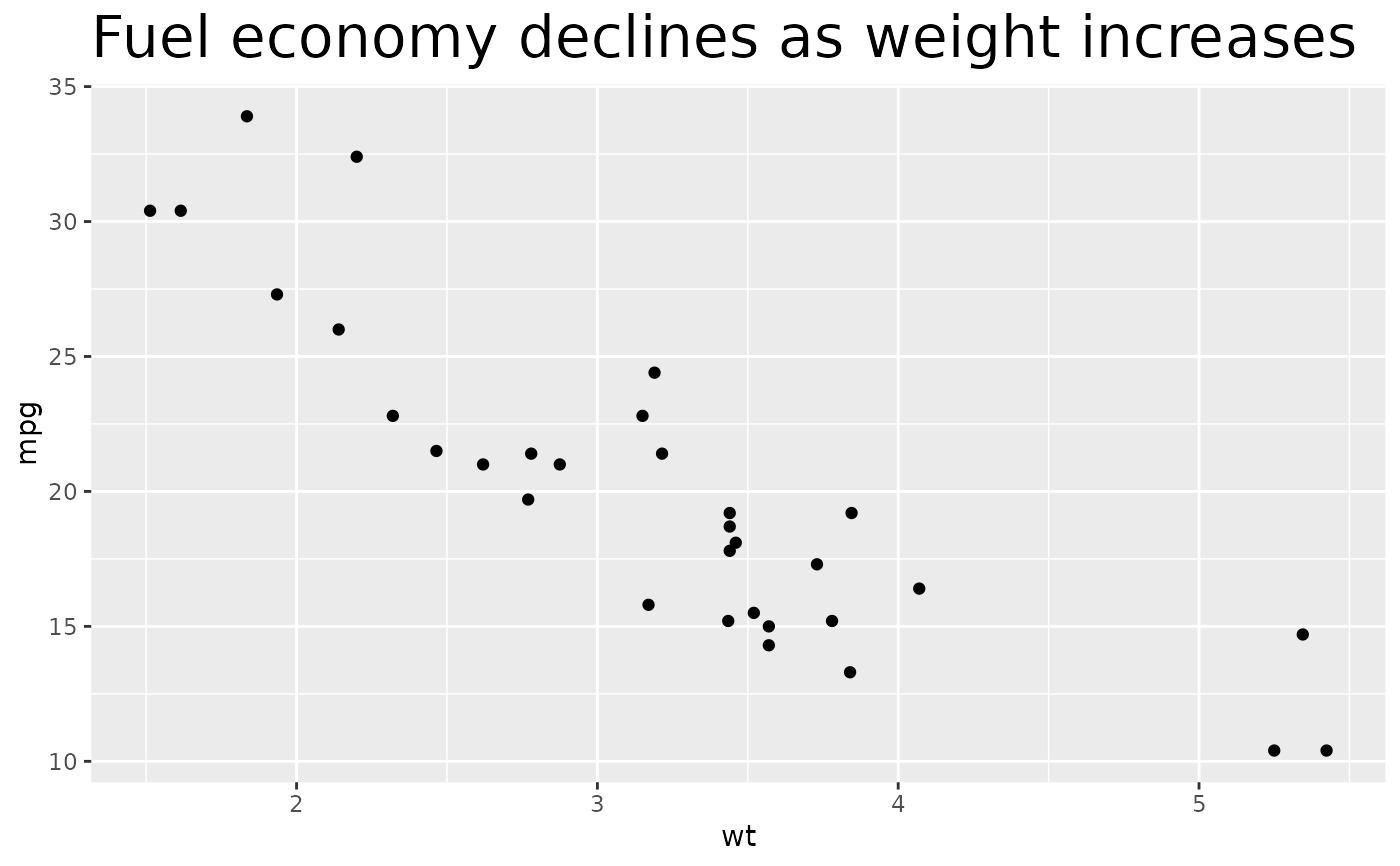
element_text();继承自title)默认左对齐 - plot.title.position, plot.caption.position
-
情节标题/副标题和标题的对齐。
plot.title.position的设置适用于标题和副标题。值"panel"(默认值)表示标题和/或说明文字与绘图面板对齐。 "plot" 值表示标题和/或说明文字与整个绘图对齐(减去边距和绘图标签的任何空间)。 - plot.subtitle
-
绘图副标题(文本外观)(
element_text();继承自title)默认左对齐 - plot.caption
-
绘图下方的标题(文本外观)(
element_text();继承自title)默认右对齐 - plot.tag
-
用于标识绘图的左上标签(文本外观)(
element_text();继承自title)默认左对齐 - plot.tag.position
-
标签的位置作为字符串("topleft"、"top"、"topright"、"left"、"right"、"bottomleft"、"bottom"、"bottomright)或坐标。如果是字符串,则需要额外空格将添加以容纳标签。
- plot.margin
-
整个图周围的边距(
unit具有上、右、下、左边距的大小) - strip.background, strip.background.x, strip.background.y
-
构面标签的背景(
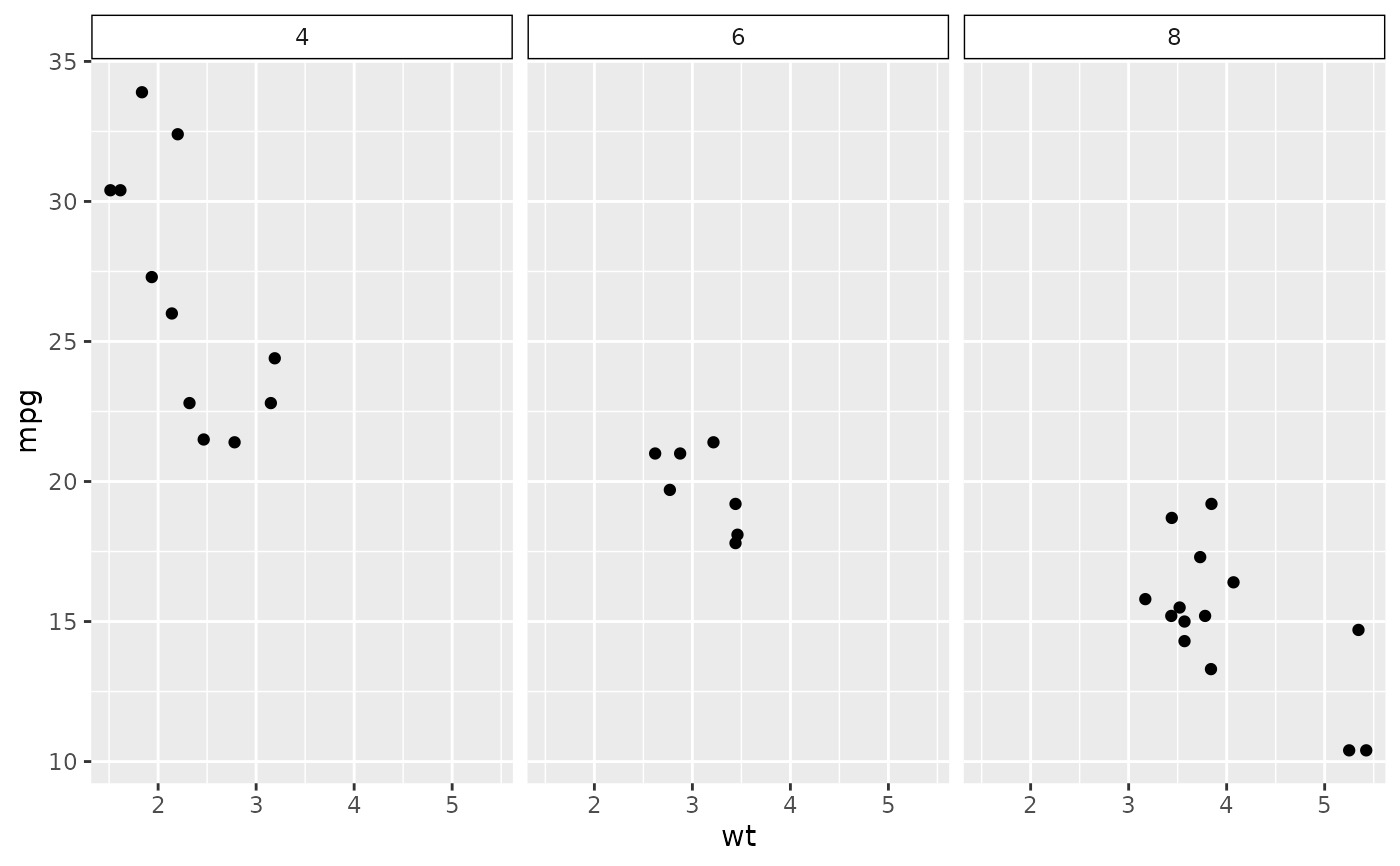
element_rect();继承自rect)。水平面背景 (strip.background.x) 和垂直面背景 (strip.background.y) 继承自strip.background或可以单独指定 - strip.clip
-
条带背景边和条带标签是否应该剪裁到条带背景的延伸范围?选项包括
"on"进行剪辑、"off"禁用剪辑或"inherit"(默认)从父视口获取剪辑设置。 - strip.placement
-
条带相对于轴的放置,"inside" 或"outside"。仅当轴和条位于图的同一侧时才重要。
- strip.text, strip.text.x, strip.text.y, strip.text.x.top, strip.text.x.bottom, strip.text.y.left, strip.text.y.right
-
分面标签(
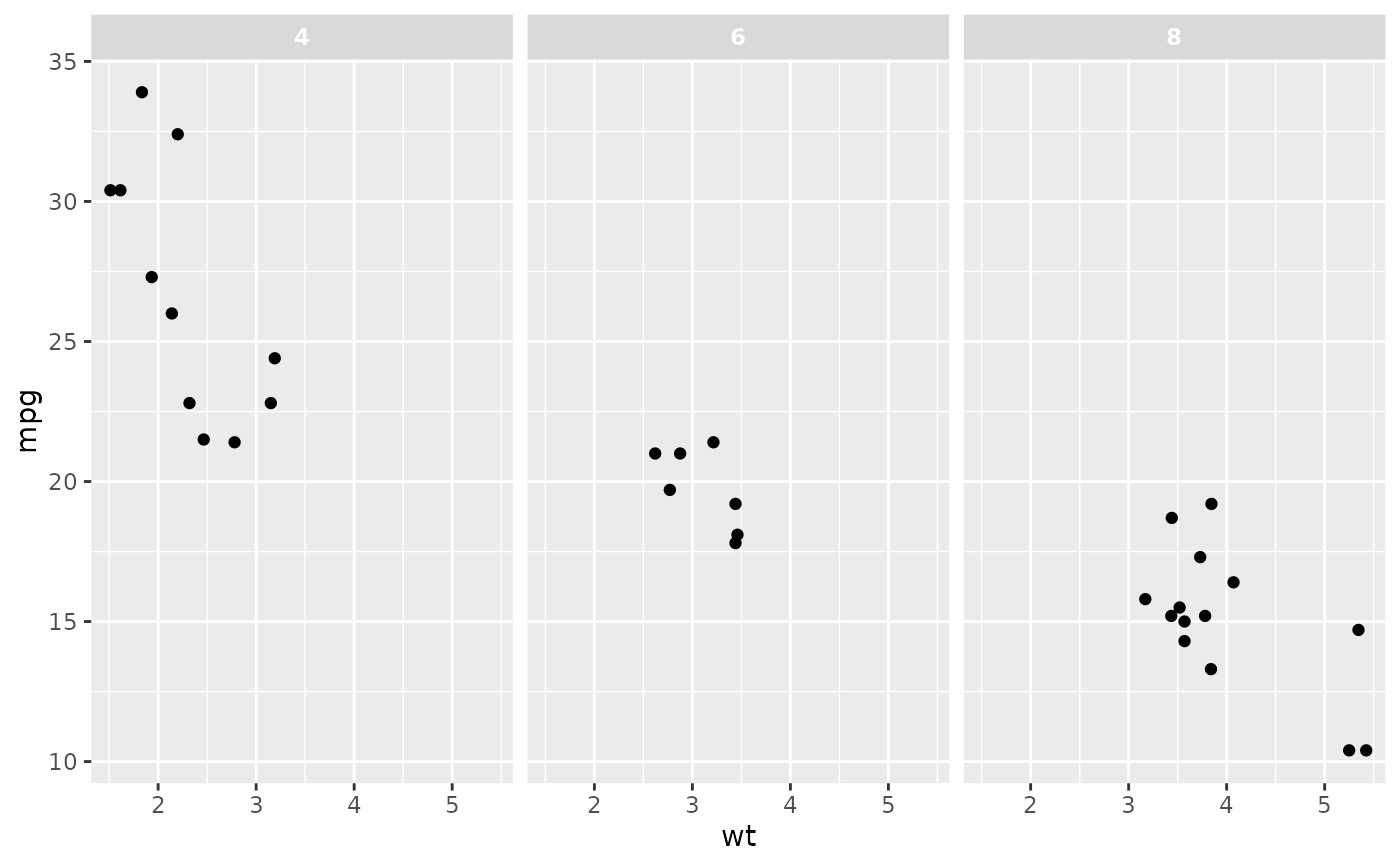
element_text();继承自text)。水平面标签 (strip.text.x) 和垂直面标签 (strip.text.y) 继承自strip.text或可以单独指定。 Facet strips 具有专用的 position-dependent 主题元素(strip.text.x.top、strip.text.x.bottom、strip.text.y.left、strip.text.y.right),它们分别继承自strip.text.x和strip.text.y。因此,一些主题样式需要应用于 position-dependent 元素而不是父元素 - strip.switch.pad.grid
-
切换条带时条带和轴之间的空间(
unit) - strip.switch.pad.wrap
-
切换条带时条带和轴之间的空间(
unit) - ...
-
附加元素规范不属于基本 ggplot2 的一部分。一般来说,这些也应该在
element tree参数中定义。 - complete
-
如果这是一个完整的主题,例如
theme_grey()返回的主题,请将其设置为TRUE。添加到 ggplot 对象时,完整主题的行为有所不同。此外,当设置complete = TRUE时,所有元素都将被设置为从空白元素继承。 - validate
-
TRUE运行validate_element()、FALSE绕过检查。
主题传承
主题元素按层次继承其他主题元素的属性。例如, axis.title.x.bottom 继承自 axis.title.x ,而 axis.title.x 又继承自 axis.title ,而 axis.title 又继承自 text 。所有文本元素直接或间接继承自text;所有线条均继承自 line ,所有矩形对象均继承自 rect 。这意味着您可以通过设置单个高级组件来修改多个元素的外观。
在 vignette("ggplot2-specs") 中了解有关设置这些美学的更多信息。
也可以看看
+.gg() 和 %+replace% 、 element_blank() 、 element_line() 、 element_rect() 和 element_text() 了解特定主题元素的详细信息。
例子
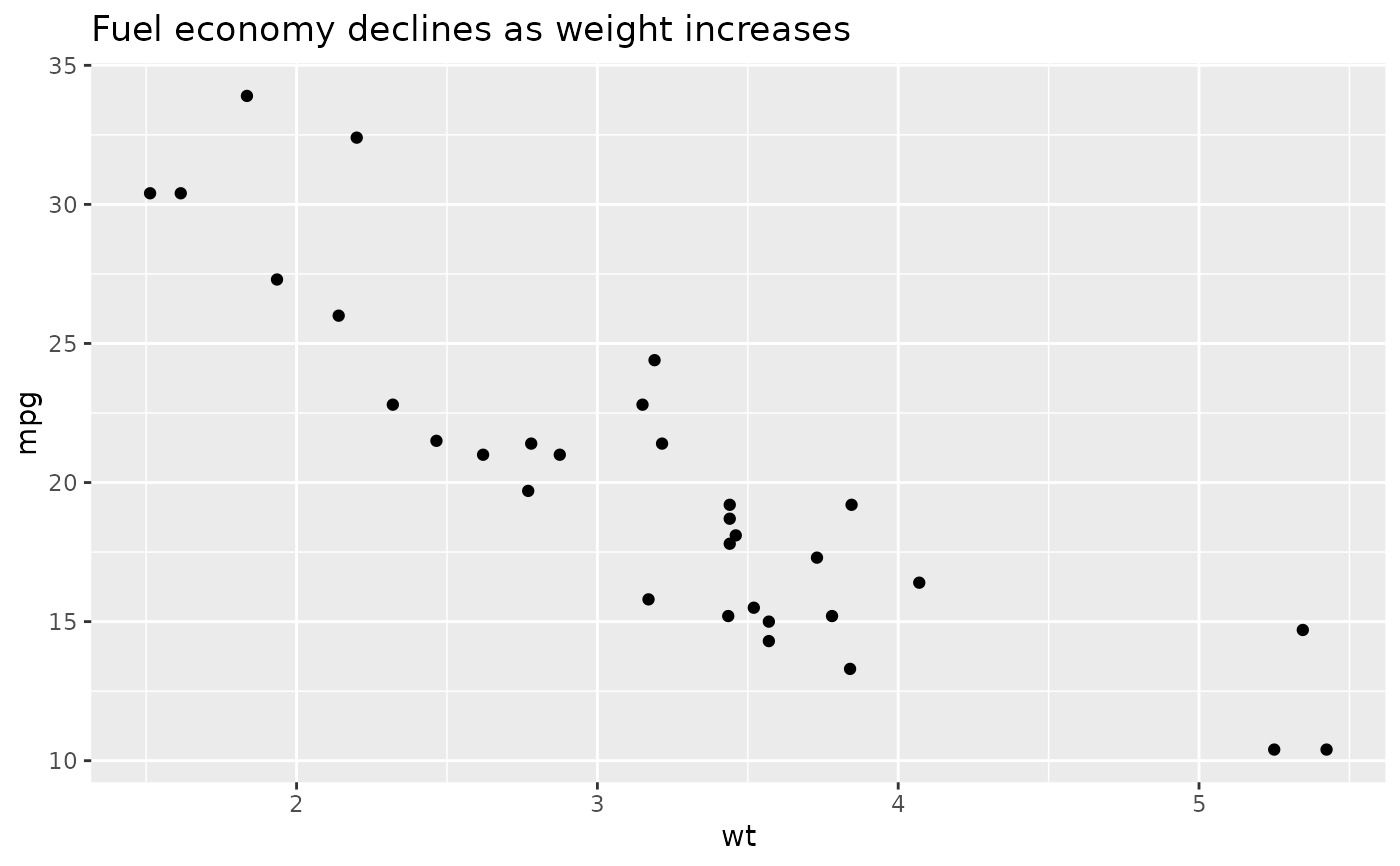
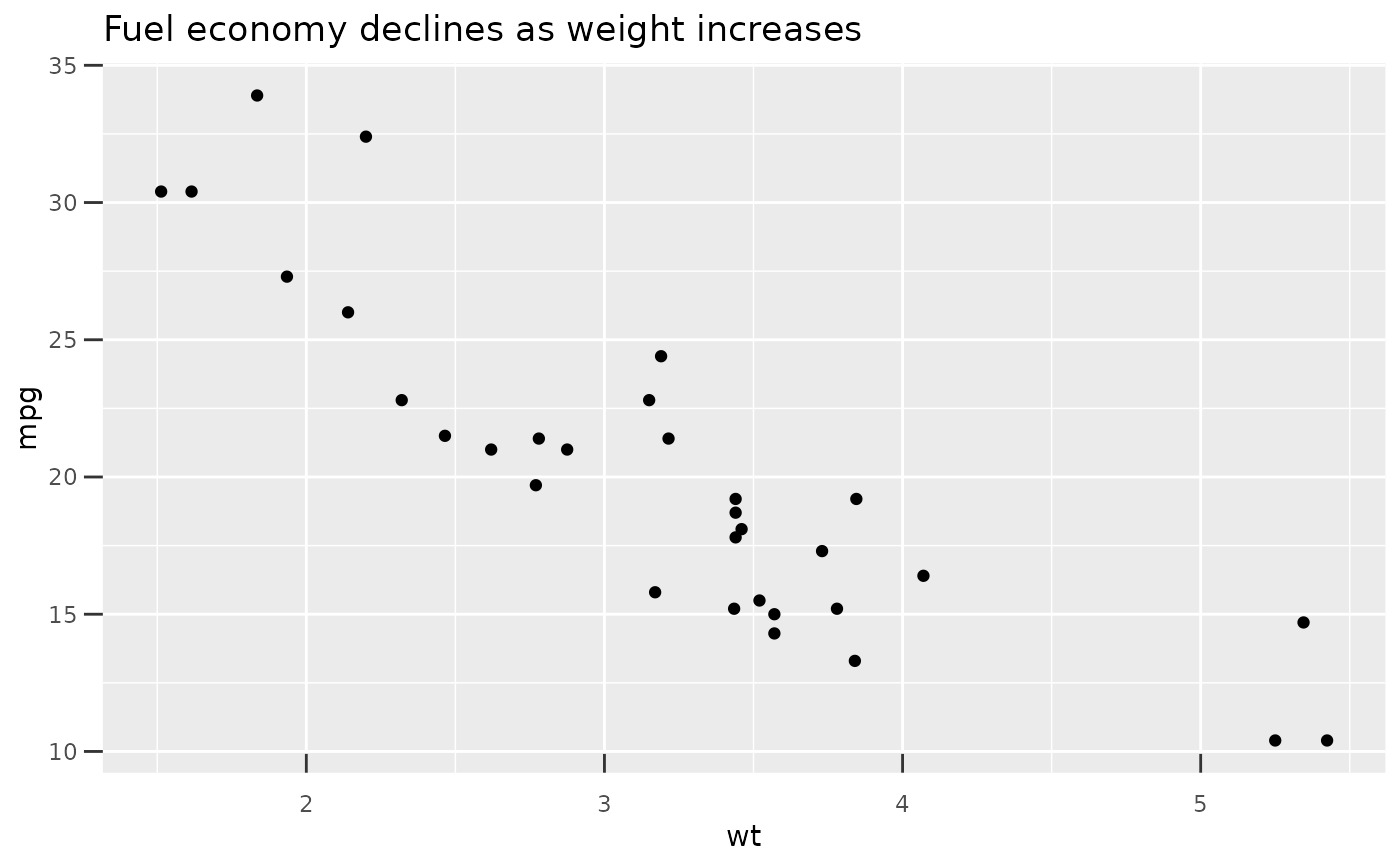
p1 <- ggplot(mtcars, aes(wt, mpg)) +
geom_point() +
labs(title = "Fuel economy declines as weight increases")
p1
 # Plot ---------------------------------------------------------------------
p1 + theme(plot.title = element_text(size = rel(2)))
 p1 + theme(plot.background = element_rect(fill = "green"))
 # Panels --------------------------------------------------------------------
p1 + theme(panel.background = element_rect(fill = "white", colour = "grey50"))
 p1 + theme(panel.border = element_rect(linetype = "dashed", fill = NA))
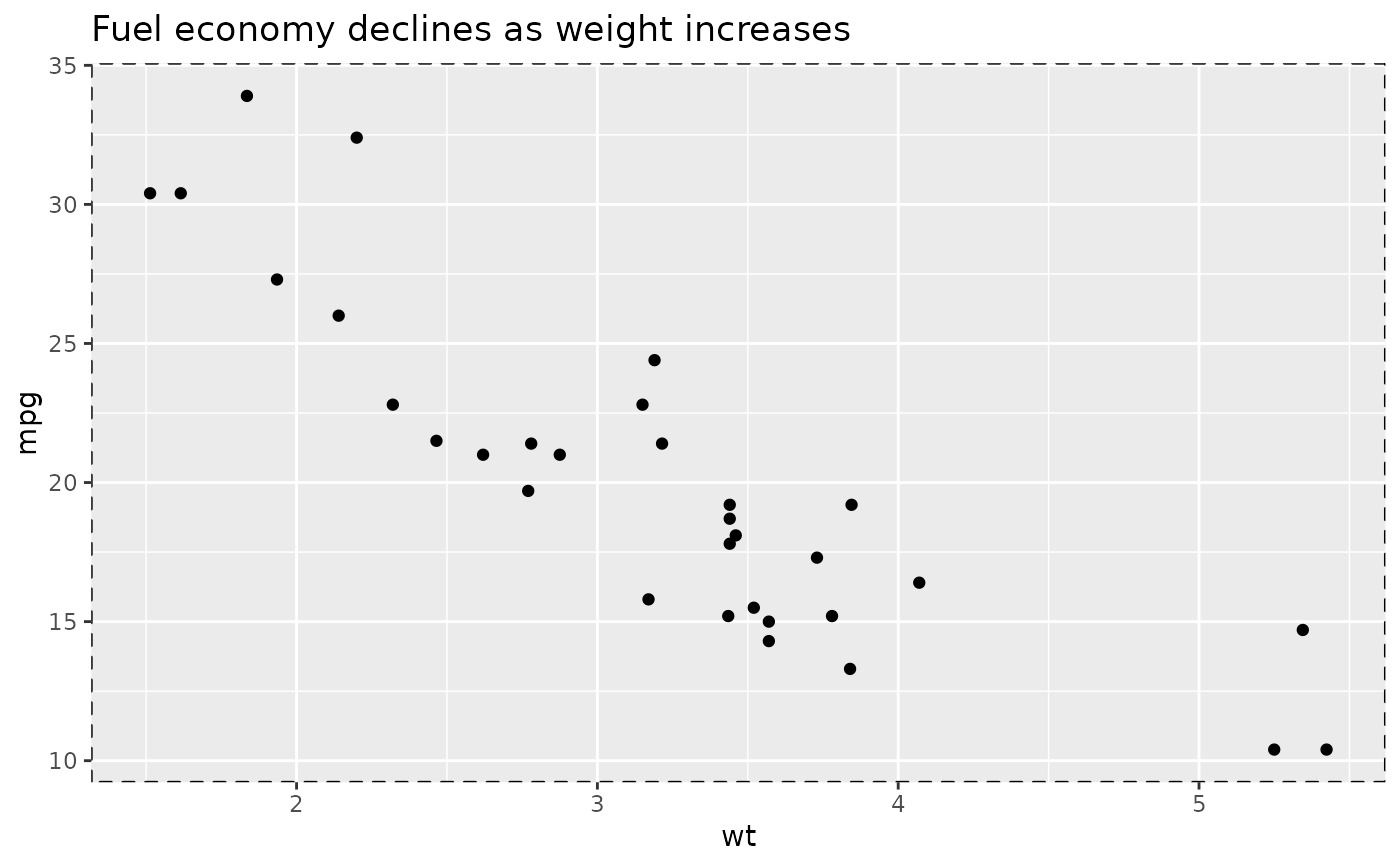 p1 + theme(panel.grid.major = element_line(colour = "black"))
 p1 + theme(
panel.grid.major.y = element_blank(),
panel.grid.minor.y = element_blank()
)
 # Put gridlines on top of data
p1 + theme(
panel.background = element_rect(fill = NA),
panel.grid.major = element_line(colour = "grey50"),
panel.ontop = TRUE
)
 # Axes ----------------------------------------------------------------------
# Change styles of axes texts and lines
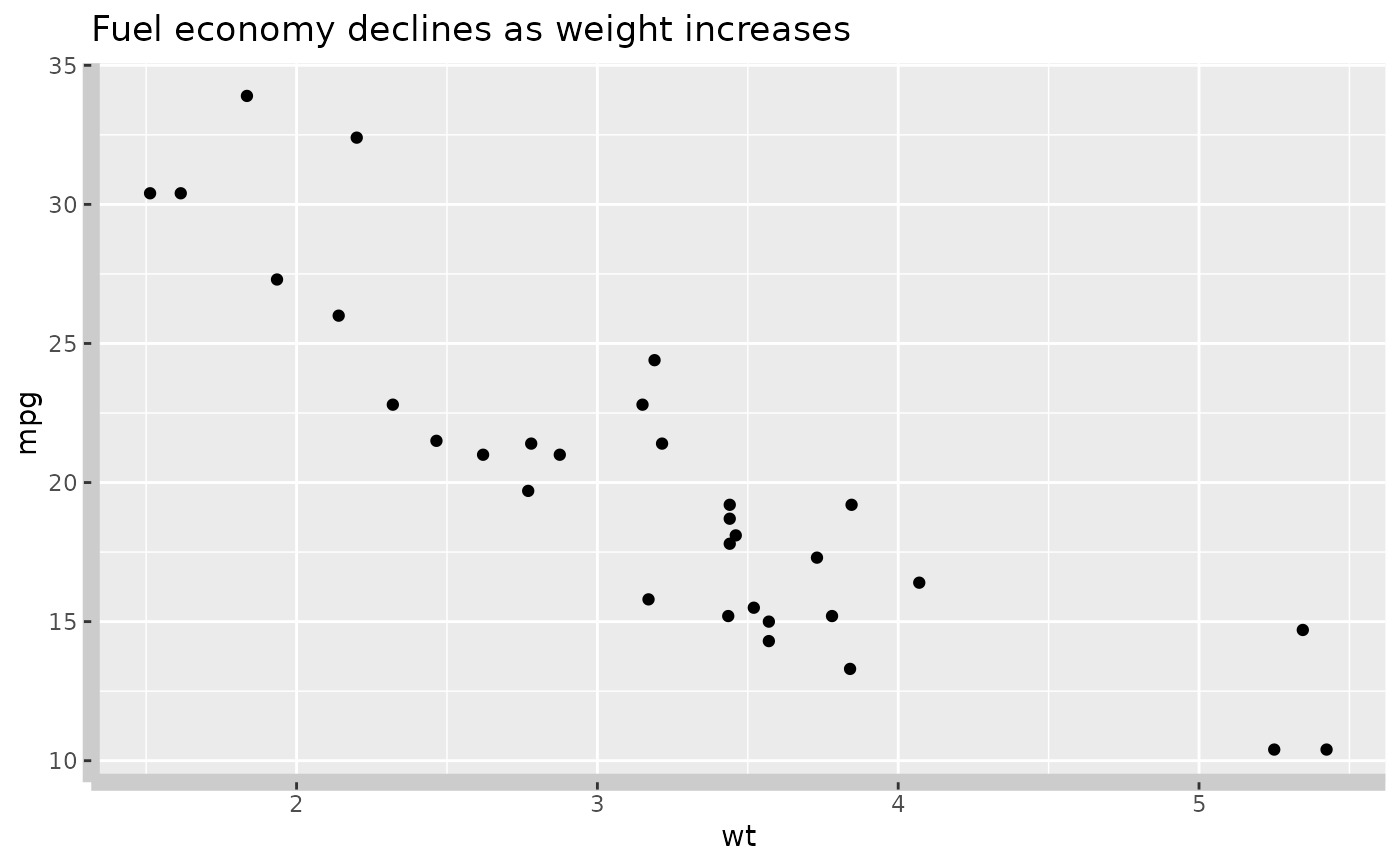
p1 + theme(axis.line = element_line(linewidth = 3, colour = "grey80"))
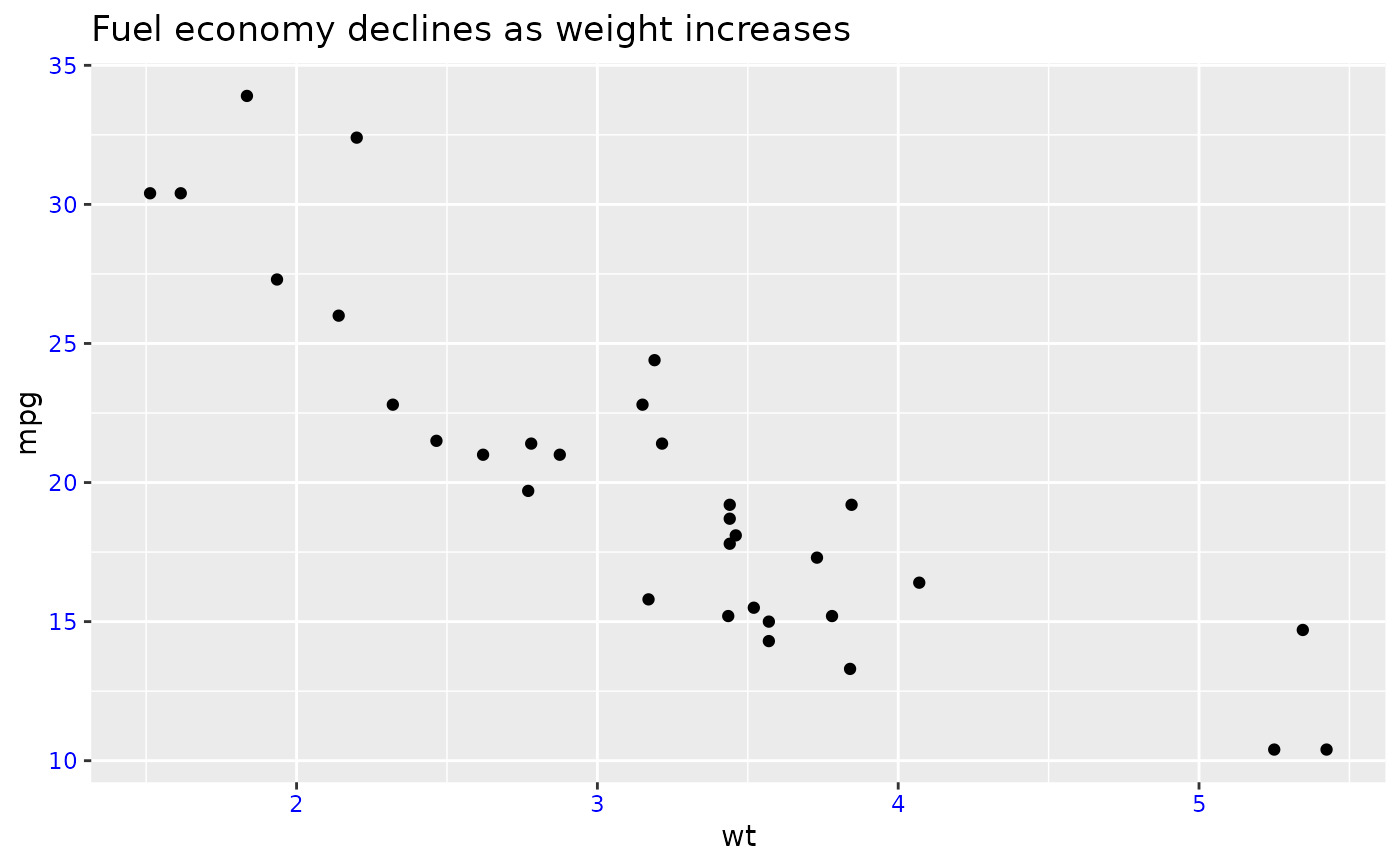
 p1 + theme(axis.text = element_text(colour = "blue"))
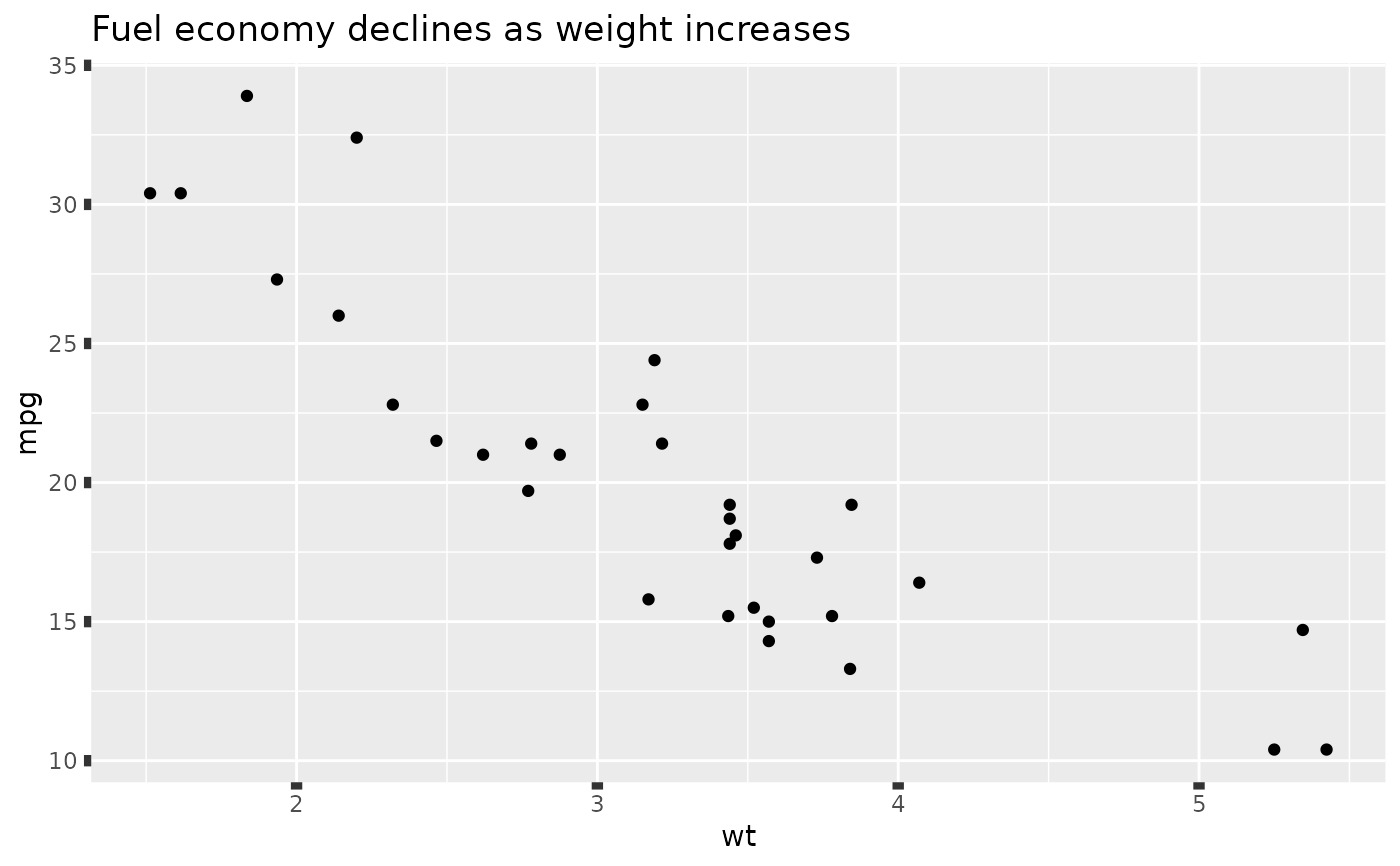
 p1 + theme(axis.ticks = element_line(linewidth = 2))
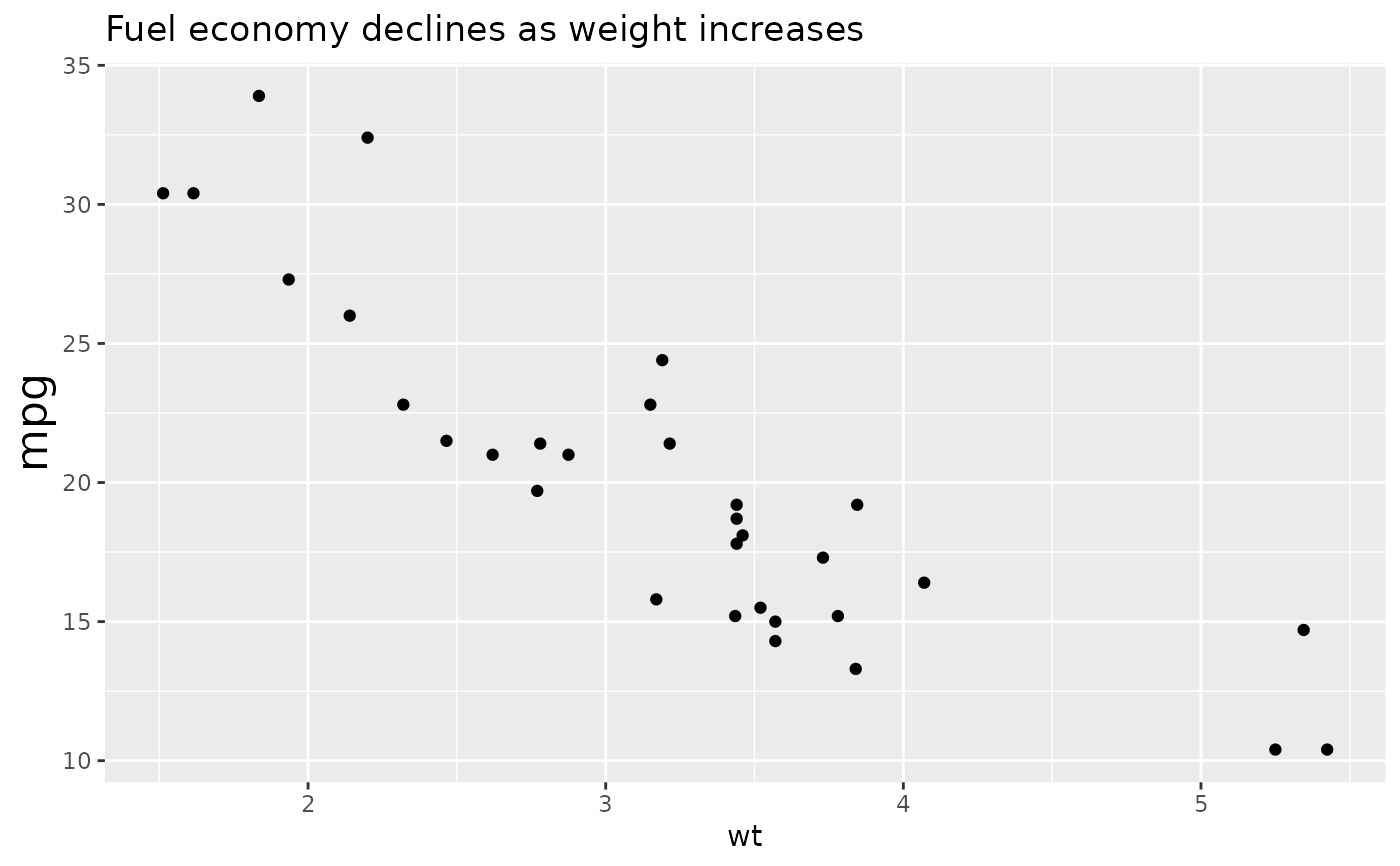
 # Change the appearance of the y-axis title
p1 + theme(axis.title.y = element_text(size = rel(1.5), angle = 90))
 # Make ticks point outwards on y-axis and inwards on x-axis
p1 + theme(
axis.ticks.length.y = unit(.25, "cm"),
axis.ticks.length.x = unit(-.25, "cm"),
axis.text.x = element_text(margin = margin(t = .3, unit = "cm"))
)
 # \donttest{
# Legend --------------------------------------------------------------------
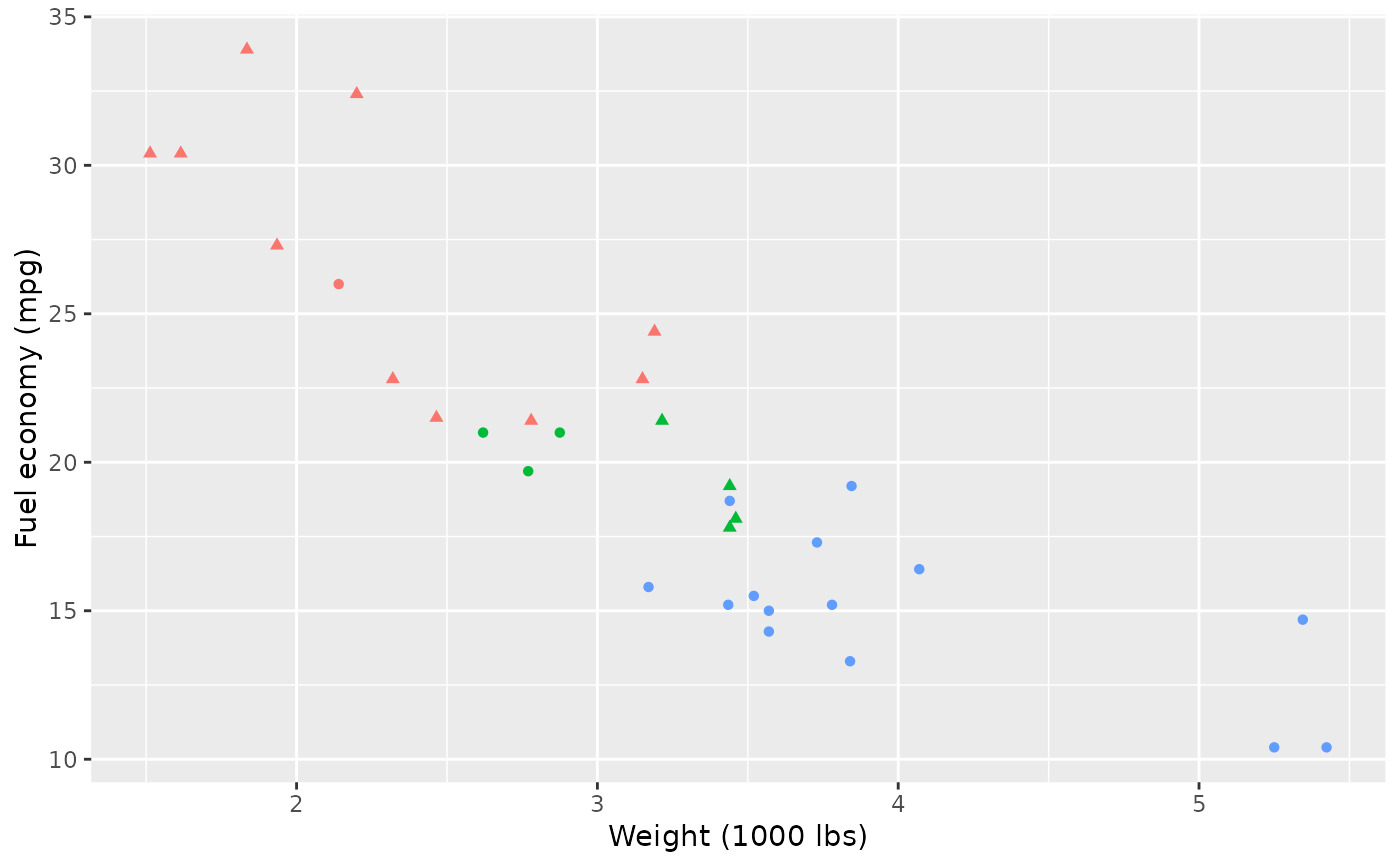
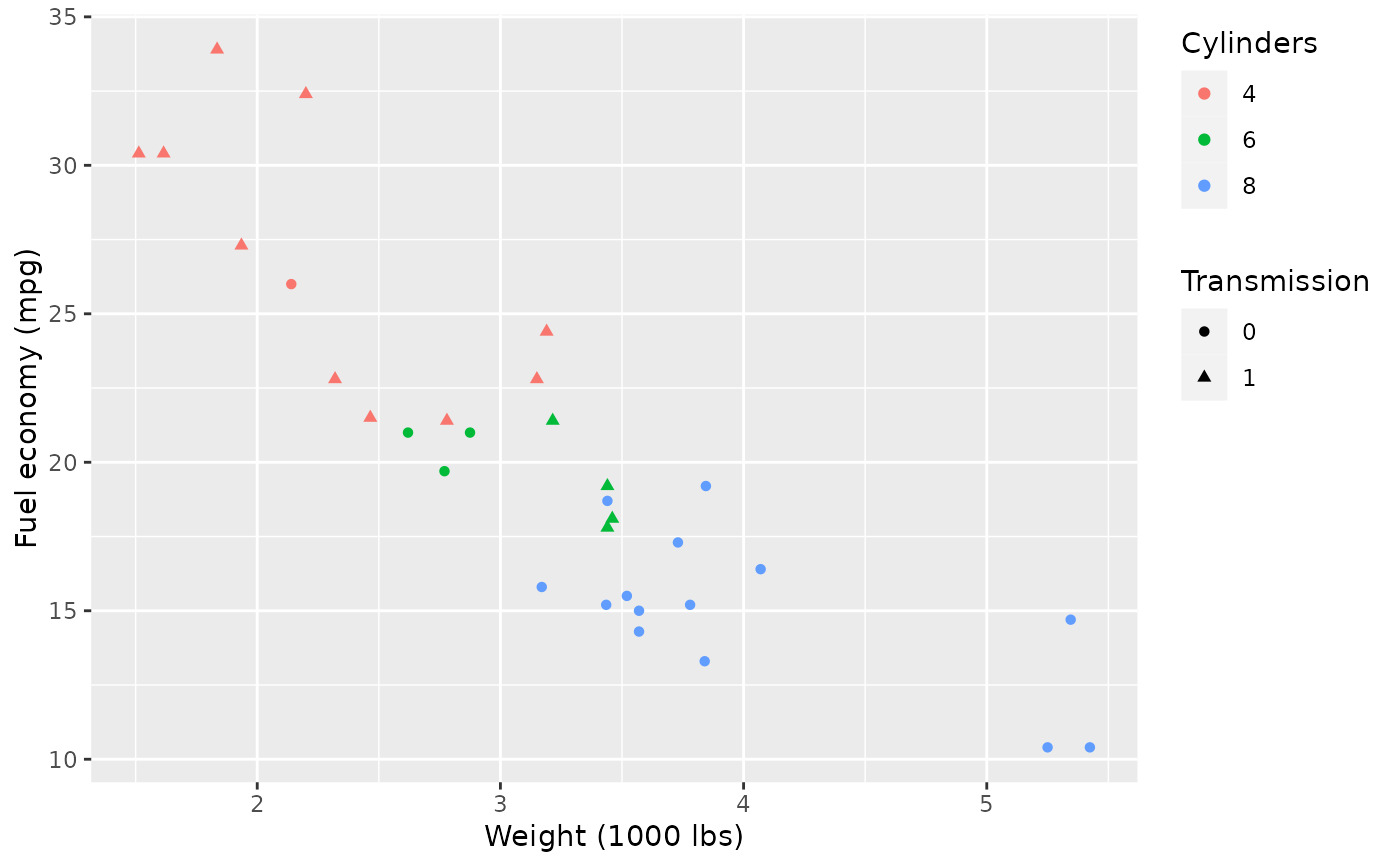
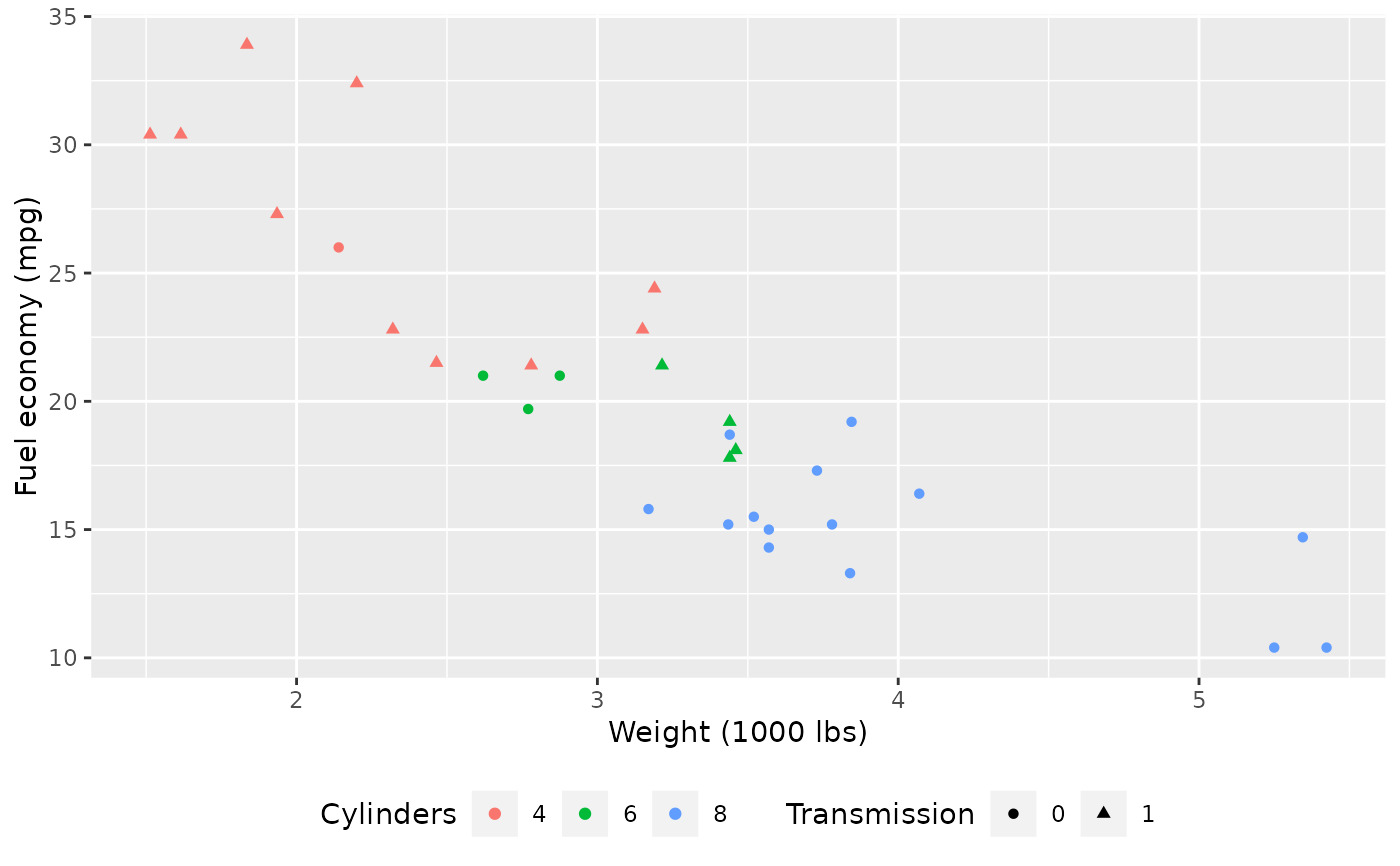
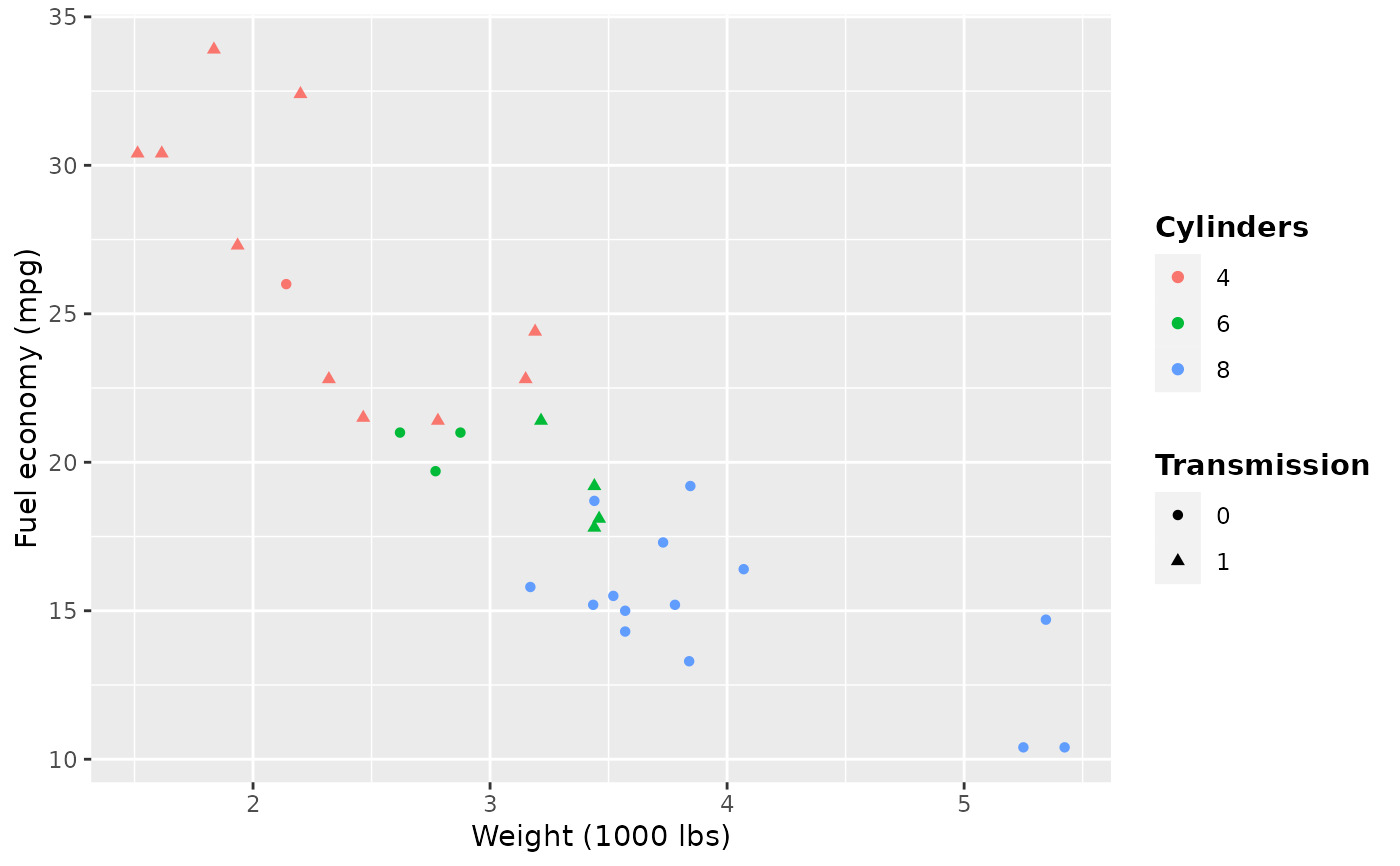
p2 <- ggplot(mtcars, aes(wt, mpg)) +
geom_point(aes(colour = factor(cyl), shape = factor(vs))) +
labs(
x = "Weight (1000 lbs)",
y = "Fuel economy (mpg)",
colour = "Cylinders",
shape = "Transmission"
)
p2
 # Position
p2 + theme(legend.position = "none")
 p2 + theme(legend.justification = "top")
 p2 + theme(legend.position = "bottom")
 # Or place legends inside the plot using relative coordinates between 0 and 1
# legend.justification sets the corner that the position refers to
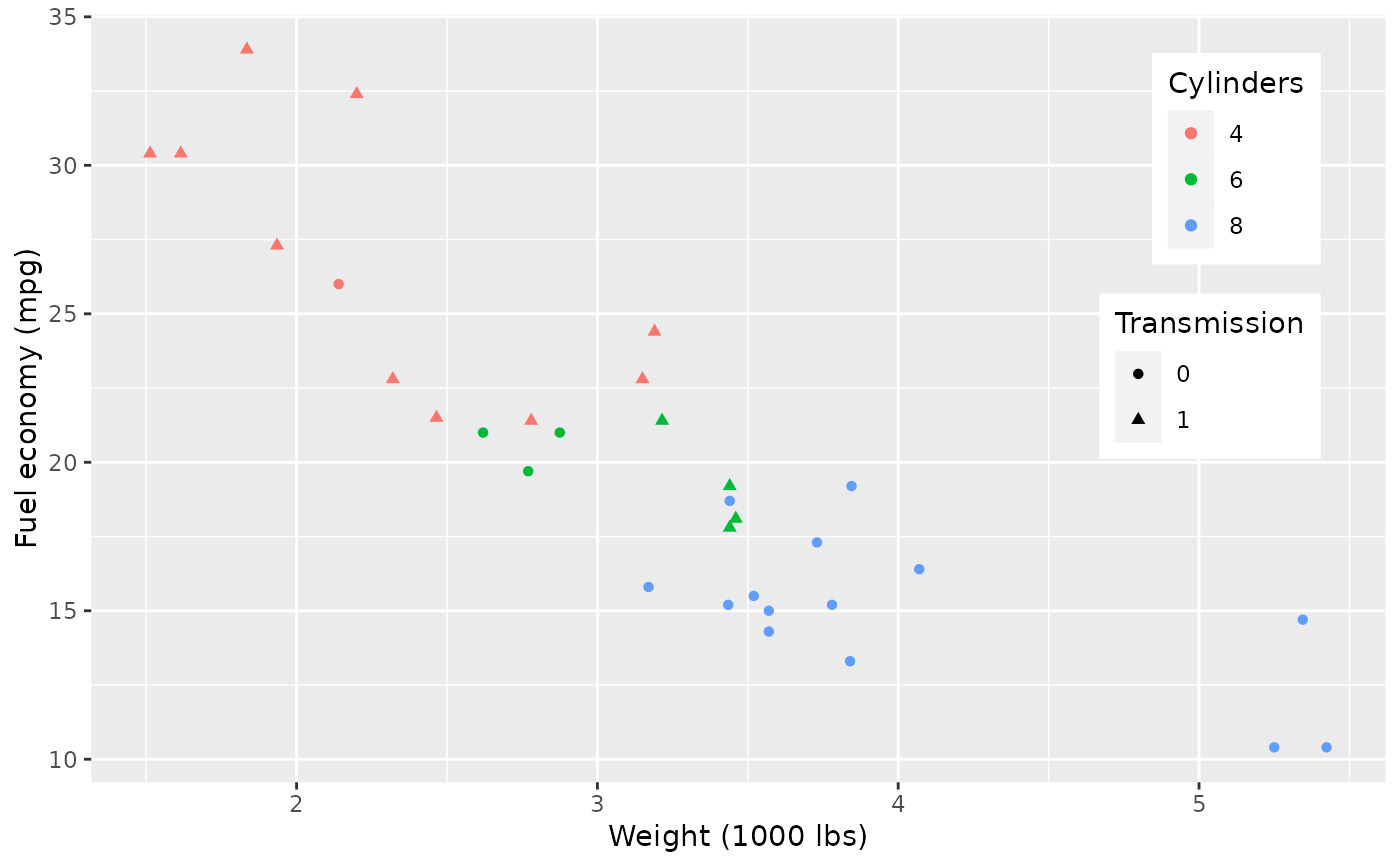
p2 + theme(
legend.position = c(.95, .95),
legend.justification = c("right", "top"),
legend.box.just = "right",
legend.margin = margin(6, 6, 6, 6)
)
 # The legend.box properties work similarly for the space around
# all the legends
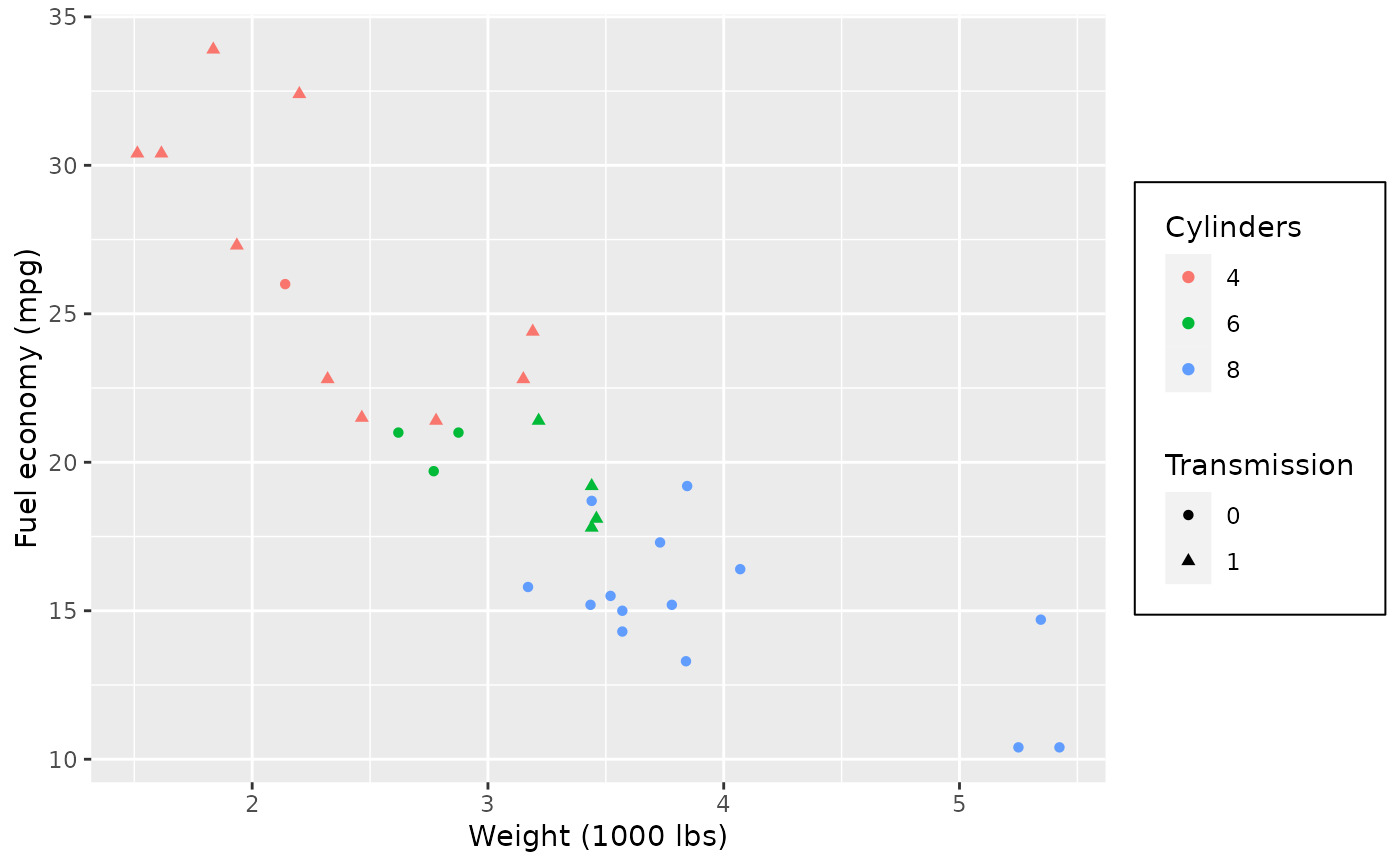
p2 + theme(
legend.box.background = element_rect(),
legend.box.margin = margin(6, 6, 6, 6)
)
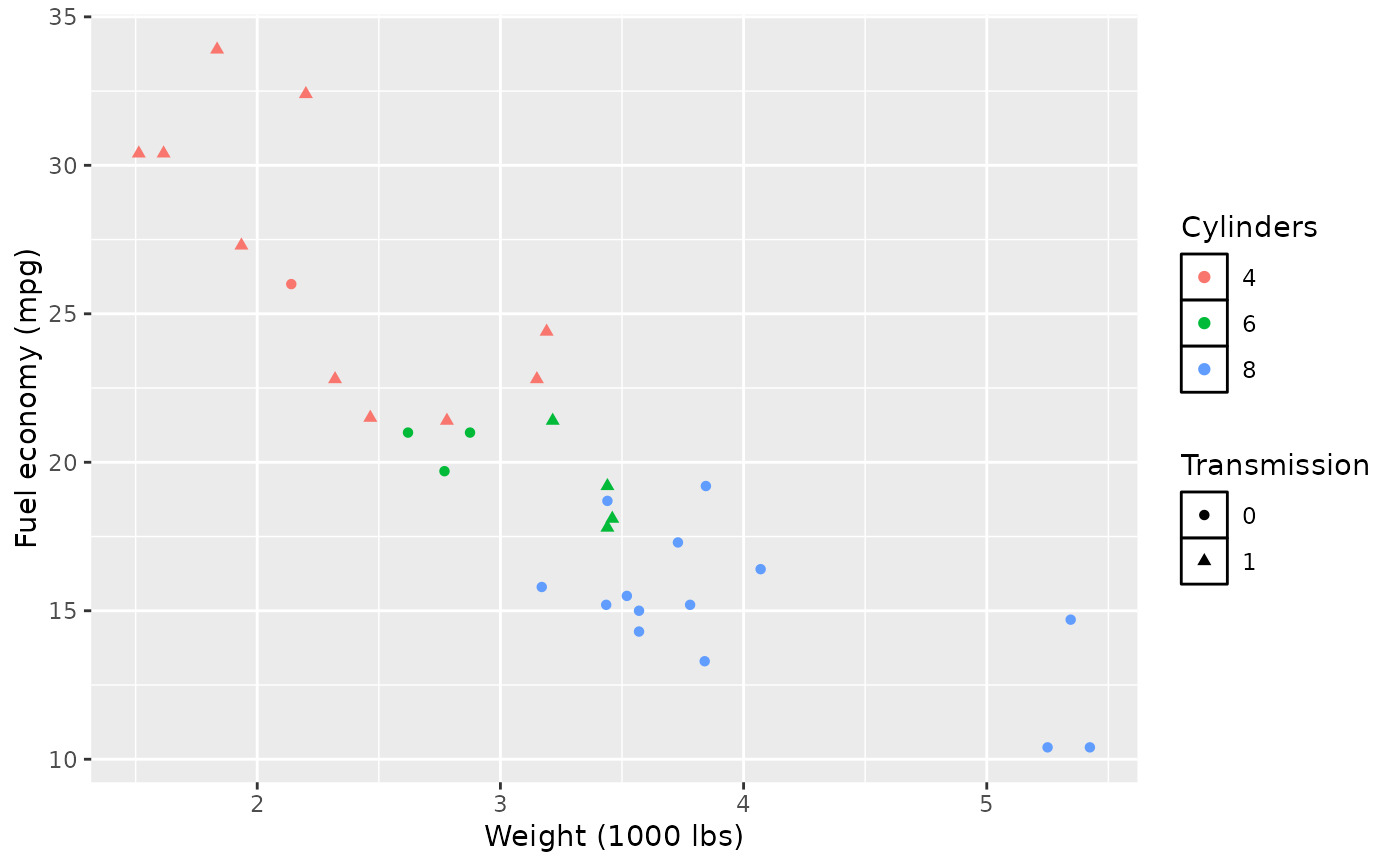
 # You can also control the display of the keys
# and the justification related to the plot area can be set
p2 + theme(legend.key = element_rect(fill = "white", colour = "black"))
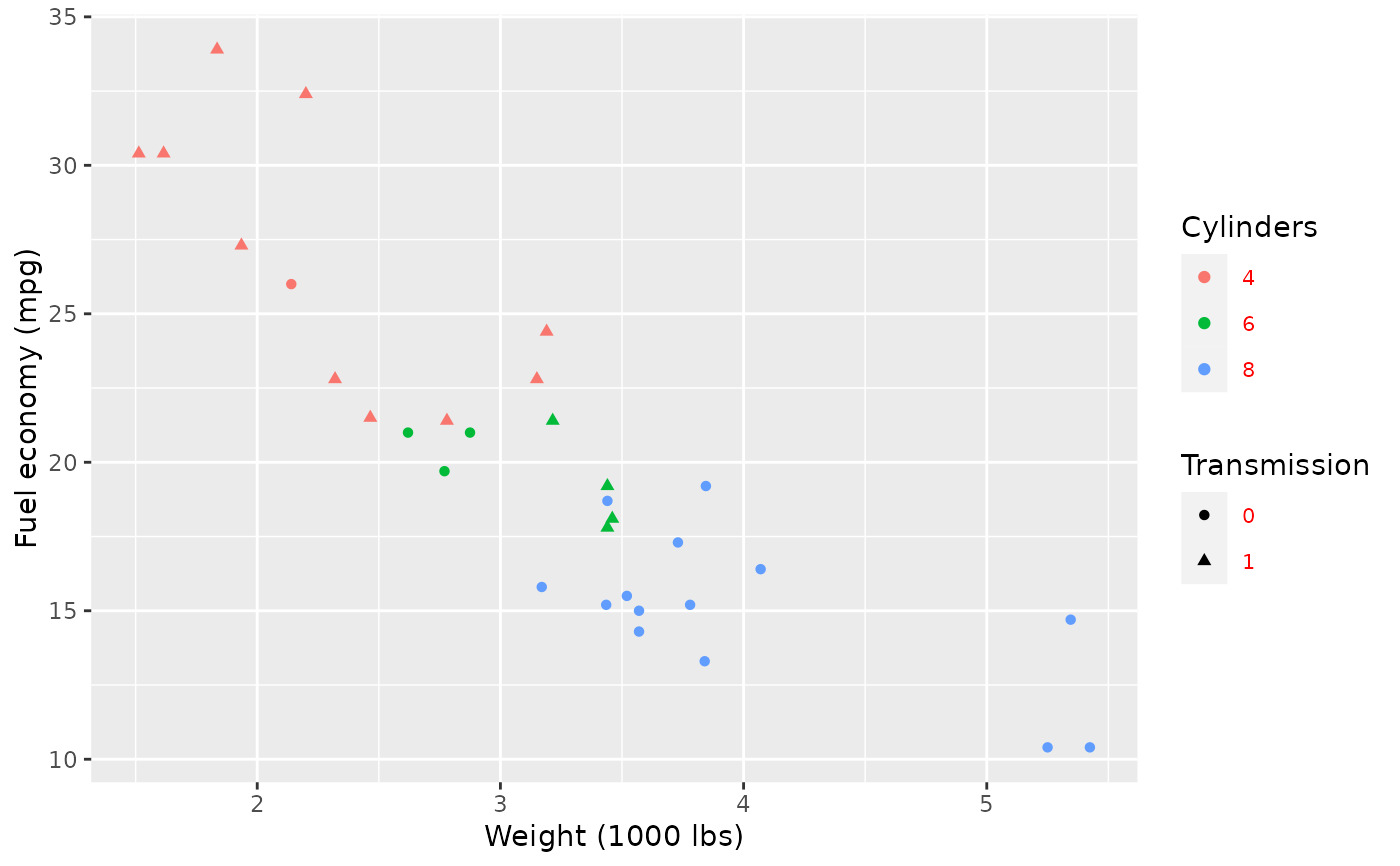
 p2 + theme(legend.text = element_text(size = 8, colour = "red"))
 p2 + theme(legend.title = element_text(face = "bold"))
 # Strips --------------------------------------------------------------------
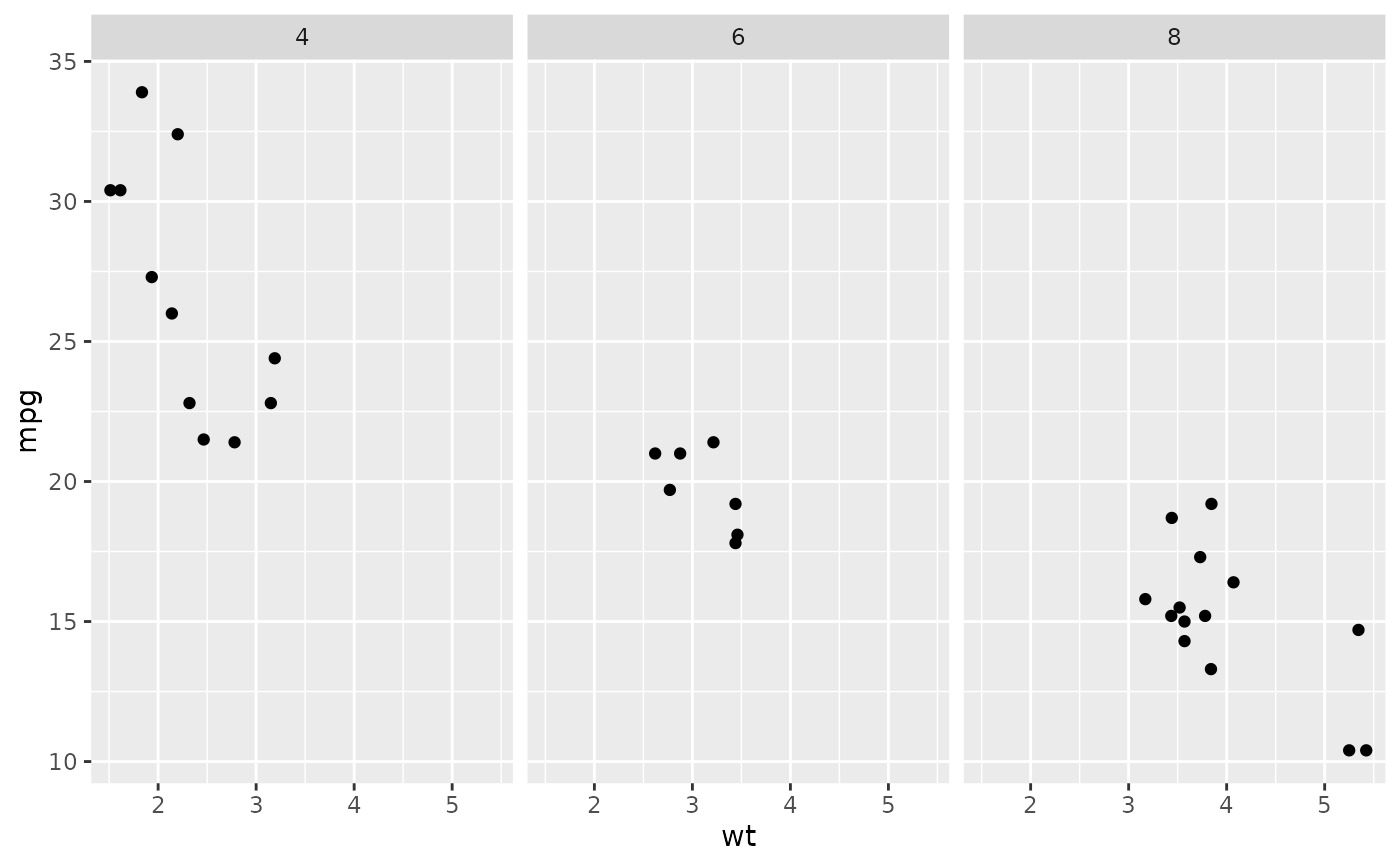
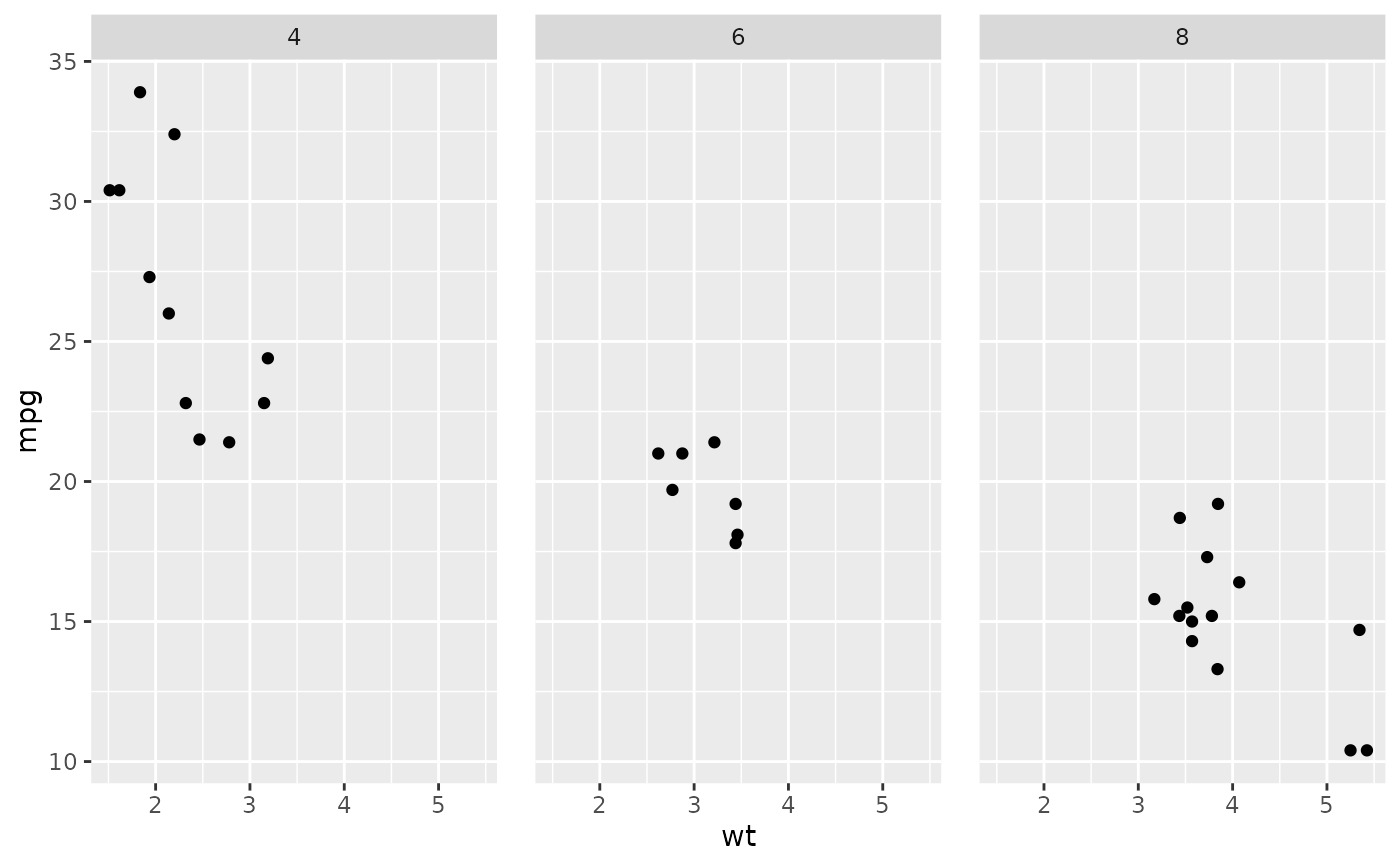
p3 <- ggplot(mtcars, aes(wt, mpg)) +
geom_point() +
facet_wrap(~ cyl)
p3
 p3 + theme(strip.background = element_rect(colour = "black", fill = "white"))
 p3 + theme(strip.text.x = element_text(colour = "white", face = "bold"))
 # More direct strip.text.x here for top
# as in the facet_wrap the default strip.position is "top"
p3 + theme(strip.text.x.top = element_text(colour = "white", face = "bold"))
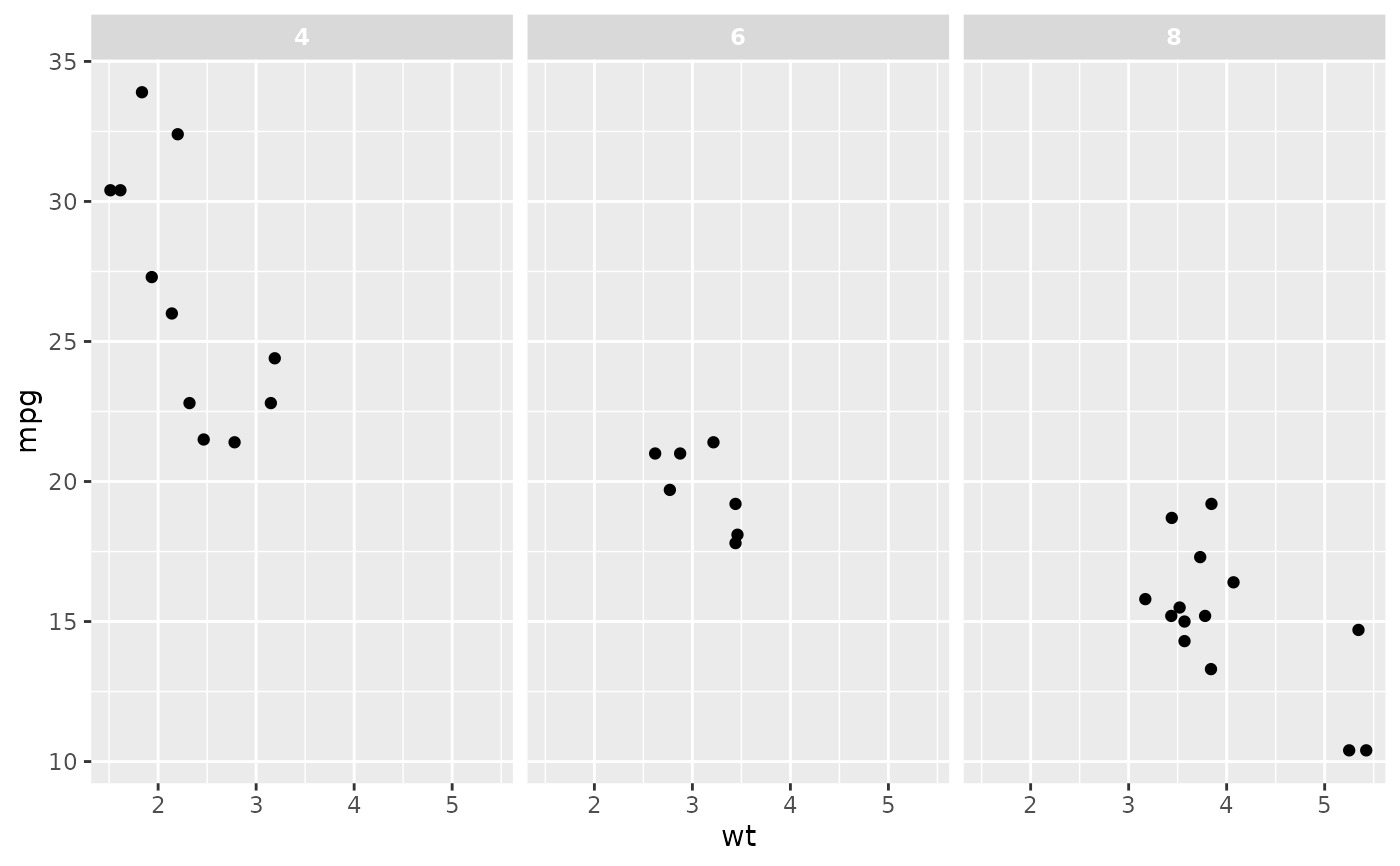 p3 + theme(panel.spacing = unit(1, "lines"))
 # }
# }
相关用法
- R ggplot2 theme_get 获取、设置和修改活动主题
- R ggplot2 annotation_logticks 注释:记录刻度线
- R ggplot2 vars 引用分面变量
- R ggplot2 position_stack 将重叠的对象堆叠在一起
- R ggplot2 geom_qq 分位数-分位数图
- R ggplot2 geom_spoke 由位置、方向和距离参数化的线段
- R ggplot2 geom_quantile 分位数回归
- R ggplot2 geom_text 文本
- R ggplot2 get_alt_text 从绘图中提取替代文本
- R ggplot2 annotation_custom 注释:自定义grob
- R ggplot2 geom_ribbon 函数区和面积图
- R ggplot2 stat_ellipse 计算法行数据椭圆
- R ggplot2 resolution 计算数值向量的“分辨率”
- R ggplot2 geom_boxplot 盒须图(Tukey 风格)
- R ggplot2 lims 设置规模限制
- R ggplot2 geom_hex 二维箱计数的六边形热图
- R ggplot2 scale_gradient 渐变色阶
- R ggplot2 scale_shape 形状比例,又称字形
- R ggplot2 geom_bar 条形图
- R ggplot2 draw_key 图例的关键字形
- R ggplot2 annotate 创建注释层
- R ggplot2 label_bquote 带有数学表达式的标签
- R ggplot2 annotation_map 注释:Map
- R ggplot2 scale_viridis 来自 viridisLite 的 Viridis 色标
- R ggplot2 coord_fixed 具有固定“纵横比”的笛卡尔坐标
注:本文由纯净天空筛选整理自Hadley Wickham等大神的英文原创作品 Modify components of a theme。非经特殊声明,原始代码版权归原作者所有,本译文未经允许或授权,请勿转载或复制。
