+ 是构建复杂 ggplot2 图形的关键。它允许您从简单开始,然后变得越来越复杂,并在每个步骤中检查您的工作。
你可以添加什么?
您可以添加以下任何类型的对象:
-
aes()对象取代了默认的美观效果。 -
由
geom_或stat_函数创建的层会添加一个新层。 -
scale会覆盖现有比例。 -
theme()修改当前主题。 -
coord覆盖当前坐标系。 -
facet规范会覆盖当前的分面。
由于 S3 方法优先级问题,要替换当前默认 DataFrame ,您必须使用 %+% 。
您还可以提供一个列表,在这种情况下,将依次添加列表中的每个元素。
例子
base <-
 ggplot(mpg, aes(displ, hwy)) +
 geom_point()
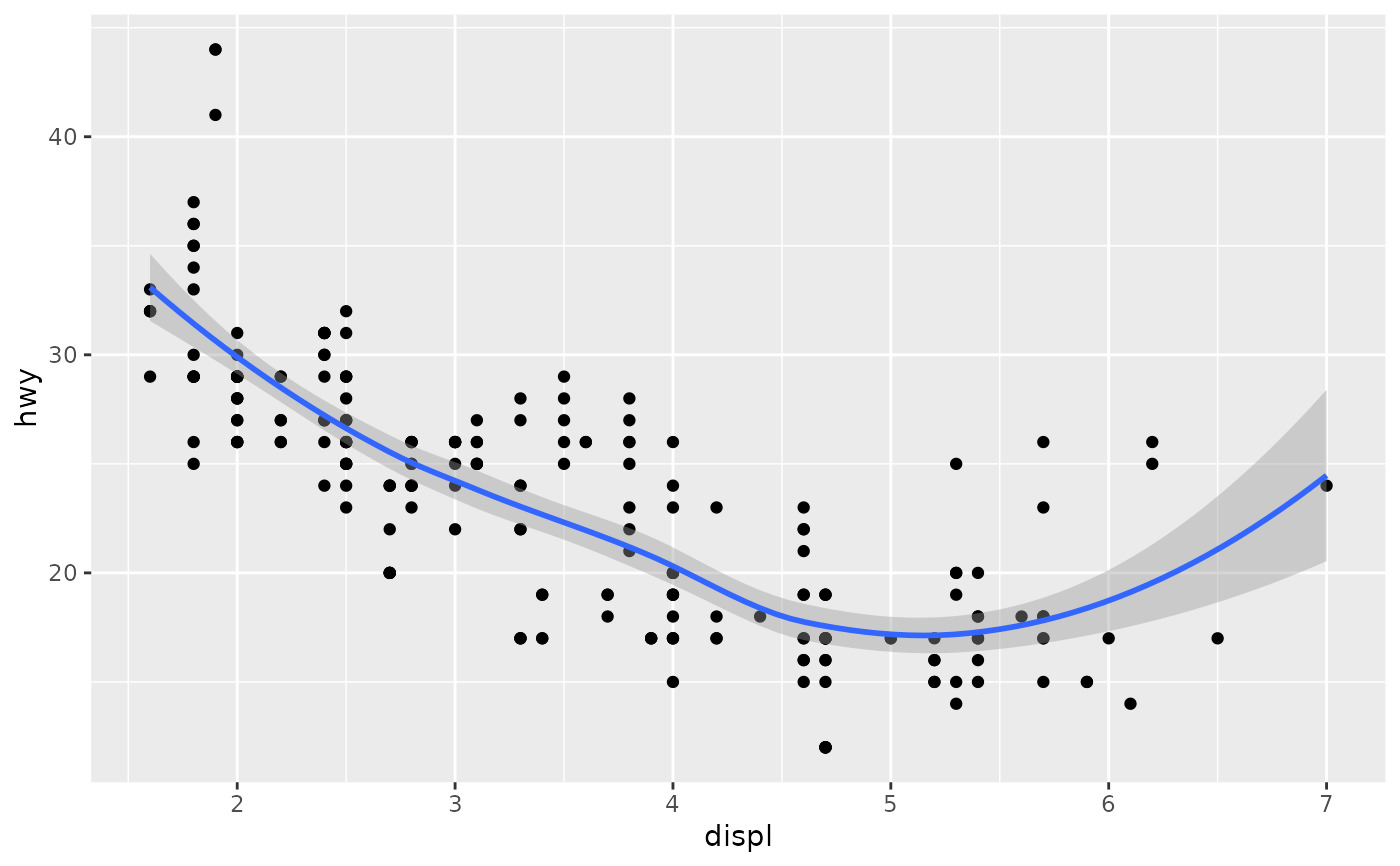
base + geom_smooth()
#> `geom_smooth()` using method = 'loess' and formula = 'y ~ x'


# To override the data, you must use %+%
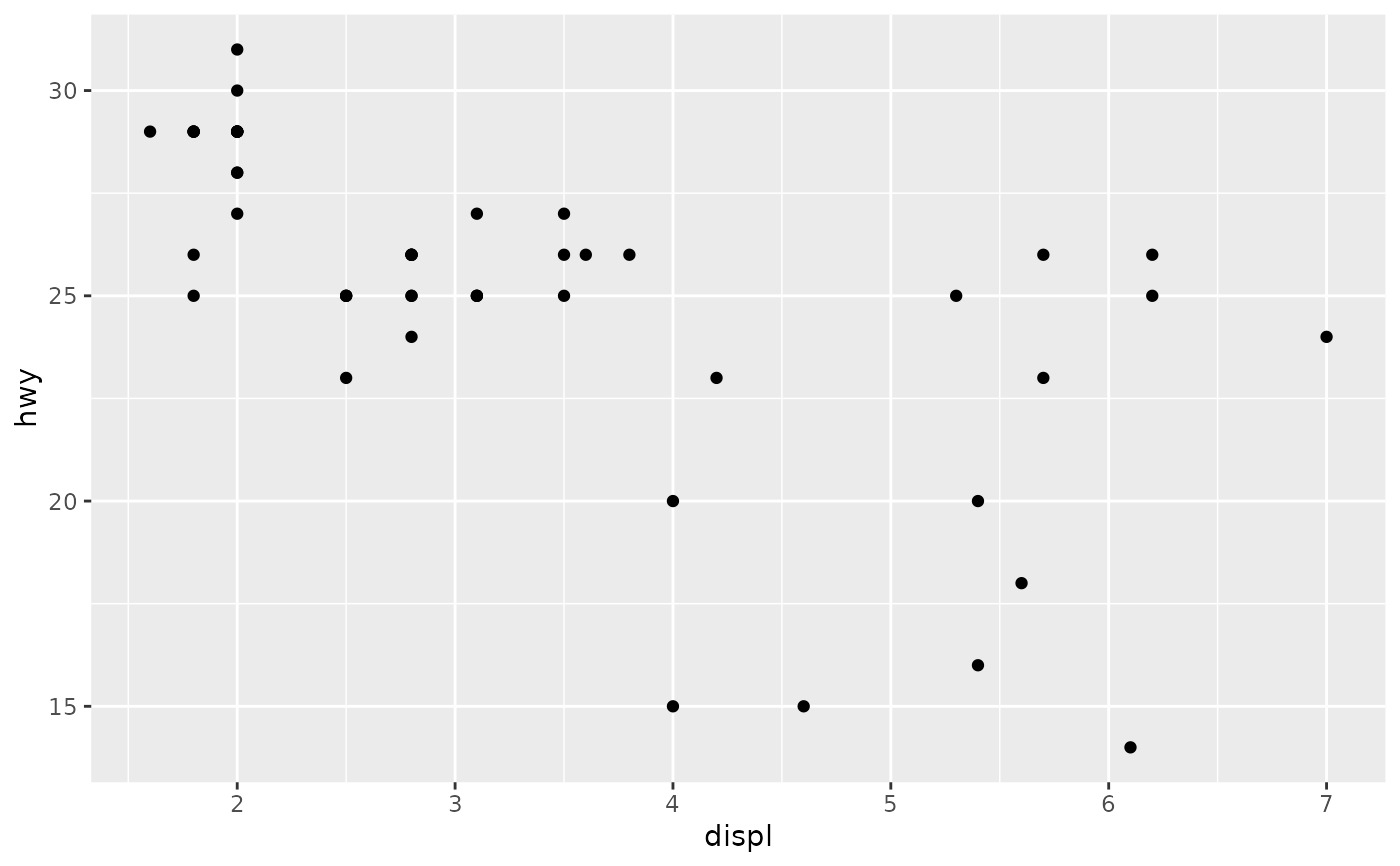
base %+% subset(mpg, fl == "p")


# Alternatively, you can add multiple components with a list.
# This can be useful to return from a function.
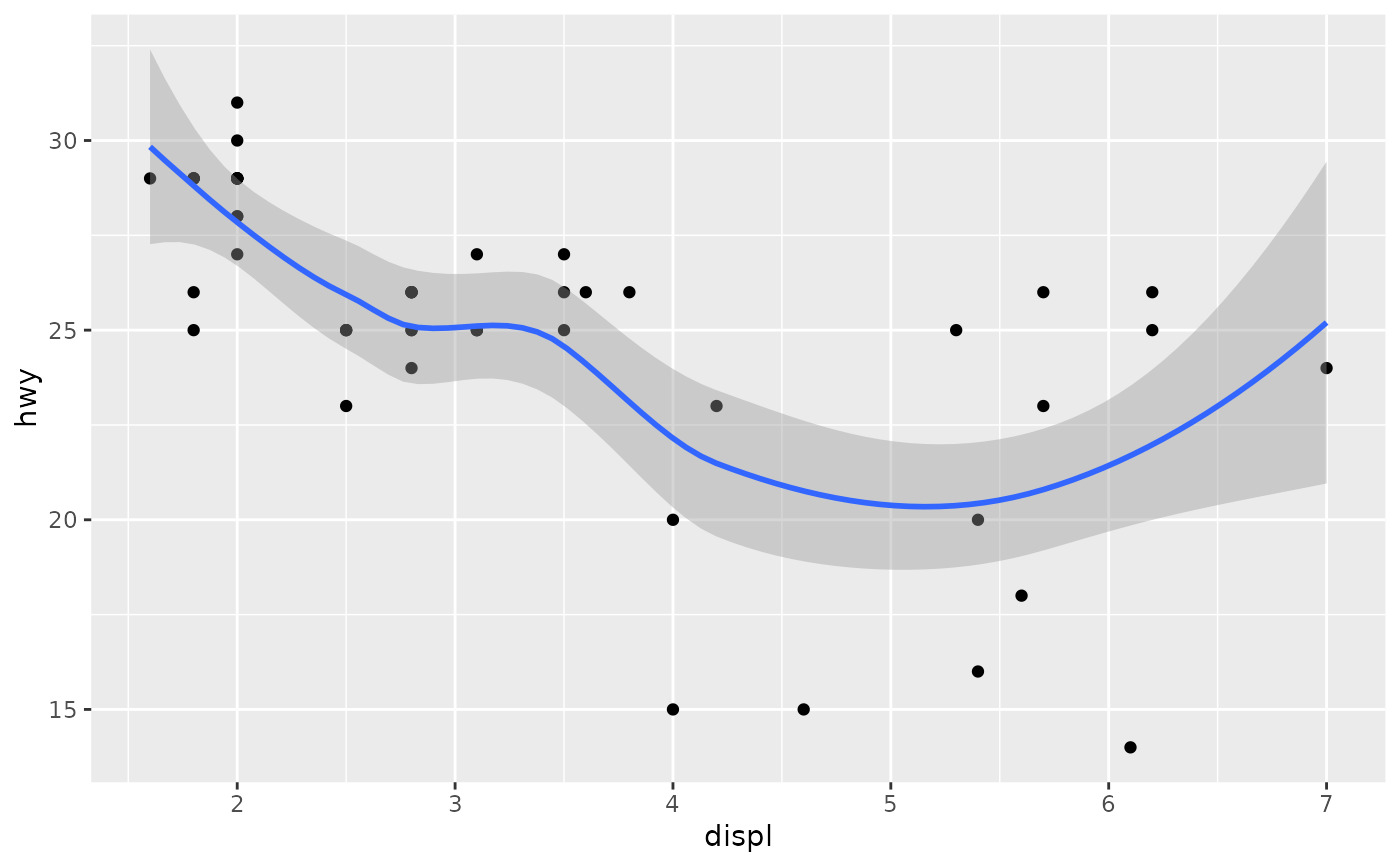
base + list(subset(mpg, fl == "p"), geom_smooth())
#> `geom_smooth()` using method = 'loess' and formula = 'y ~ x'

相关用法
- R ggplot2 ggplot 创建一个新的ggplot
- R ggplot2 ggsf 可视化 sf 对象
- R ggplot2 ggsave 使用合理的默认值保存 ggplot (或其他网格对象)
- R ggplot2 ggtheme 完整的主题
- R ggplot2 ggproto 创建一个新的 ggproto 对象
- R ggplot2 geom_qq 分位数-分位数图
- R ggplot2 geom_spoke 由位置、方向和距离参数化的线段
- R ggplot2 geom_quantile 分位数回归
- R ggplot2 geom_text 文本
- R ggplot2 get_alt_text 从绘图中提取替代文本
- R ggplot2 geom_ribbon 函数区和面积图
- R ggplot2 geom_boxplot 盒须图(Tukey 风格)
- R ggplot2 geom_hex 二维箱计数的六边形热图
- R ggplot2 geom_bar 条形图
- R ggplot2 guide_legend 图例指南
- R ggplot2 geom_bin_2d 二维 bin 计数热图
- R ggplot2 geom_jitter 抖动点
- R ggplot2 geom_point 积分
- R ggplot2 geom_linerange 垂直间隔:线、横线和误差线
- R ggplot2 geom_blank 什么也不画
- R ggplot2 guides 为每个尺度设置指南
- R ggplot2 geom_path 连接观察结果
- R ggplot2 geom_violin 小提琴情节
- R ggplot2 guide_bins Guide_legend 的分箱版本
- R ggplot2 geom_dotplot 点图
注:本文由纯净天空筛选整理自Hadley Wickham等大神的英文原创作品 Add components to a plot。非经特殊声明,原始代码版权归原作者所有,本译文未经允许或授权,请勿转载或复制。
