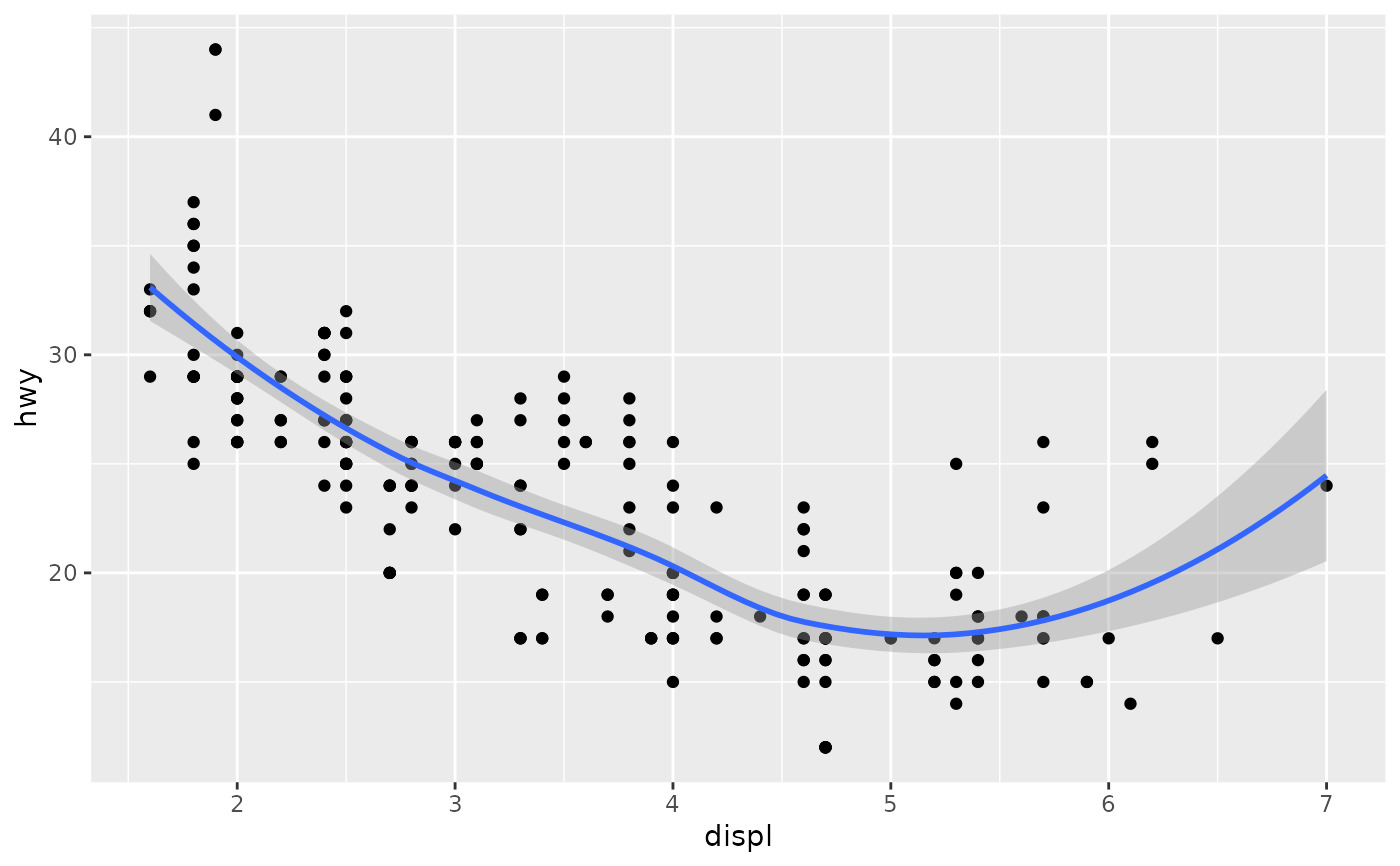
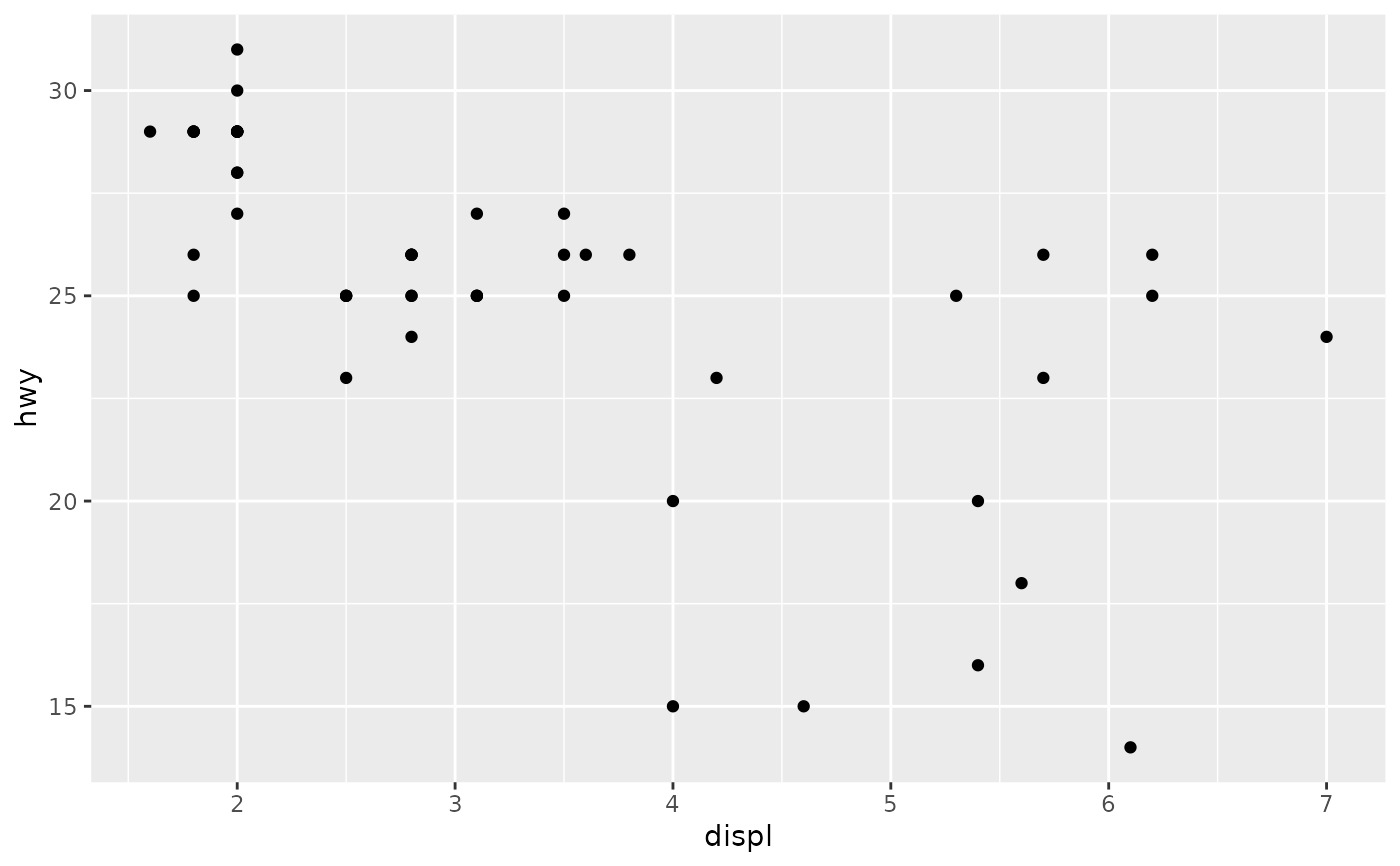
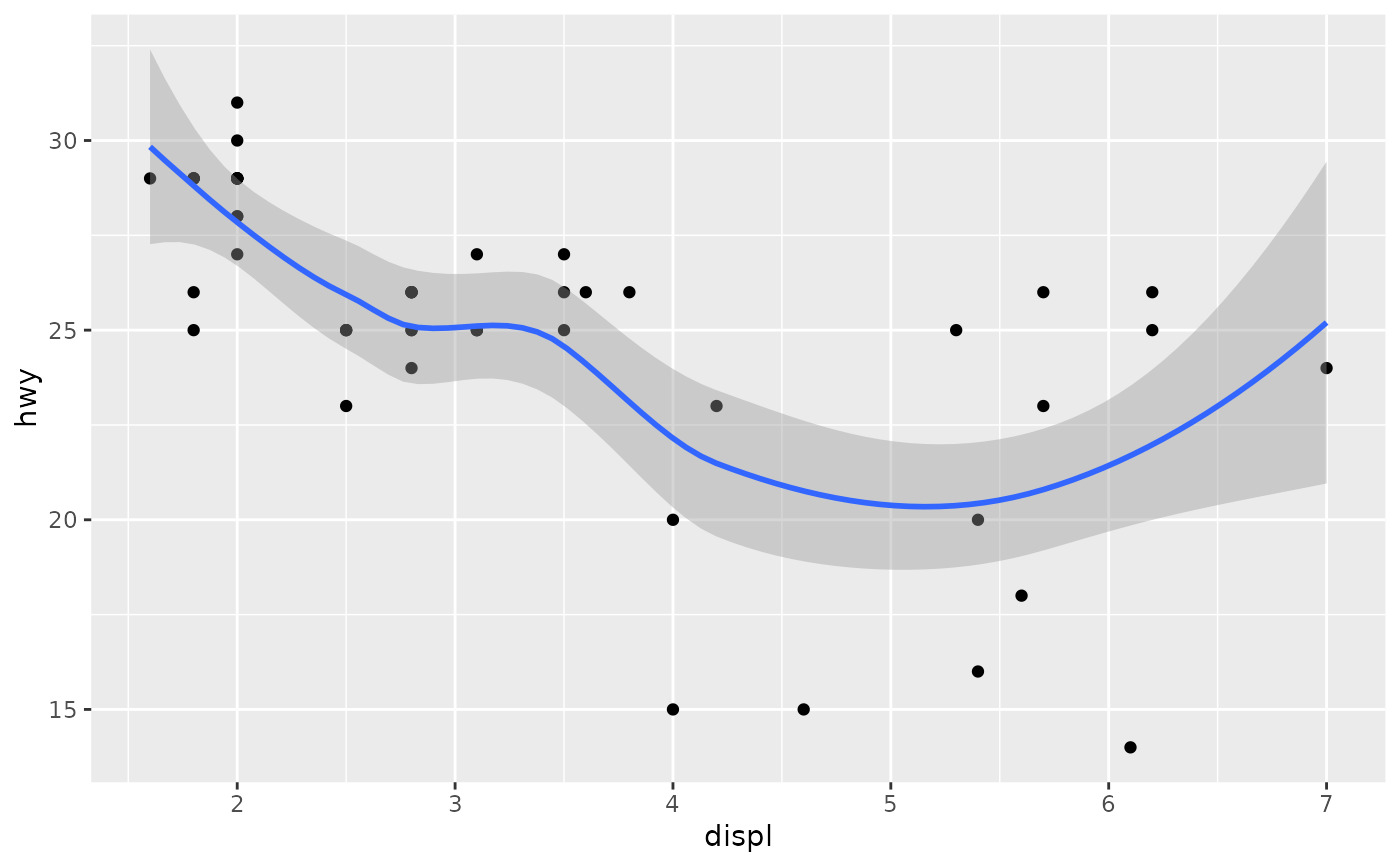
+ 是構建複雜 ggplot2 圖形的關鍵。它允許您從簡單開始,然後變得越來越複雜,並在每個步驟中檢查您的工作。
你可以添加什麽?
您可以添加以下任何類型的對象:
-
aes()對象取代了默認的美觀效果。 -
由
geom_或stat_函數創建的層會添加一個新層。 -
scale會覆蓋現有比例。 -
theme()修改當前主題。 -
coord覆蓋當前坐標係。 -
facet規範會覆蓋當前的分麵。
由於 S3 方法優先級問題,要替換當前默認 DataFrame ,您必須使用 %+% 。
您還可以提供一個列表,在這種情況下,將依次添加列表中的每個元素。
例子
base <-
 ggplot(mpg, aes(displ, hwy)) +
 geom_point()
base + geom_smooth()
#> `geom_smooth()` using method = 'loess' and formula = 'y ~ x'


# To override the data, you must use %+%
base %+% subset(mpg, fl == "p")


# Alternatively, you can add multiple components with a list.
# This can be useful to return from a function.
base + list(subset(mpg, fl == "p"), geom_smooth())
#> `geom_smooth()` using method = 'loess' and formula = 'y ~ x'

相關用法
- R ggplot2 ggplot 創建一個新的ggplot
- R ggplot2 ggsf 可視化 sf 對象
- R ggplot2 ggsave 使用合理的默認值保存 ggplot (或其他網格對象)
- R ggplot2 ggtheme 完整的主題
- R ggplot2 ggproto 創建一個新的 ggproto 對象
- R ggplot2 geom_qq 分位數-分位數圖
- R ggplot2 geom_spoke 由位置、方向和距離參數化的線段
- R ggplot2 geom_quantile 分位數回歸
- R ggplot2 geom_text 文本
- R ggplot2 get_alt_text 從繪圖中提取替代文本
- R ggplot2 geom_ribbon 函數區和麵積圖
- R ggplot2 geom_boxplot 盒須圖(Tukey 風格)
- R ggplot2 geom_hex 二維箱計數的六邊形熱圖
- R ggplot2 geom_bar 條形圖
- R ggplot2 guide_legend 圖例指南
- R ggplot2 geom_bin_2d 二維 bin 計數熱圖
- R ggplot2 geom_jitter 抖動點
- R ggplot2 geom_point 積分
- R ggplot2 geom_linerange 垂直間隔:線、橫線和誤差線
- R ggplot2 geom_blank 什麽也不畫
- R ggplot2 guides 為每個尺度設置指南
- R ggplot2 geom_path 連接觀察結果
- R ggplot2 geom_violin 小提琴情節
- R ggplot2 guide_bins Guide_legend 的分箱版本
- R ggplot2 geom_dotplot 點圖
注:本文由純淨天空篩選整理自Hadley Wickham等大神的英文原創作品 Add components to a plot。非經特殊聲明,原始代碼版權歸原作者所有,本譯文未經允許或授權,請勿轉載或複製。
