主題是自定義繪圖的非數據組件的強大方法:即標題、標簽、字體、背景、網格線和圖例。主題可用於為繪圖提供一致的定製外觀。使用 theme() 修改單個圖的主題;如果您想修改活動主題以影響所有後續繪圖,請參閱theme_update()。如果您想使用完整的主題,例如 theme_bw() 、 theme_minimal() 等,請使用 complete themes 中提供的主題。主題元素根據繼承一起記錄,請閱讀下麵有關主題繼承的更多信息。
用法
theme(
  line,
  rect,
  text,
  title,
  aspect.ratio,
  axis.title,
  axis.title.x,
  axis.title.x.top,
  axis.title.x.bottom,
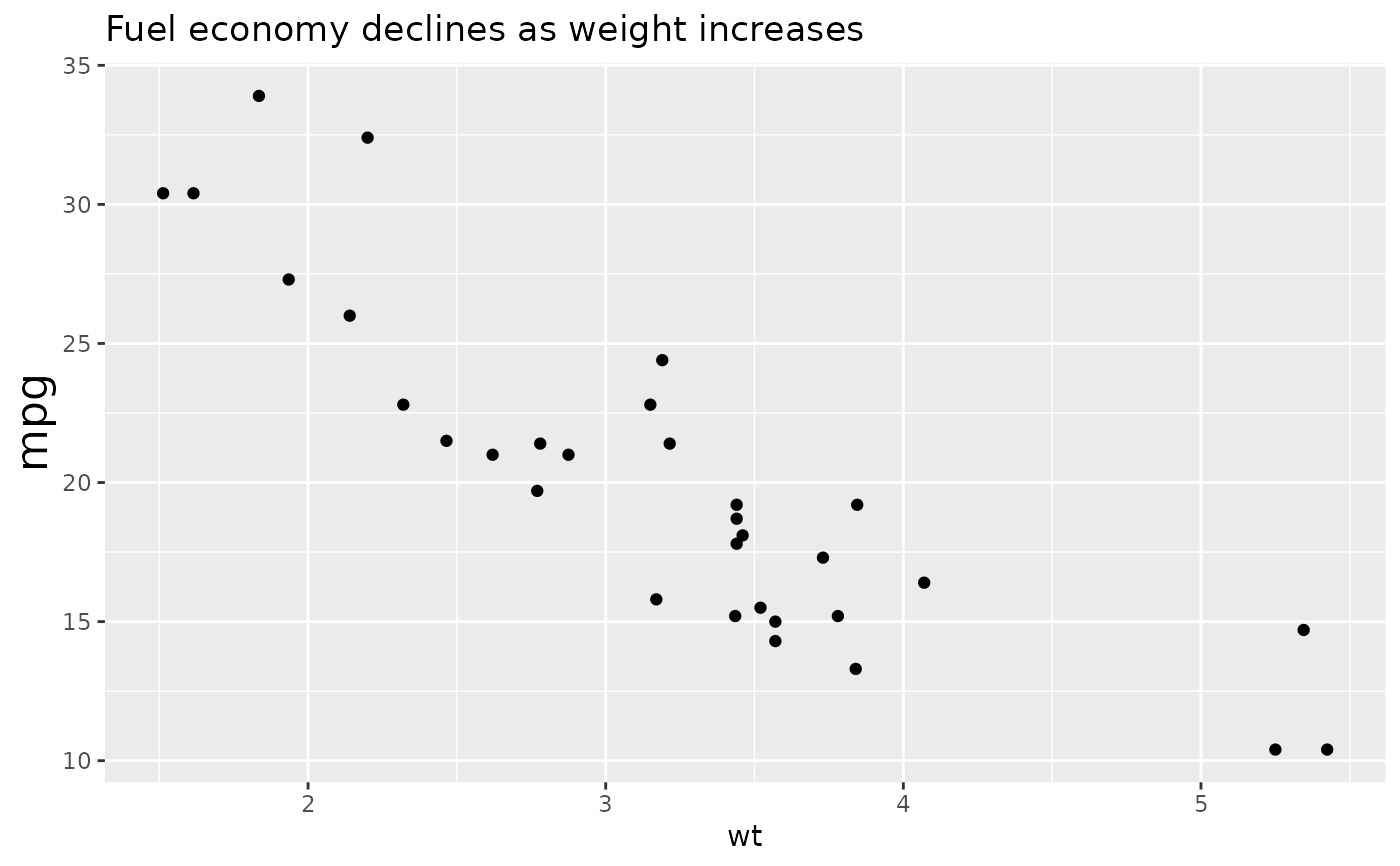
  axis.title.y,
  axis.title.y.left,
  axis.title.y.right,
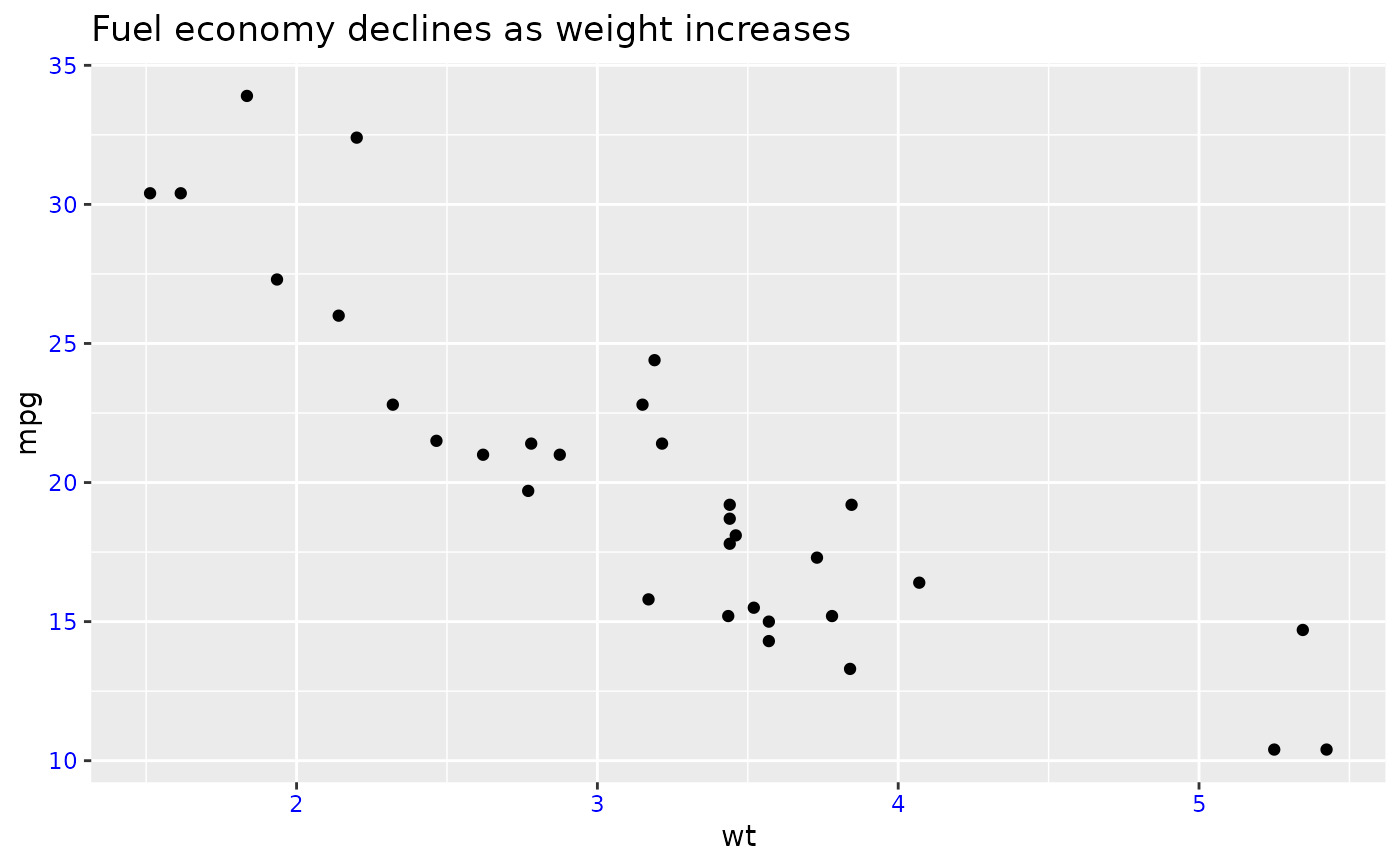
  axis.text,
  axis.text.x,
  axis.text.x.top,
  axis.text.x.bottom,
  axis.text.y,
  axis.text.y.left,
  axis.text.y.right,
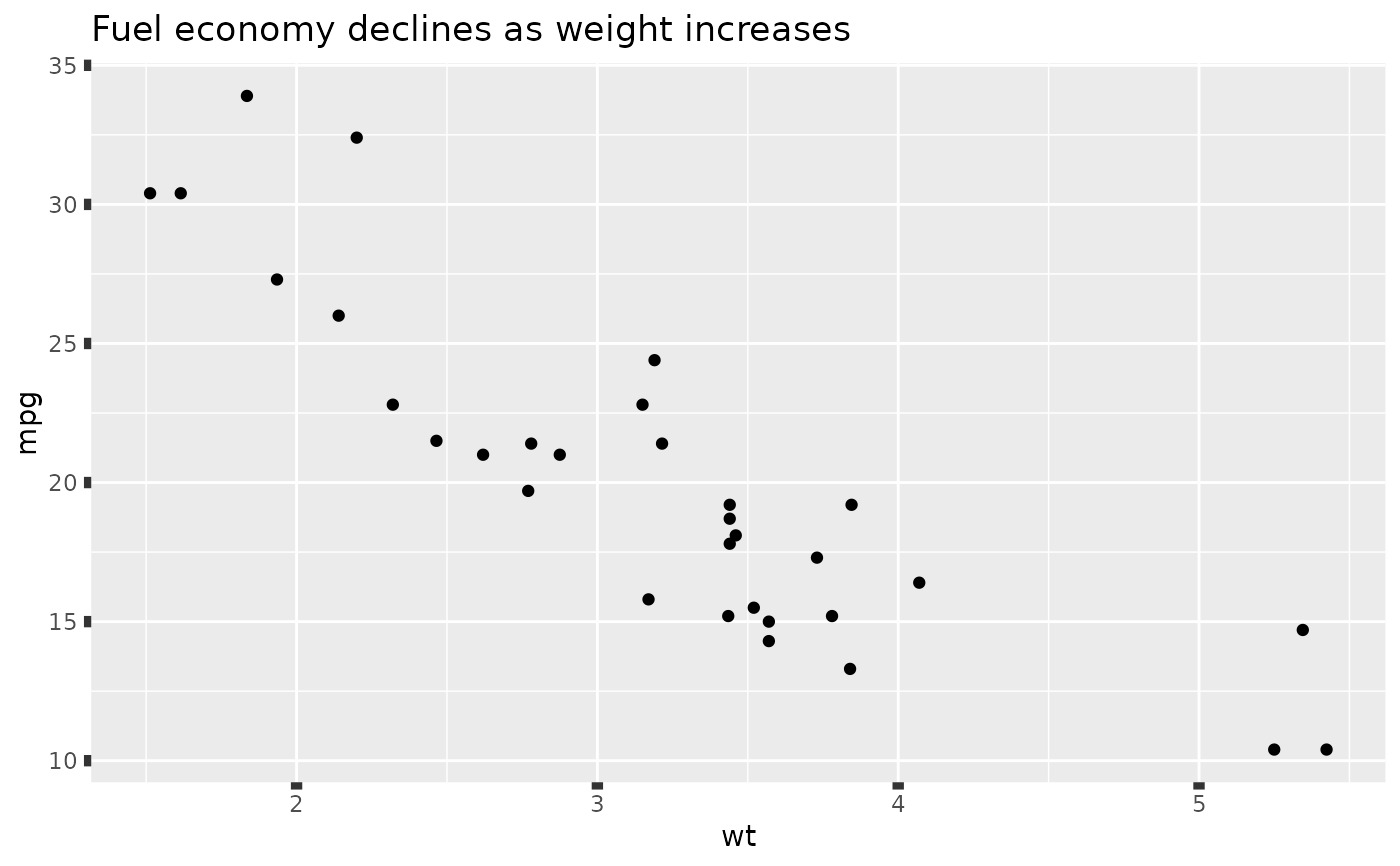
  axis.ticks,
  axis.ticks.x,
  axis.ticks.x.top,
  axis.ticks.x.bottom,
  axis.ticks.y,
  axis.ticks.y.left,
  axis.ticks.y.right,
  axis.ticks.length,
  axis.ticks.length.x,
  axis.ticks.length.x.top,
  axis.ticks.length.x.bottom,
  axis.ticks.length.y,
  axis.ticks.length.y.left,
  axis.ticks.length.y.right,
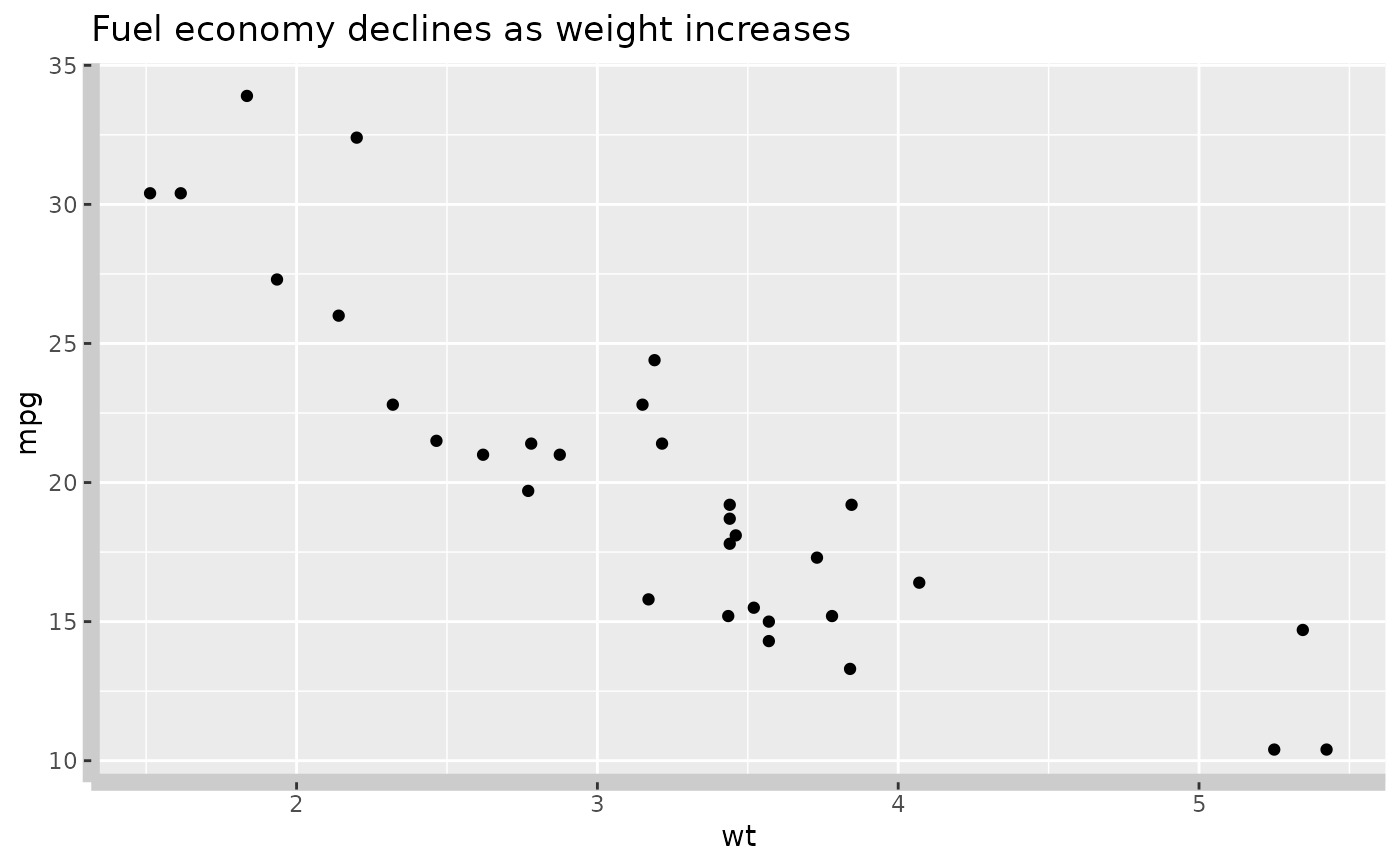
  axis.line,
  axis.line.x,
  axis.line.x.top,
  axis.line.x.bottom,
  axis.line.y,
  axis.line.y.left,
  axis.line.y.right,
  legend.background,
  legend.margin,
  legend.spacing,
  legend.spacing.x,
  legend.spacing.y,
  legend.key,
  legend.key.size,
  legend.key.height,
  legend.key.width,
  legend.text,
  legend.text.align,
  legend.title,
  legend.title.align,
  legend.position,
  legend.direction,
  legend.justification,
  legend.box,
  legend.box.just,
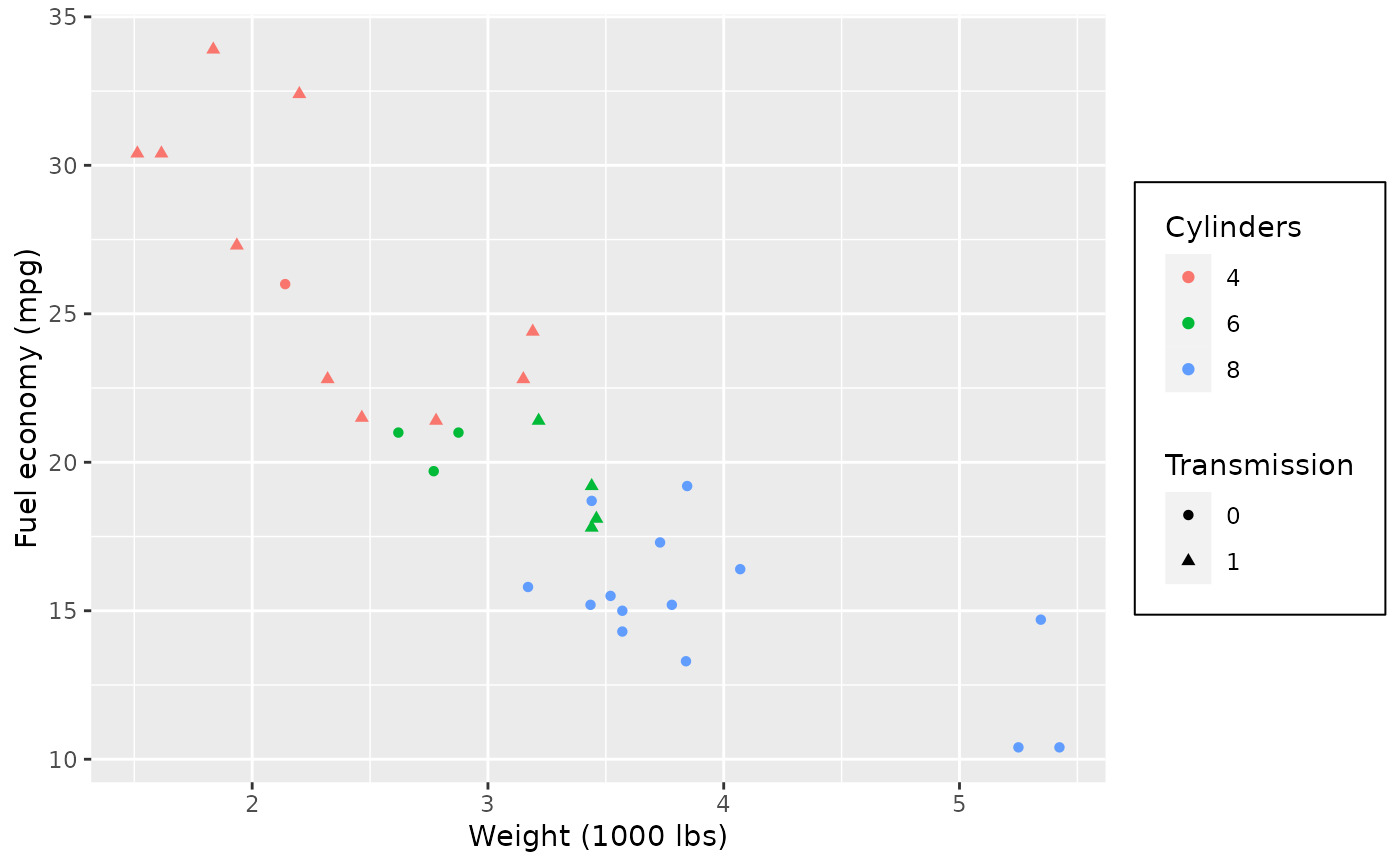
  legend.box.margin,
  legend.box.background,
  legend.box.spacing,
  panel.background,
  panel.border,
  panel.spacing,
  panel.spacing.x,
  panel.spacing.y,
  panel.grid,
  panel.grid.major,
  panel.grid.minor,
  panel.grid.major.x,
  panel.grid.major.y,
  panel.grid.minor.x,
  panel.grid.minor.y,
  panel.ontop,
  plot.background,
  plot.title,
  plot.title.position,
  plot.subtitle,
  plot.caption,
  plot.caption.position,
  plot.tag,
  plot.tag.position,
  plot.margin,
  strip.background,
  strip.background.x,
  strip.background.y,
  strip.clip,
  strip.placement,
  strip.text,
  strip.text.x,
  strip.text.x.bottom,
  strip.text.x.top,
  strip.text.y,
  strip.text.y.left,
  strip.text.y.right,
  strip.switch.pad.grid,
  strip.switch.pad.wrap,
  ...,
  complete = FALSE,
  validate = TRUE
)
參數
- line
-
所有行元素(
element_line()) - rect
-
所有矩形元素(
element_rect()) - text
-
所有文本元素 (
element_text()) - title
-
所有標題元素:繪圖、軸、圖例(
element_text();繼承自text) - aspect.ratio
-
麵板的長寬比
- axis.title, axis.title.x, axis.title.y, axis.title.x.top, axis.title.x.bottom, axis.title.y.left, axis.title.y.right
-
軸標簽 (
element_text())。指定所有軸的標簽 (axis.title)、按平麵的標簽(使用axis.title.x或axis.title.y)或為每個軸單獨指定標簽(使用axis.title.x.bottom、axis.title.x.top、axis.title.y.left、axis.title.y.right)。axis.title.*.*繼承自axis.title.*,axis.title.*又繼承自axis.title,而axis.title又繼承自text - axis.text, axis.text.x, axis.text.y, axis.text.x.top, axis.text.x.bottom, axis.text.y.left, axis.text.y.right
-
沿軸勾選標簽 (
element_text())。指定所有軸刻度標簽 (axis.text)、按平麵刻度標簽(使用axis.text.x或axis.text.y)或為每個軸單獨指定刻度標簽(使用axis.text.x.bottom、axis.text.x.top、axis.text.y.left、axis.text.y.right)。axis.text.*.*繼承自axis.text.*,axis.text.*又繼承自axis.text,而axis.text又繼承自text - axis.ticks, axis.ticks.x, axis.ticks.x.top, axis.ticks.x.bottom, axis.ticks.y, axis.ticks.y.left, axis.ticks.y.right
-
沿軸的刻度線 (
element_line())。指定所有刻度線 (axis.ticks)、按平麵刻度(使用axis.ticks.x或axis.ticks.y)或為每個軸單獨指定(使用axis.ticks.x.bottom、axis.ticks.x.top、axis.ticks.y.left、axis.ticks.y.right)。axis.ticks.*.*繼承自axis.ticks.*,axis.ticks.*又繼承自axis.ticks,而axis.ticks又繼承自line - axis.ticks.length, axis.ticks.length.x, axis.ticks.length.x.top, axis.ticks.length.x.bottom, axis.ticks.length.y, axis.ticks.length.y.left, axis.ticks.length.y.right
-
刻度線的長度 (
unit) - axis.line, axis.line.x, axis.line.x.top, axis.line.x.bottom, axis.line.y, axis.line.y.left, axis.line.y.right
-
沿軸的線(
element_line())。指定沿所有軸 (axis.line) 的線、每個平麵的線(使用axis.line.x或axis.line.y)或單獨為每個軸指定線(使用axis.line.x.bottom、axis.line.x.top、axis.line.y.left、axis.line.y.right)。axis.line.*.*繼承自axis.line.*,axis.line.*又繼承自axis.line,而axis.line又繼承自line - legend.background
-
圖例背景(
element_rect();繼承自rect) - legend.margin
-
每個圖例周圍的邊距 (
margin()) - legend.spacing, legend.spacing.x, legend.spacing.y
-
圖例之間的間距 (
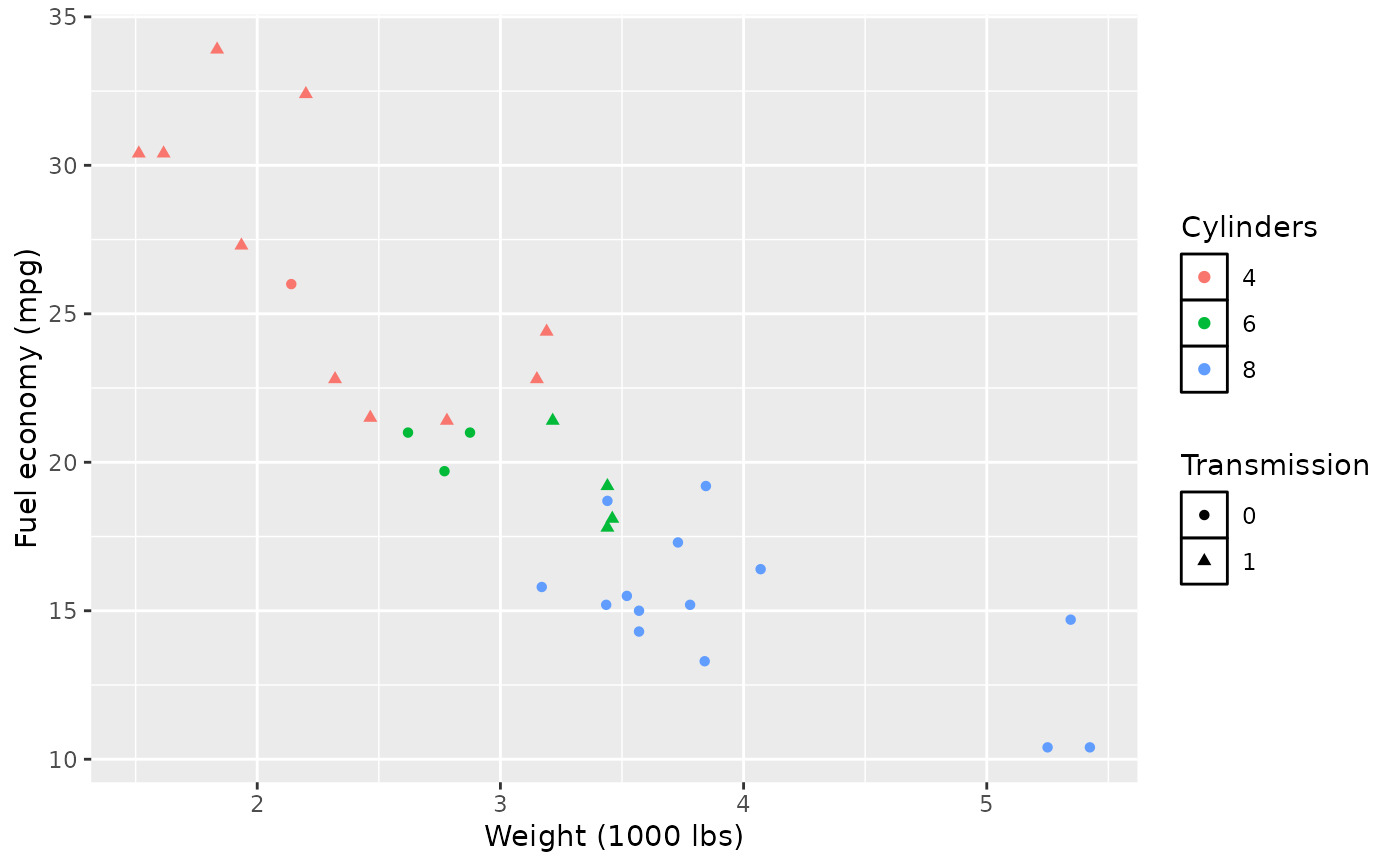
unit)。legend.spacing.x和legend.spacing.y繼承自legend.spacing或可以單獨指定 - legend.key
-
圖例鍵下方的背景(
element_rect();繼承自rect) - legend.key.size, legend.key.height, legend.key.width
-
圖例鍵的大小(
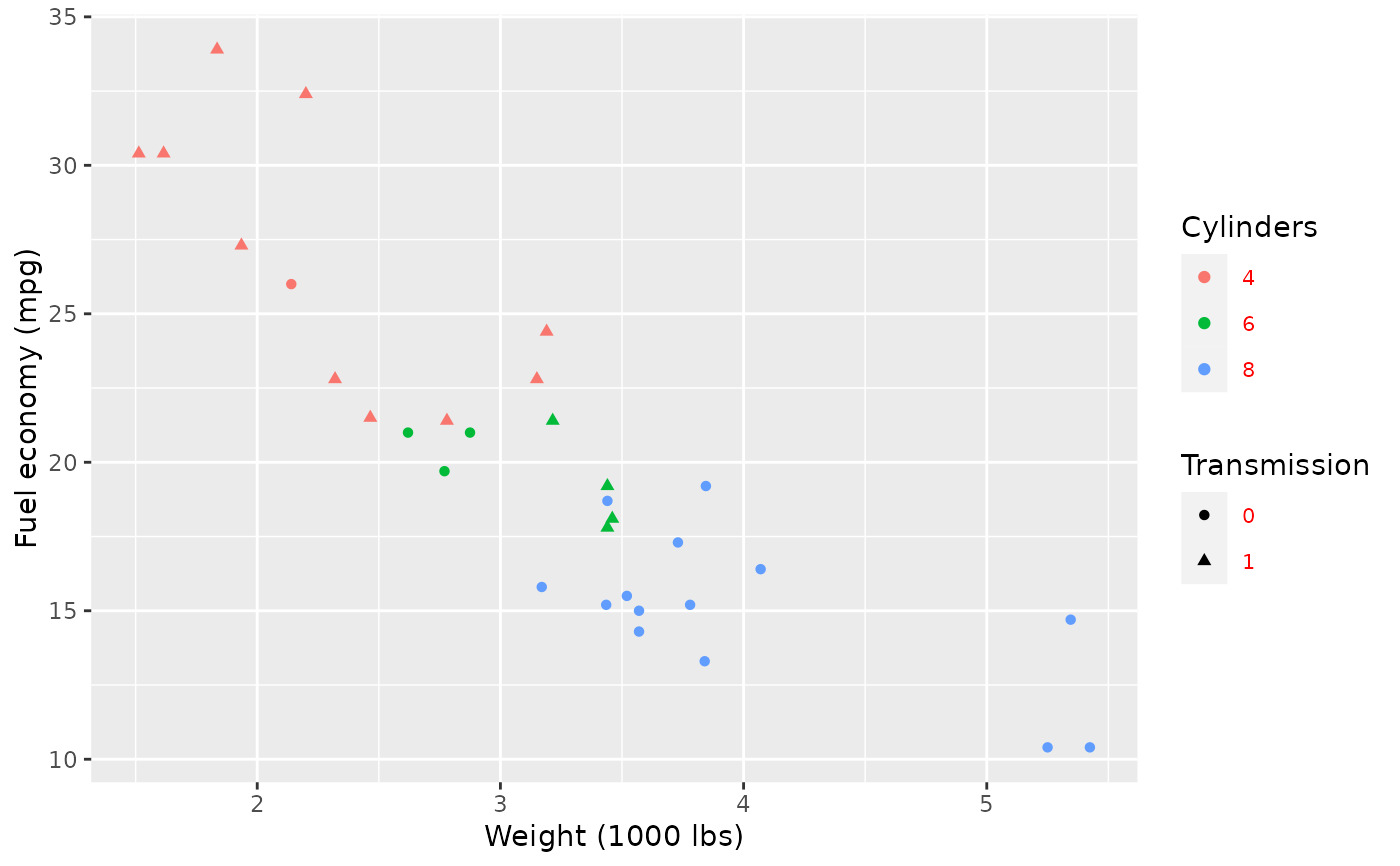
unit);關鍵背景高度和寬度繼承自legend.key.size或可以單獨指定 - legend.text
-
圖例項標簽(
element_text();繼承自text) - legend.text.align
-
圖例標簽的對齊方式(數字從 0(左)到 1(右))
- legend.title
-
圖例標題(
element_text();繼承自title) - legend.title.align
-
圖例標題的對齊方式(從 0(左)到 1(右)的數字)
- legend.position
-
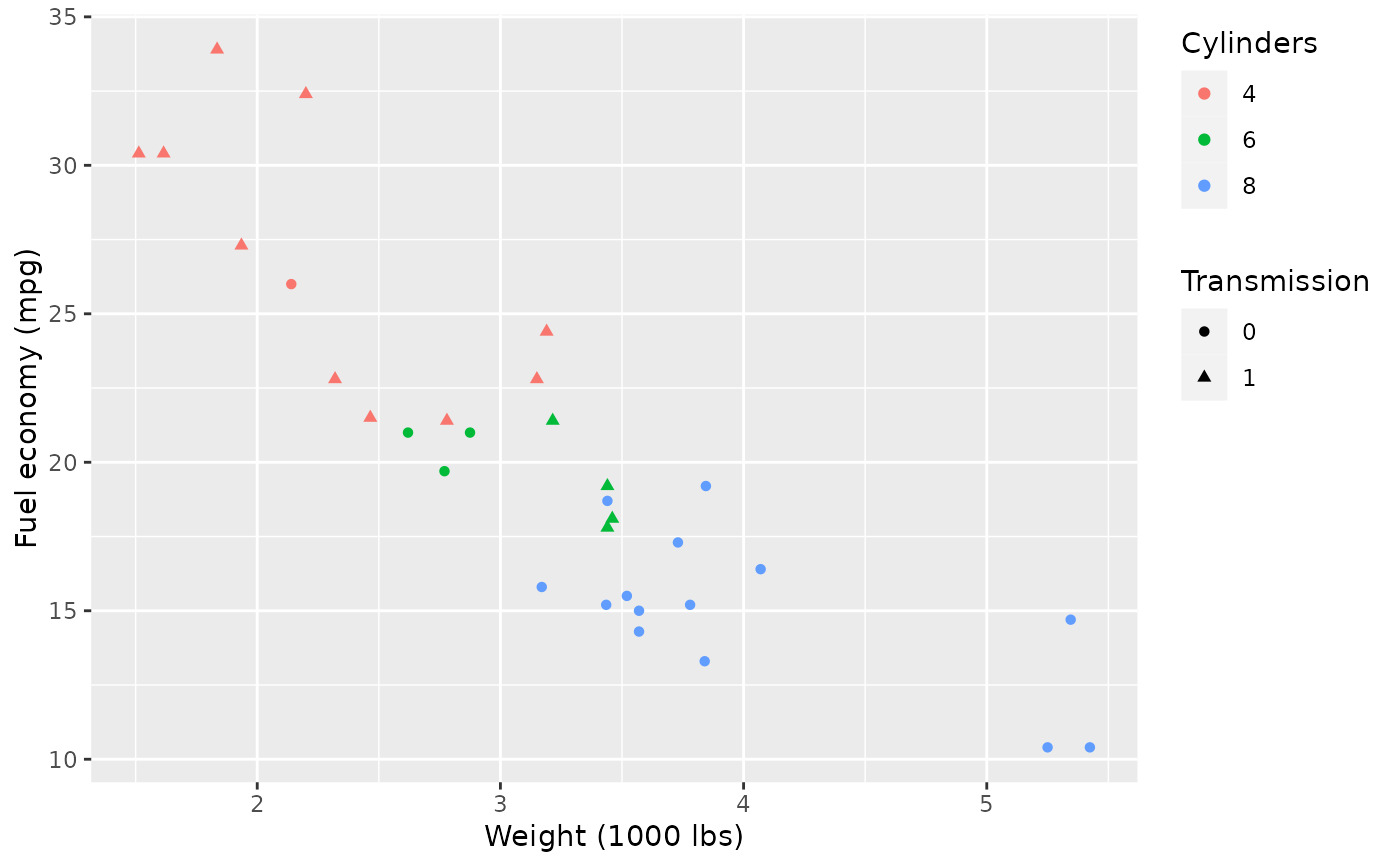
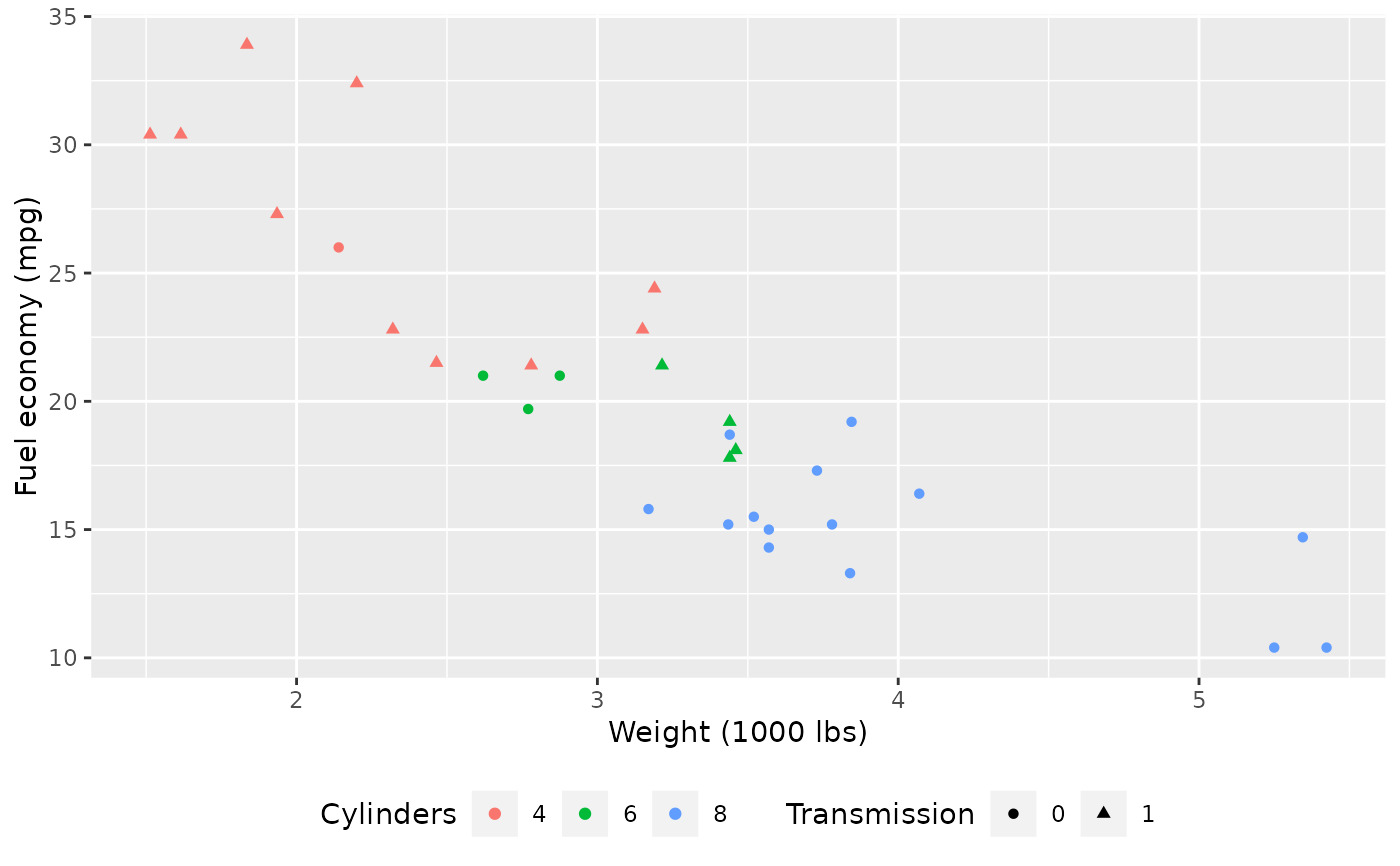
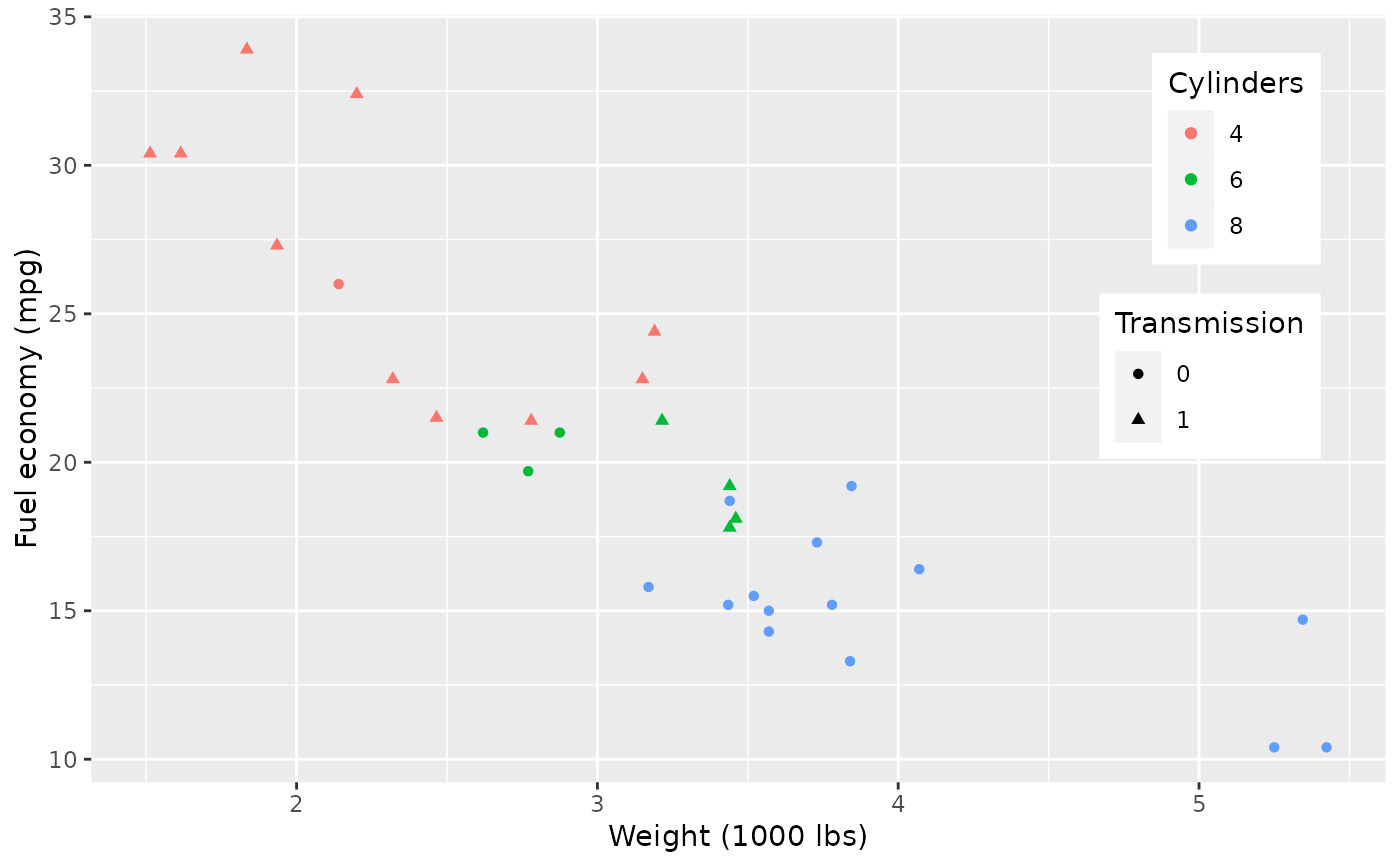
圖例的位置("none"、"left"、"right"、"bottom"、"top" 或二元素數值向量)
- legend.direction
-
圖例中項目的布局("horizontal" 或 "vertical")
- legend.justification
-
用於將圖例定位在繪圖內部的錨點("center" 或二元素數值向量)或定位在繪圖外部時根據繪圖區域進行的調整
- legend.box
-
多個圖例的排列("horizontal" 或 "vertical")
- legend.box.just
-
當有多個圖例("top"、"bottom"、"left" 或 "right")時,整個邊界框中每個圖例的對齊方式
- legend.box.margin
-
整個圖例區域周圍的邊距,使用
margin()指定 - legend.box.background
-
圖例區域的背景(
element_rect();繼承自rect) - legend.box.spacing
-
繪圖區域和圖例框之間的間距(
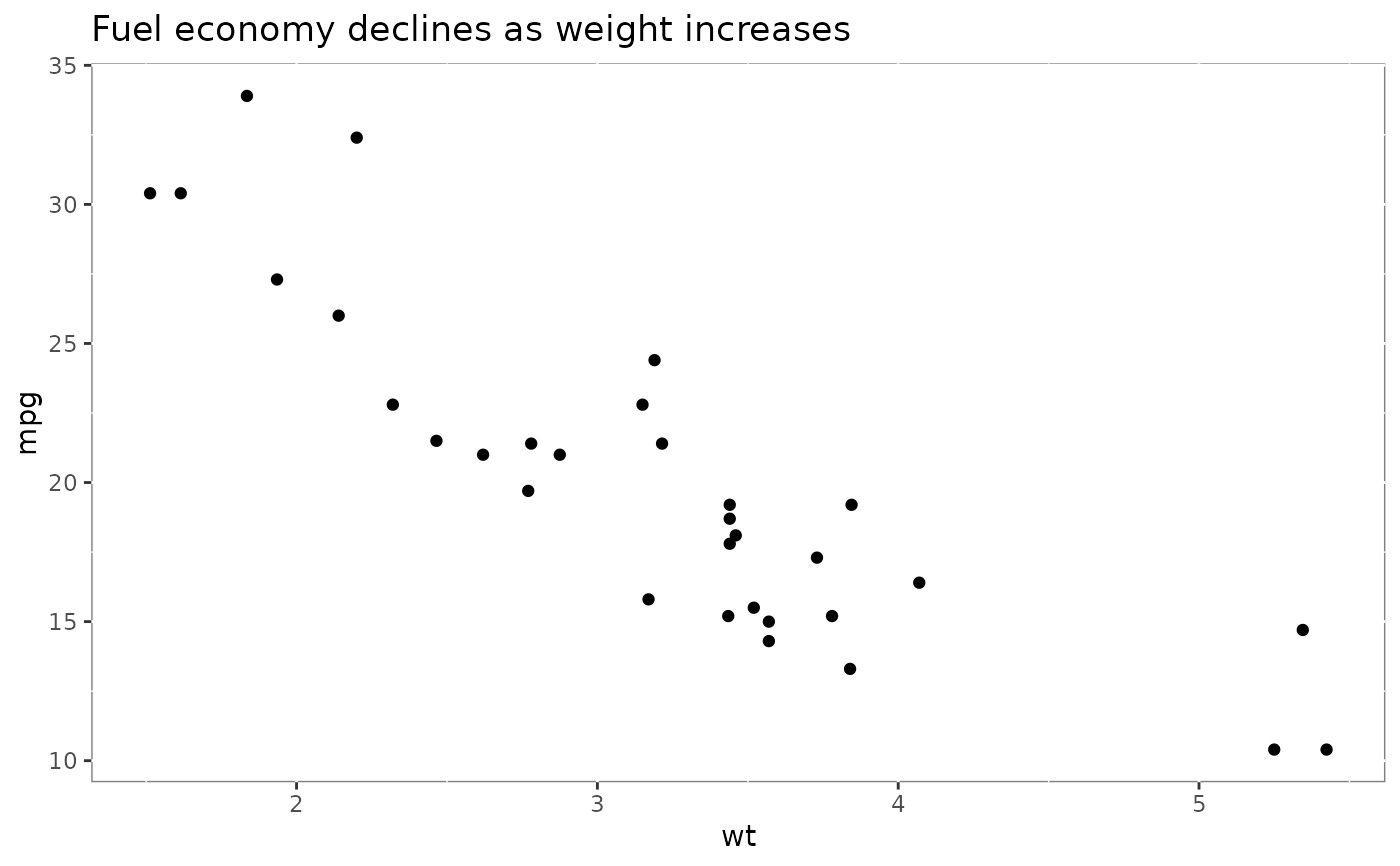
unit) - panel.background
-
繪圖區域的背景,繪製在圖下方(
element_rect();繼承自rect) - panel.border
-
繪圖區域周圍的邊框,繪製在繪圖頂部,以便覆蓋刻度線和網格線。這應該與
fill = NA一起使用(element_rect();繼承自rect) - panel.spacing, panel.spacing.x, panel.spacing.y
-
小平麵麵板之間的間距 (
unit)。panel.spacing.x和panel.spacing.y繼承自panel.spacing,也可以單獨指定。 - panel.grid, panel.grid.major, panel.grid.minor, panel.grid.major.x, panel.grid.major.y, panel.grid.minor.x, panel.grid.minor.y
-
網格線(
element_line())。分別指定主網格線或次網格線(使用panel.grid.major或panel.grid.minor),或為每個軸單獨指定主網格線或次網格線(使用panel.grid.major.x、panel.grid.minor.x、panel.grid.major.y、panel.grid.minor.y)。 Y 軸網格線是水平的,x 軸網格線是垂直的。panel.grid.*.*繼承自panel.grid.*,而panel.grid.*又繼承自panel.grid,而panel.grid又繼承自line - panel.ontop
-
將麵板(背景、網格線)放置在數據層上的選項(
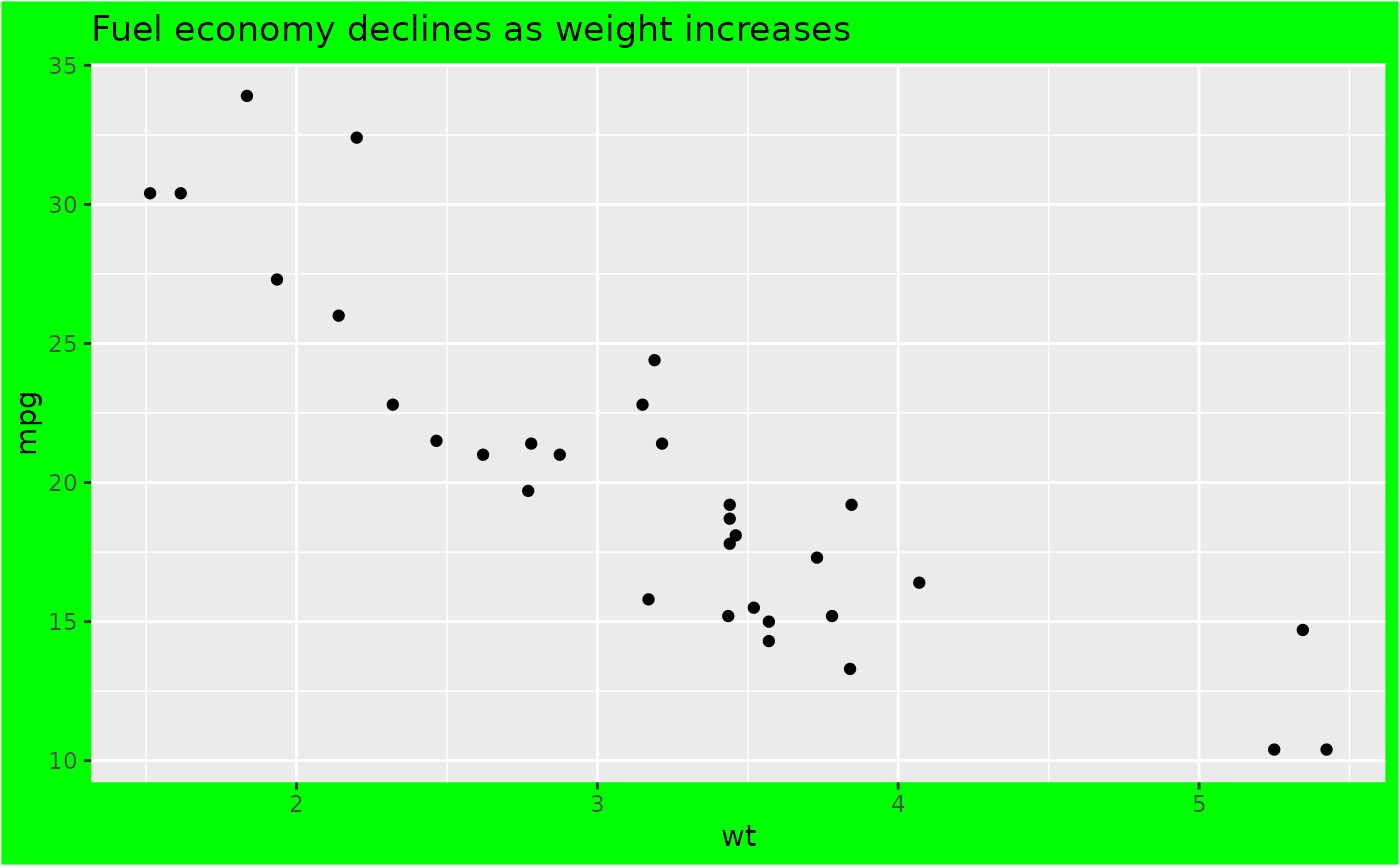
logical)。通常與透明或空白panel.background一起使用。 - plot.background
-
整個情節的背景(
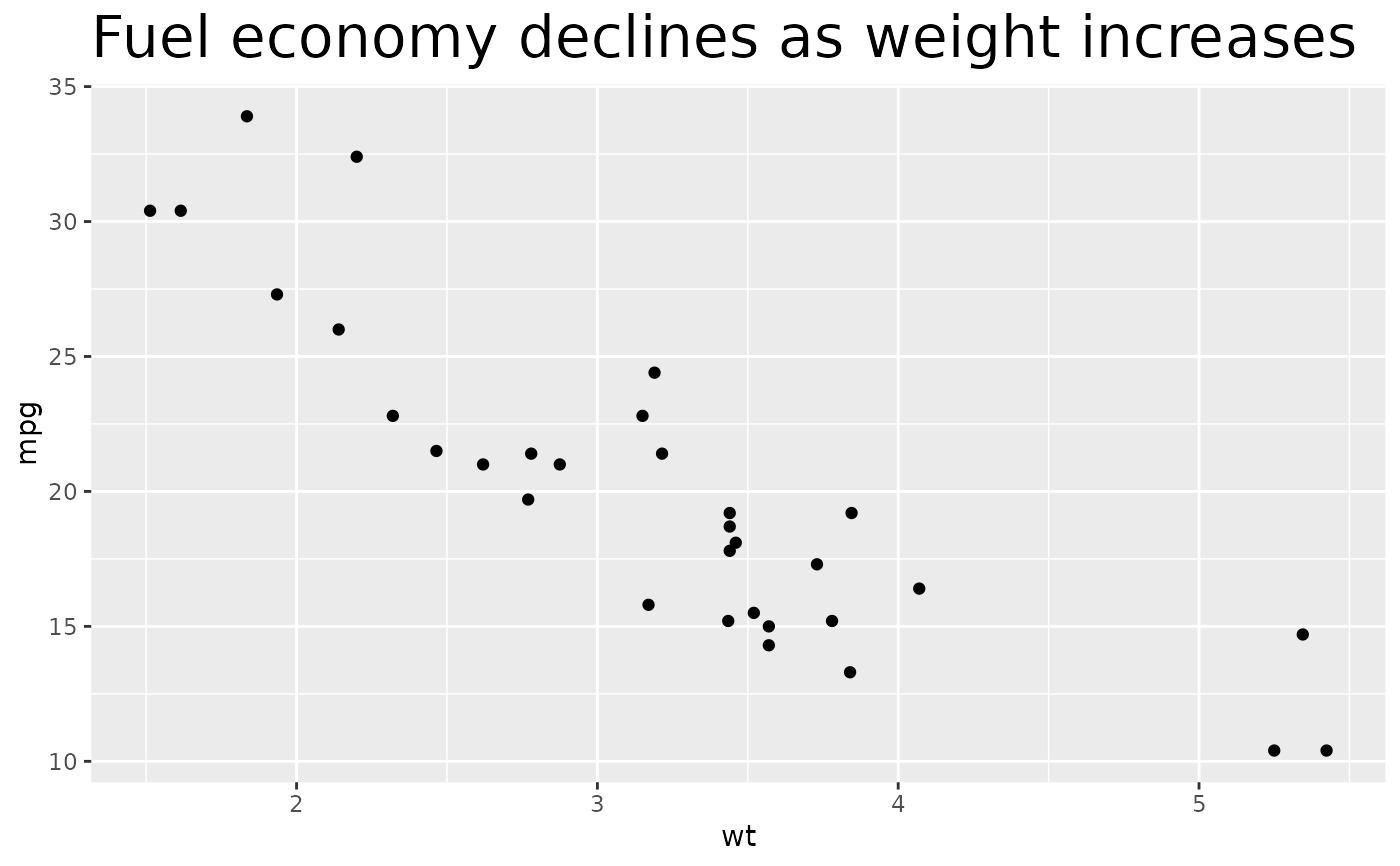
element_rect();繼承自rect) - plot.title
-
繪圖標題(文本外觀)(
element_text();繼承自title)默認左對齊 - plot.title.position, plot.caption.position
-
情節標題/副標題和標題的對齊。
plot.title.position的設置適用於標題和副標題。值"panel"(默認值)表示標題和/或說明文字與繪圖麵板對齊。 "plot" 值表示標題和/或說明文字與整個繪圖對齊(減去邊距和繪圖標簽的任何空間)。 - plot.subtitle
-
繪圖副標題(文本外觀)(
element_text();繼承自title)默認左對齊 - plot.caption
-
繪圖下方的標題(文本外觀)(
element_text();繼承自title)默認右對齊 - plot.tag
-
用於標識繪圖的左上標簽(文本外觀)(
element_text();繼承自title)默認左對齊 - plot.tag.position
-
標簽的位置作為字符串("topleft"、"top"、"topright"、"left"、"right"、"bottomleft"、"bottom"、"bottomright)或坐標。如果是字符串,則需要額外空格將添加以容納標簽。
- plot.margin
-
整個圖周圍的邊距(
unit具有上、右、下、左邊距的大小) - strip.background, strip.background.x, strip.background.y
-
構麵標簽的背景(
element_rect();繼承自rect)。水平麵背景 (strip.background.x) 和垂直麵背景 (strip.background.y) 繼承自strip.background或可以單獨指定 - strip.clip
-
條帶背景邊和條帶標簽是否應該剪裁到條帶背景的延伸範圍?選項包括
"on"進行剪輯、"off"禁用剪輯或"inherit"(默認)從父視口獲取剪輯設置。 - strip.placement
-
條帶相對於軸的放置,"inside" 或"outside"。僅當軸和條位於圖的同一側時才重要。
- strip.text, strip.text.x, strip.text.y, strip.text.x.top, strip.text.x.bottom, strip.text.y.left, strip.text.y.right
-
分麵標簽(
element_text();繼承自text)。水平麵標簽 (strip.text.x) 和垂直麵標簽 (strip.text.y) 繼承自strip.text或可以單獨指定。 Facet strips 具有專用的 position-dependent 主題元素(strip.text.x.top、strip.text.x.bottom、strip.text.y.left、strip.text.y.right),它們分別繼承自strip.text.x和strip.text.y。因此,一些主題樣式需要應用於 position-dependent 元素而不是父元素 - strip.switch.pad.grid
-
切換條帶時條帶和軸之間的空間(
unit) - strip.switch.pad.wrap
-
切換條帶時條帶和軸之間的空間(
unit) - ...
-
附加元素規範不屬於基本 ggplot2 的一部分。一般來說,這些也應該在
element tree參數中定義。 - complete
-
如果這是一個完整的主題,例如
theme_grey()返回的主題,請將其設置為TRUE。添加到 ggplot 對象時,完整主題的行為有所不同。此外,當設置complete = TRUE時,所有元素都將被設置為從空白元素繼承。 - validate
-
TRUE運行validate_element()、FALSE繞過檢查。
主題傳承
主題元素按層次繼承其他主題元素的屬性。例如, axis.title.x.bottom 繼承自 axis.title.x ,而 axis.title.x 又繼承自 axis.title ,而 axis.title 又繼承自 text 。所有文本元素直接或間接繼承自text;所有線條均繼承自 line ,所有矩形對象均繼承自 rect 。這意味著您可以通過設置單個高級組件來修改多個元素的外觀。
在 vignette("ggplot2-specs") 中了解有關設置這些美學的更多信息。
也可以看看
+.gg() 和 %+replace% 、 element_blank() 、 element_line() 、 element_rect() 和 element_text() 了解特定主題元素的詳細信息。
例子
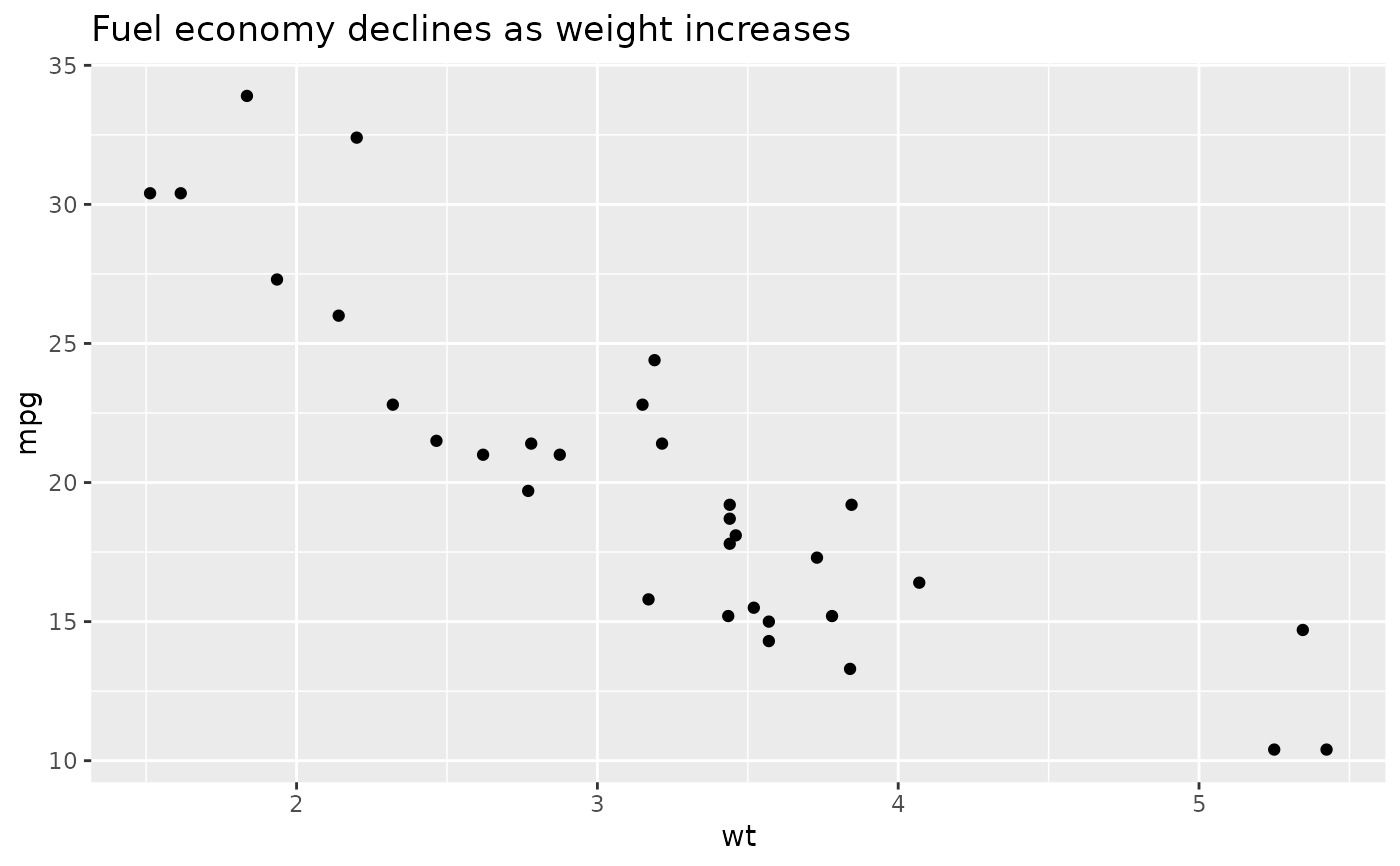
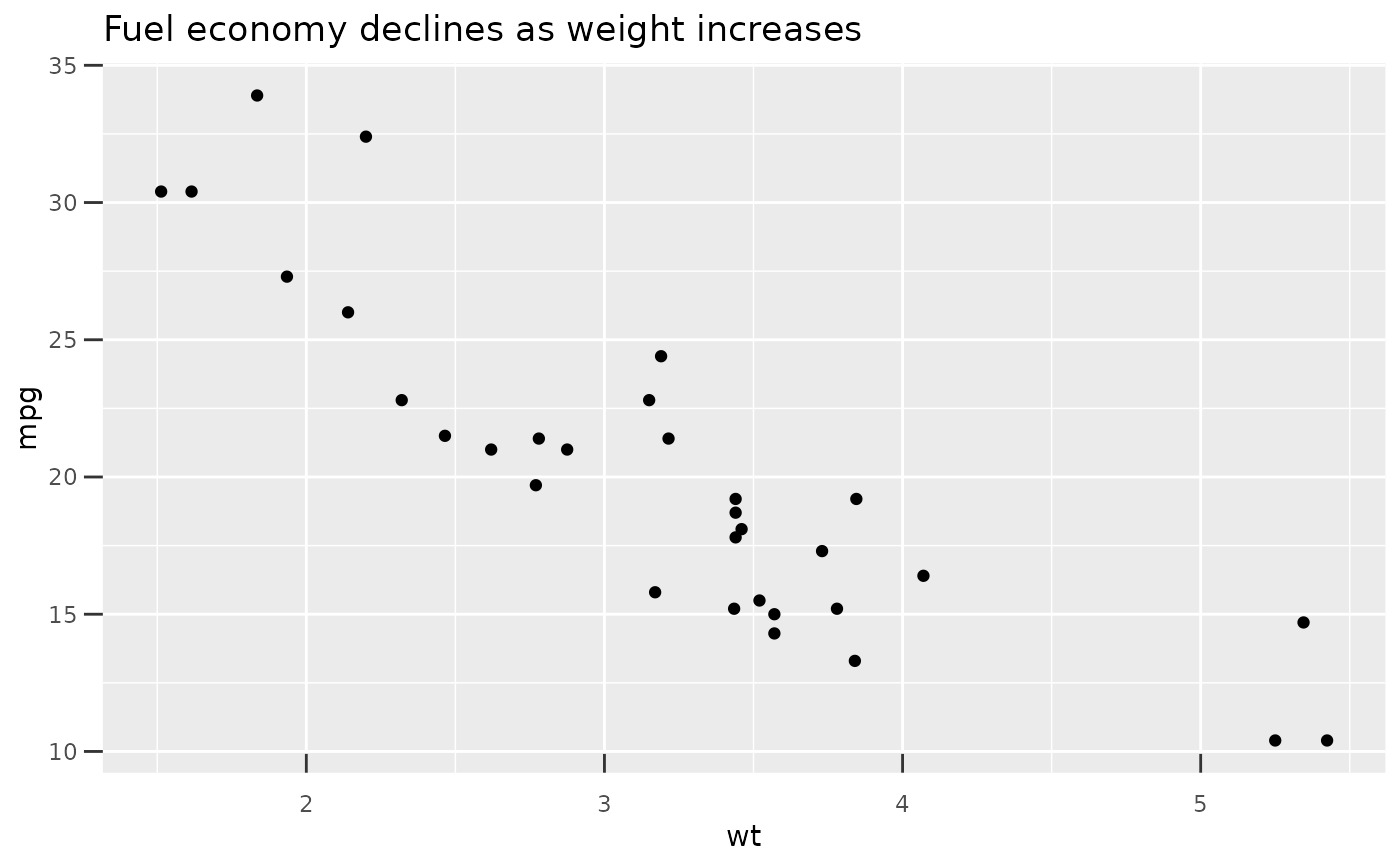
p1 <- ggplot(mtcars, aes(wt, mpg)) +
geom_point() +
labs(title = "Fuel economy declines as weight increases")
p1
 # Plot ---------------------------------------------------------------------
p1 + theme(plot.title = element_text(size = rel(2)))
 p1 + theme(plot.background = element_rect(fill = "green"))
 # Panels --------------------------------------------------------------------
p1 + theme(panel.background = element_rect(fill = "white", colour = "grey50"))
 p1 + theme(panel.border = element_rect(linetype = "dashed", fill = NA))
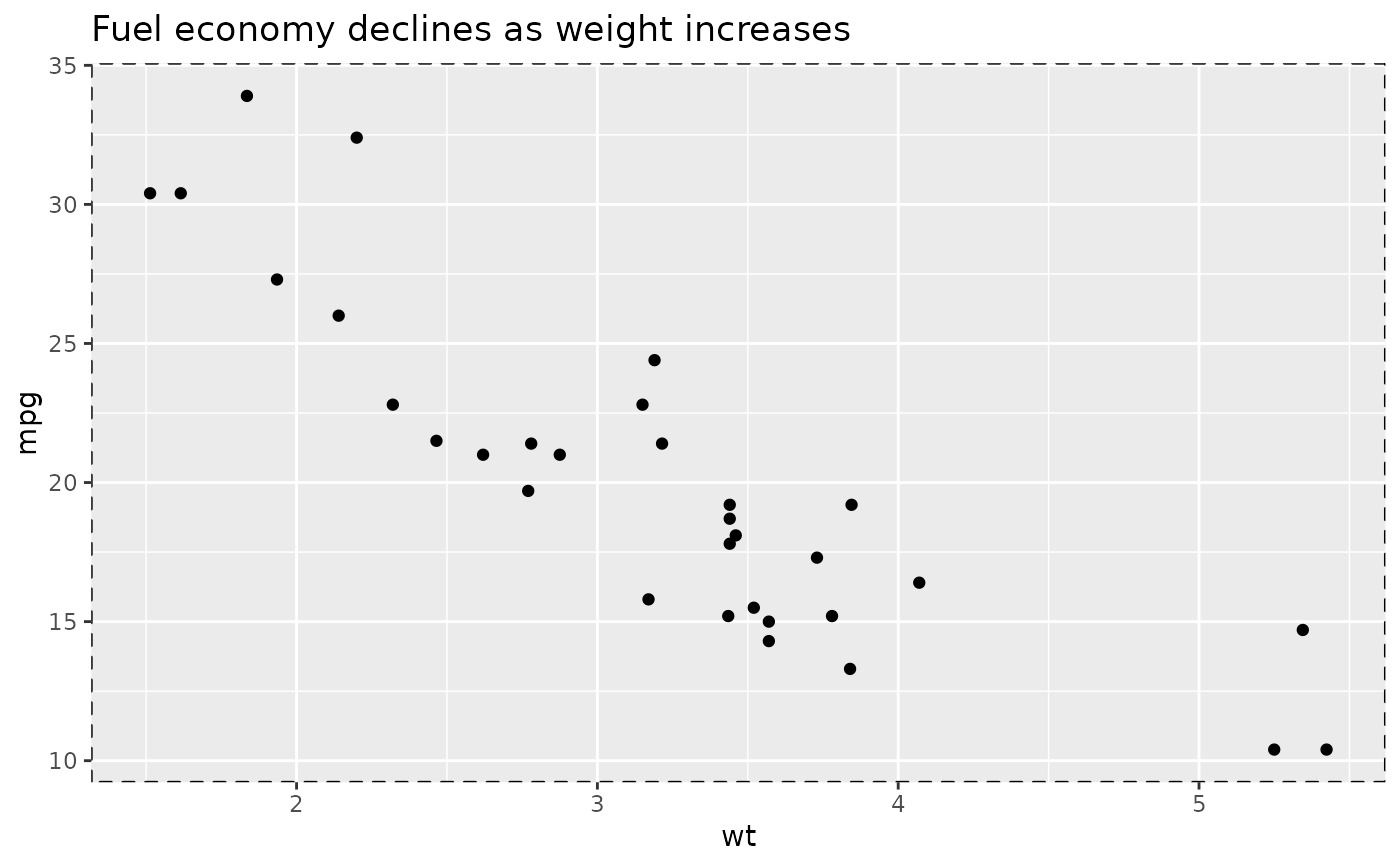 p1 + theme(panel.grid.major = element_line(colour = "black"))
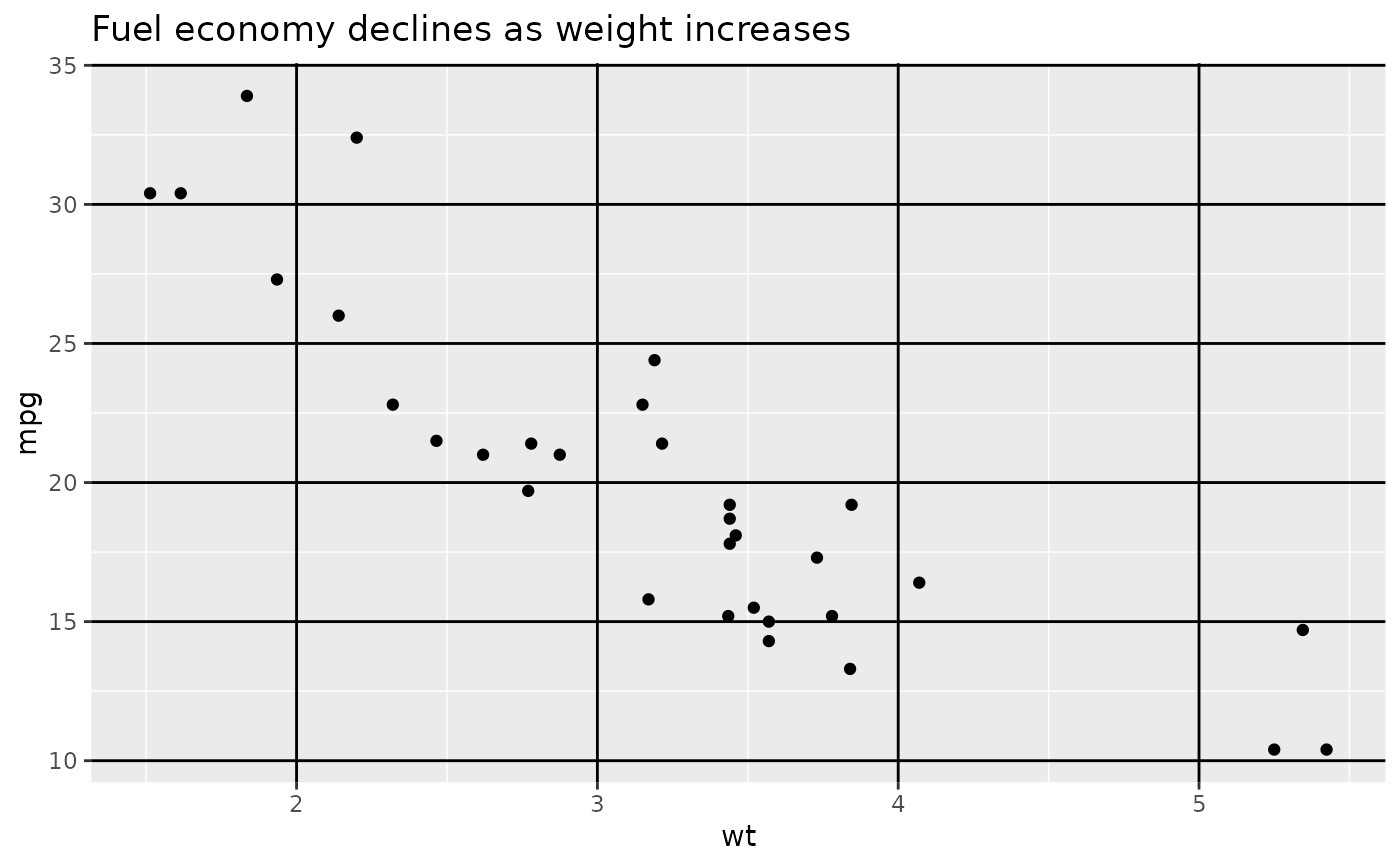 p1 + theme(
panel.grid.major.y = element_blank(),
panel.grid.minor.y = element_blank()
)
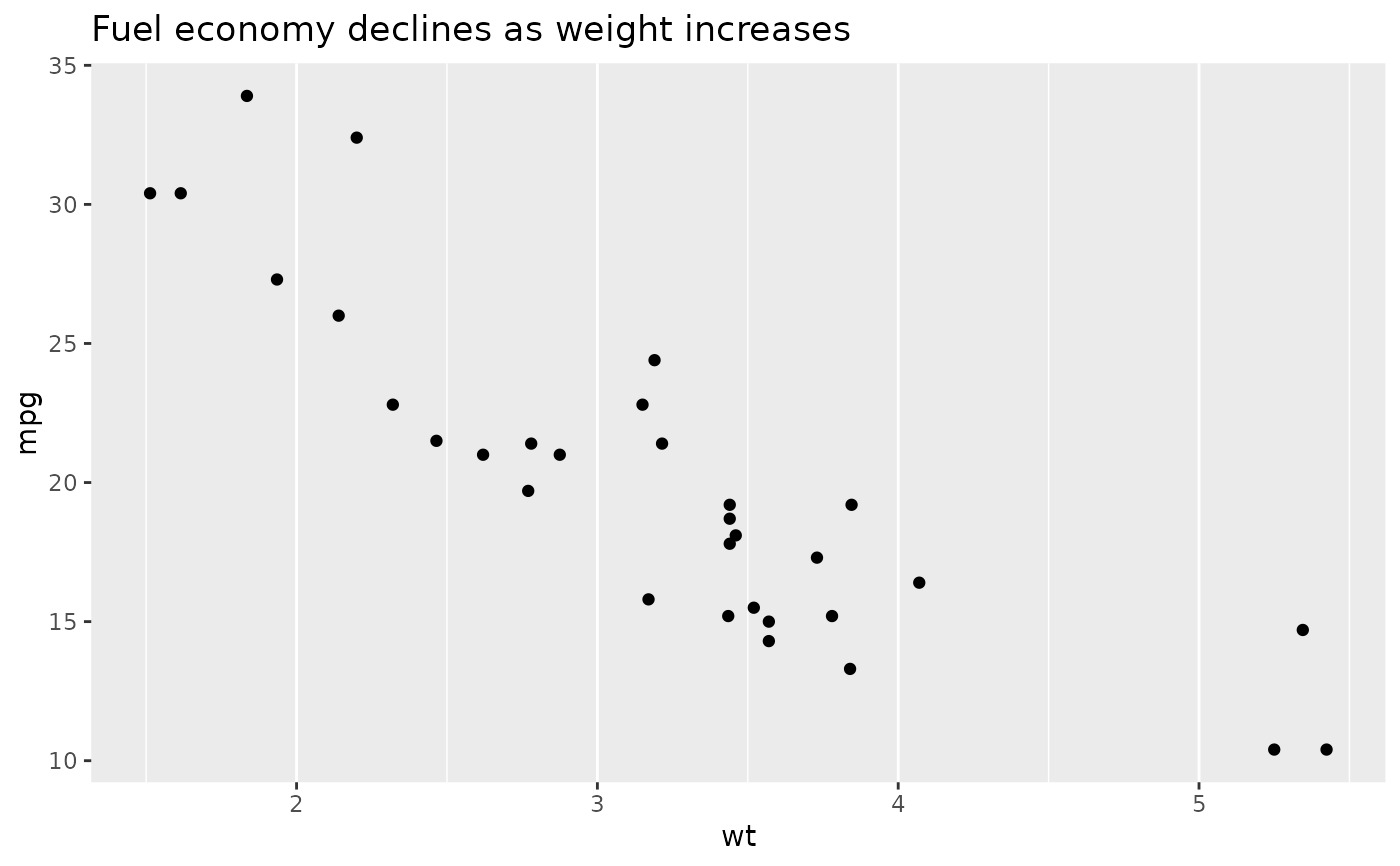 # Put gridlines on top of data
p1 + theme(
panel.background = element_rect(fill = NA),
panel.grid.major = element_line(colour = "grey50"),
panel.ontop = TRUE
)
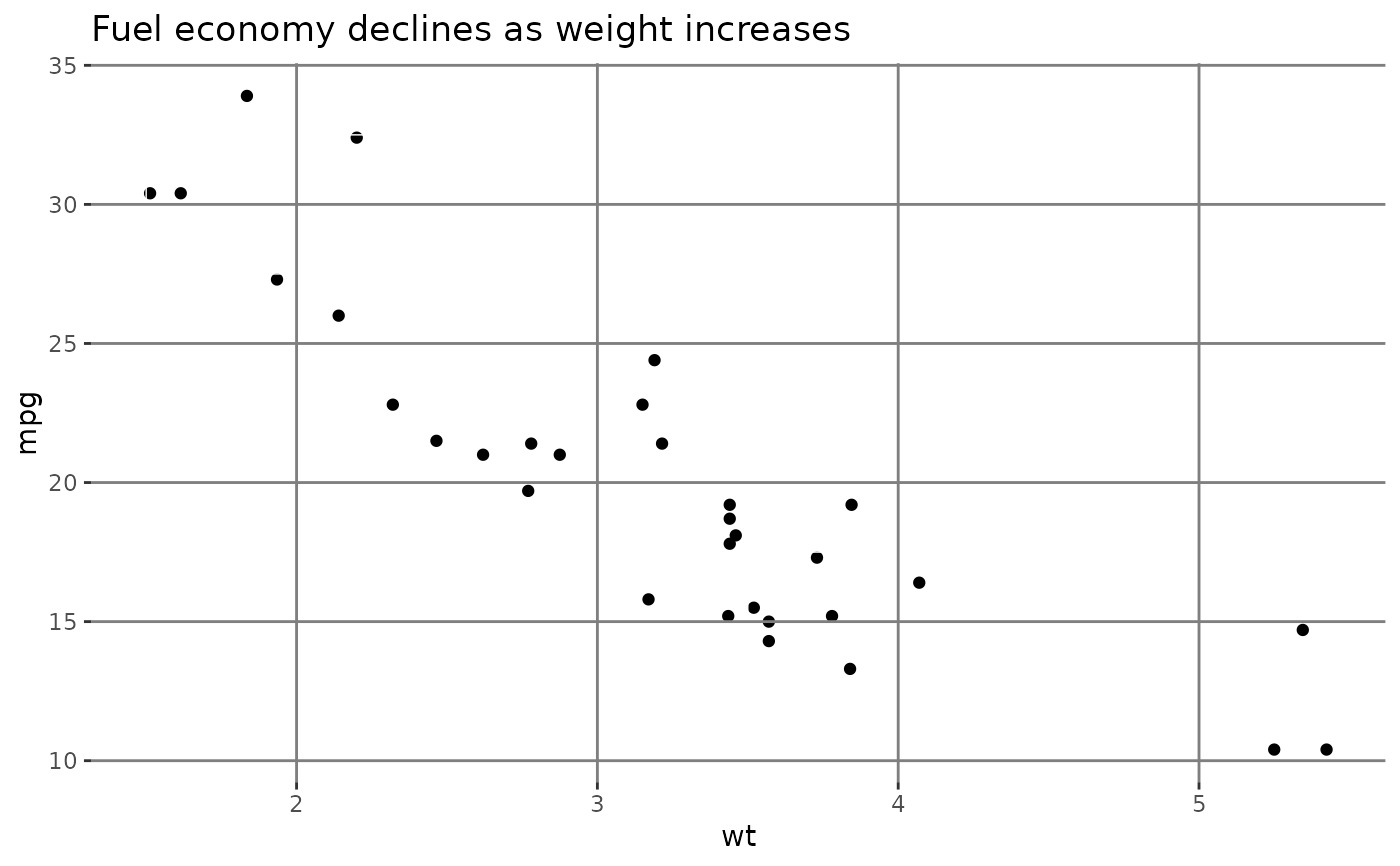 # Axes ----------------------------------------------------------------------
# Change styles of axes texts and lines
p1 + theme(axis.line = element_line(linewidth = 3, colour = "grey80"))
 p1 + theme(axis.text = element_text(colour = "blue"))
 p1 + theme(axis.ticks = element_line(linewidth = 2))
 # Change the appearance of the y-axis title
p1 + theme(axis.title.y = element_text(size = rel(1.5), angle = 90))
 # Make ticks point outwards on y-axis and inwards on x-axis
p1 + theme(
axis.ticks.length.y = unit(.25, "cm"),
axis.ticks.length.x = unit(-.25, "cm"),
axis.text.x = element_text(margin = margin(t = .3, unit = "cm"))
)
 # \donttest{
# Legend --------------------------------------------------------------------
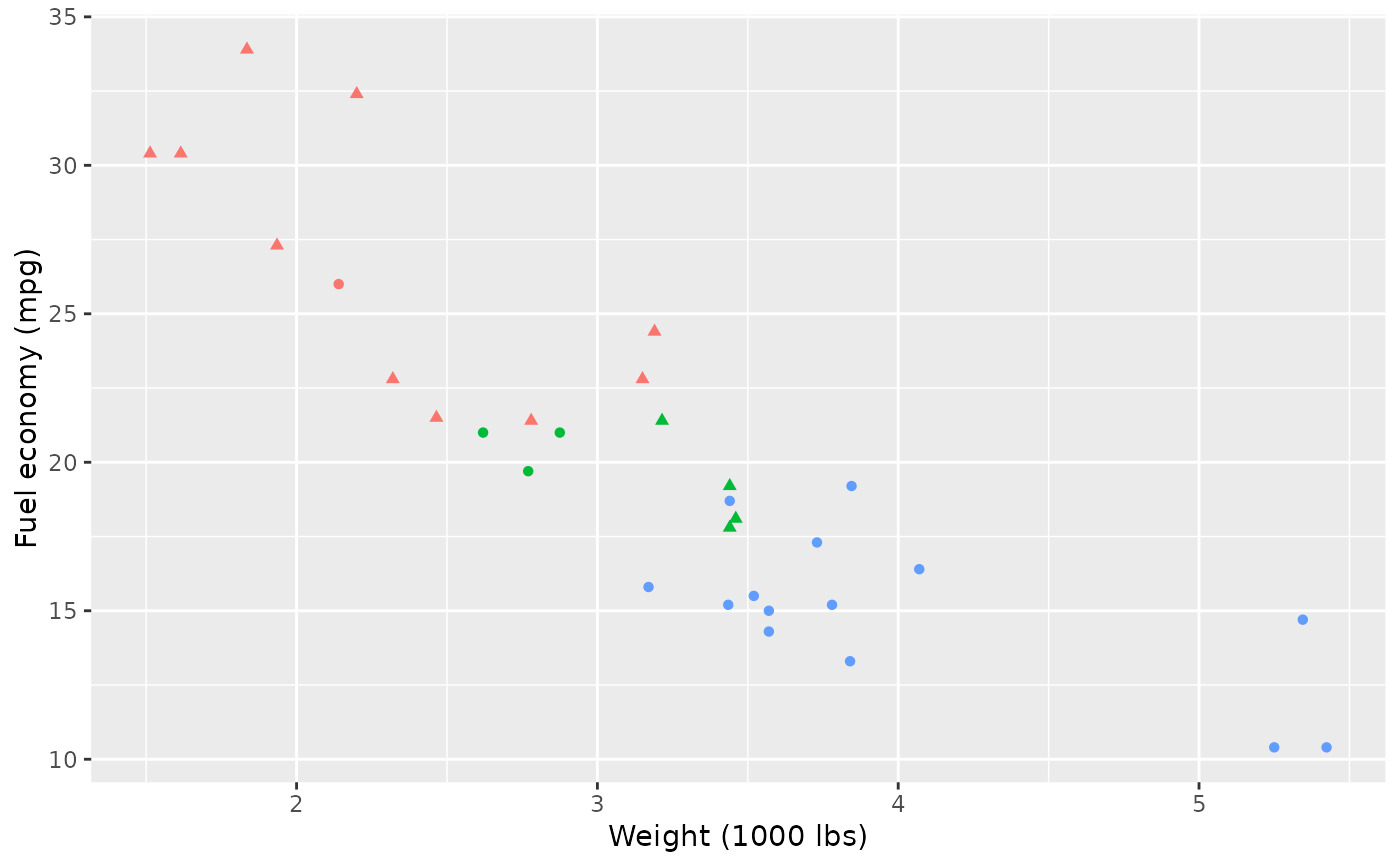
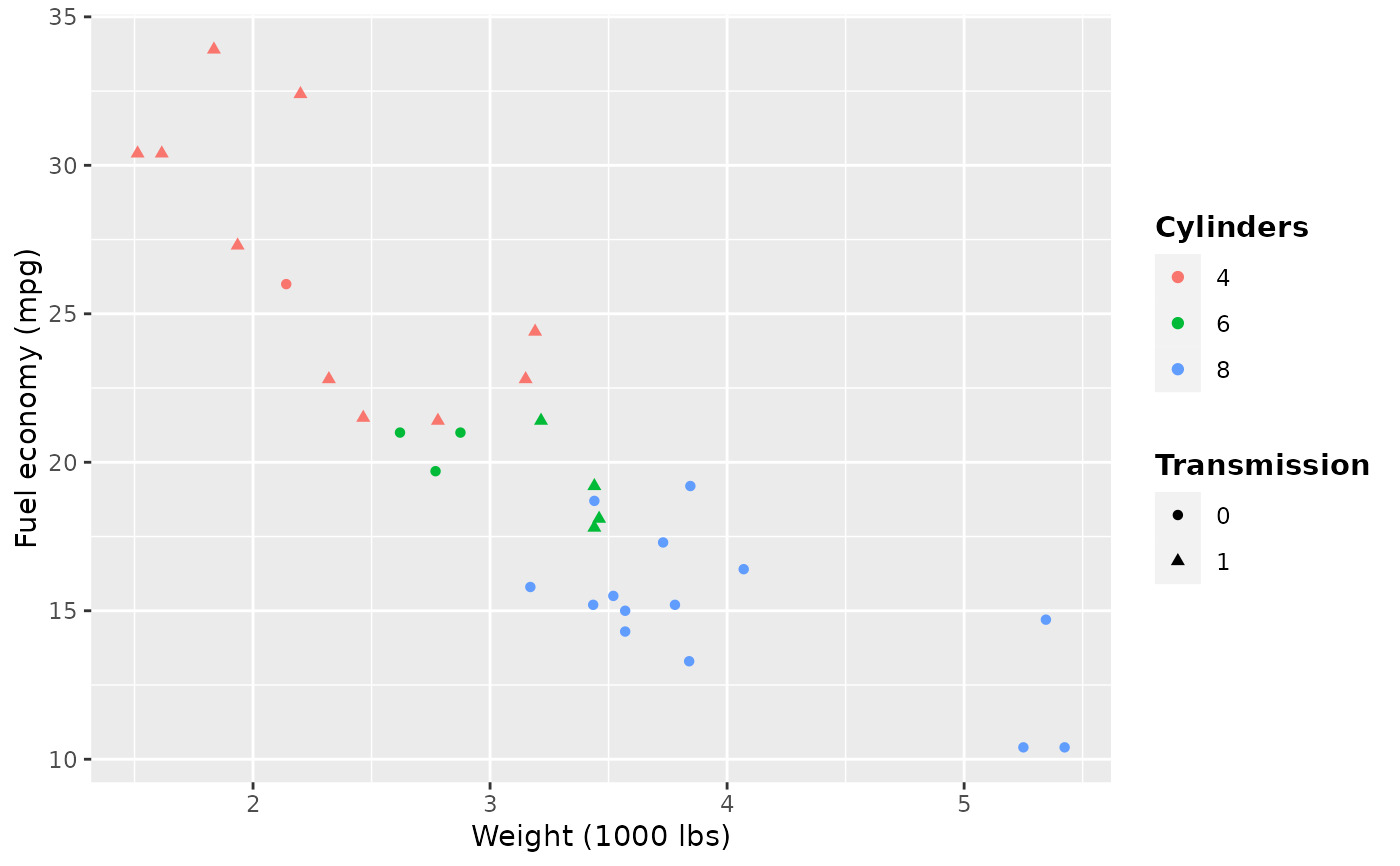
p2 <- ggplot(mtcars, aes(wt, mpg)) +
geom_point(aes(colour = factor(cyl), shape = factor(vs))) +
labs(
x = "Weight (1000 lbs)",
y = "Fuel economy (mpg)",
colour = "Cylinders",
shape = "Transmission"
)
p2
 # Position
p2 + theme(legend.position = "none")
 p2 + theme(legend.justification = "top")
 p2 + theme(legend.position = "bottom")
 # Or place legends inside the plot using relative coordinates between 0 and 1
# legend.justification sets the corner that the position refers to
p2 + theme(
legend.position = c(.95, .95),
legend.justification = c("right", "top"),
legend.box.just = "right",
legend.margin = margin(6, 6, 6, 6)
)
 # The legend.box properties work similarly for the space around
# all the legends
p2 + theme(
legend.box.background = element_rect(),
legend.box.margin = margin(6, 6, 6, 6)
)
 # You can also control the display of the keys
# and the justification related to the plot area can be set
p2 + theme(legend.key = element_rect(fill = "white", colour = "black"))
 p2 + theme(legend.text = element_text(size = 8, colour = "red"))
 p2 + theme(legend.title = element_text(face = "bold"))
 # Strips --------------------------------------------------------------------
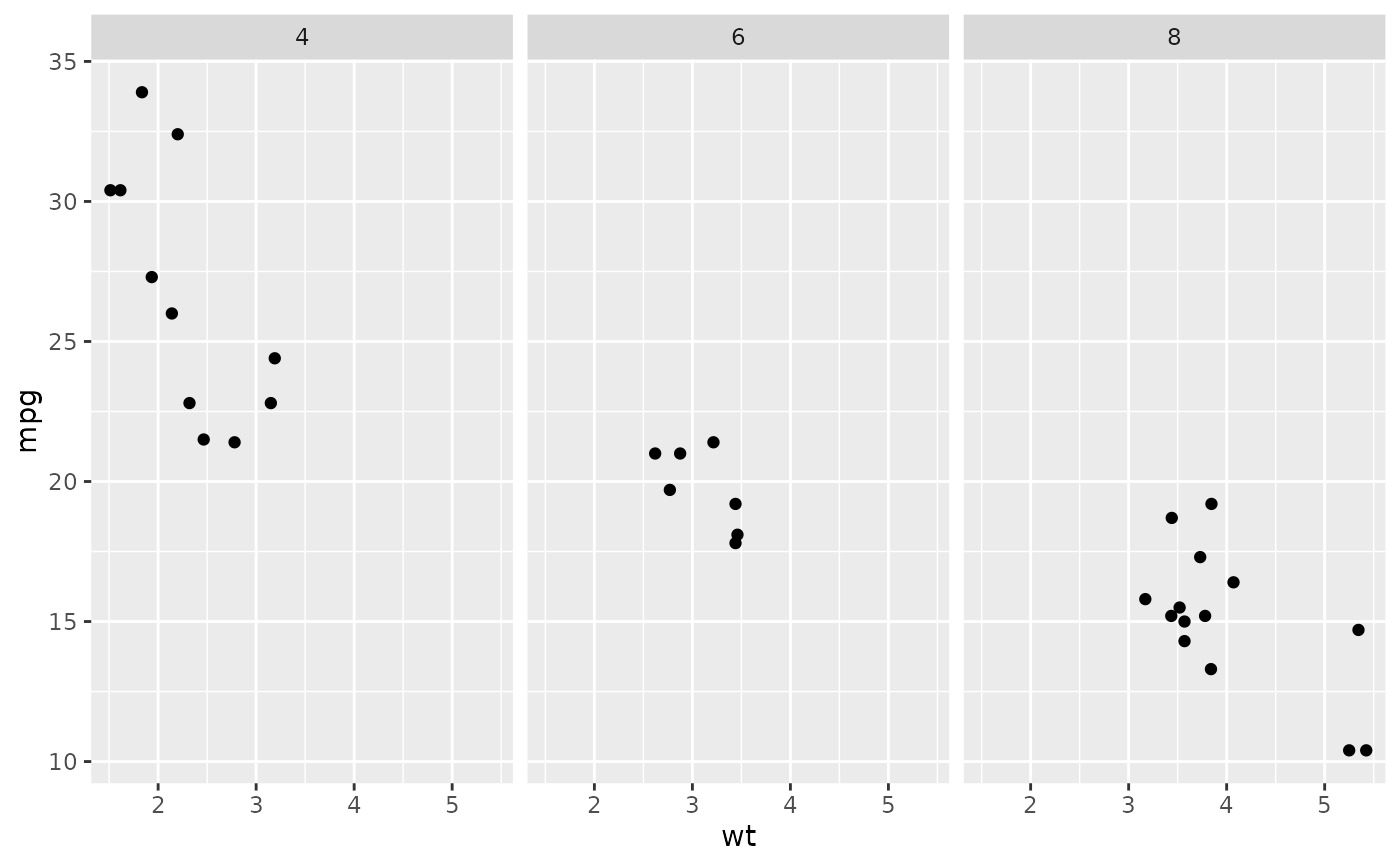
p3 <- ggplot(mtcars, aes(wt, mpg)) +
geom_point() +
facet_wrap(~ cyl)
p3
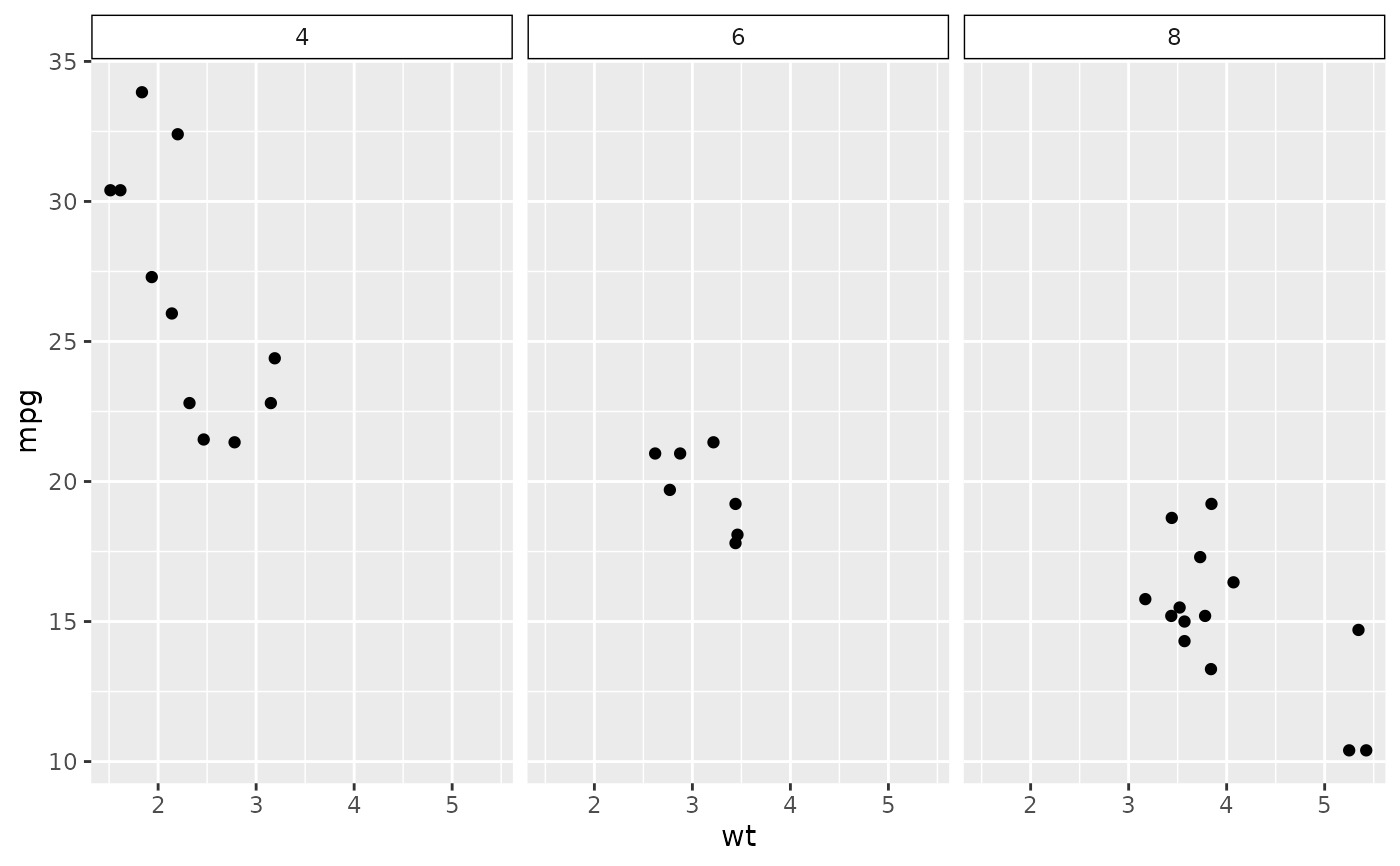
 p3 + theme(strip.background = element_rect(colour = "black", fill = "white"))
 p3 + theme(strip.text.x = element_text(colour = "white", face = "bold"))
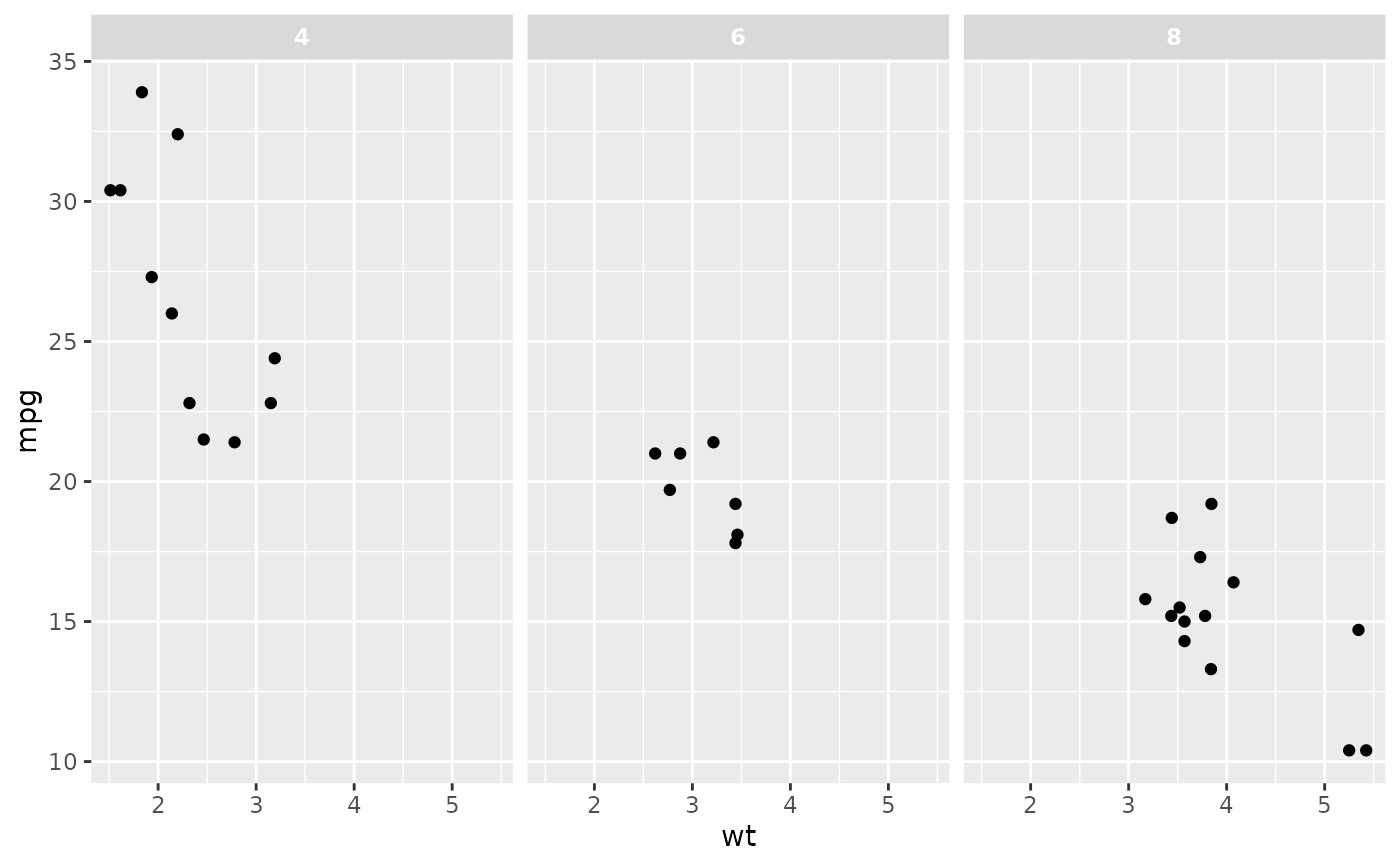 # More direct strip.text.x here for top
# as in the facet_wrap the default strip.position is "top"
p3 + theme(strip.text.x.top = element_text(colour = "white", face = "bold"))
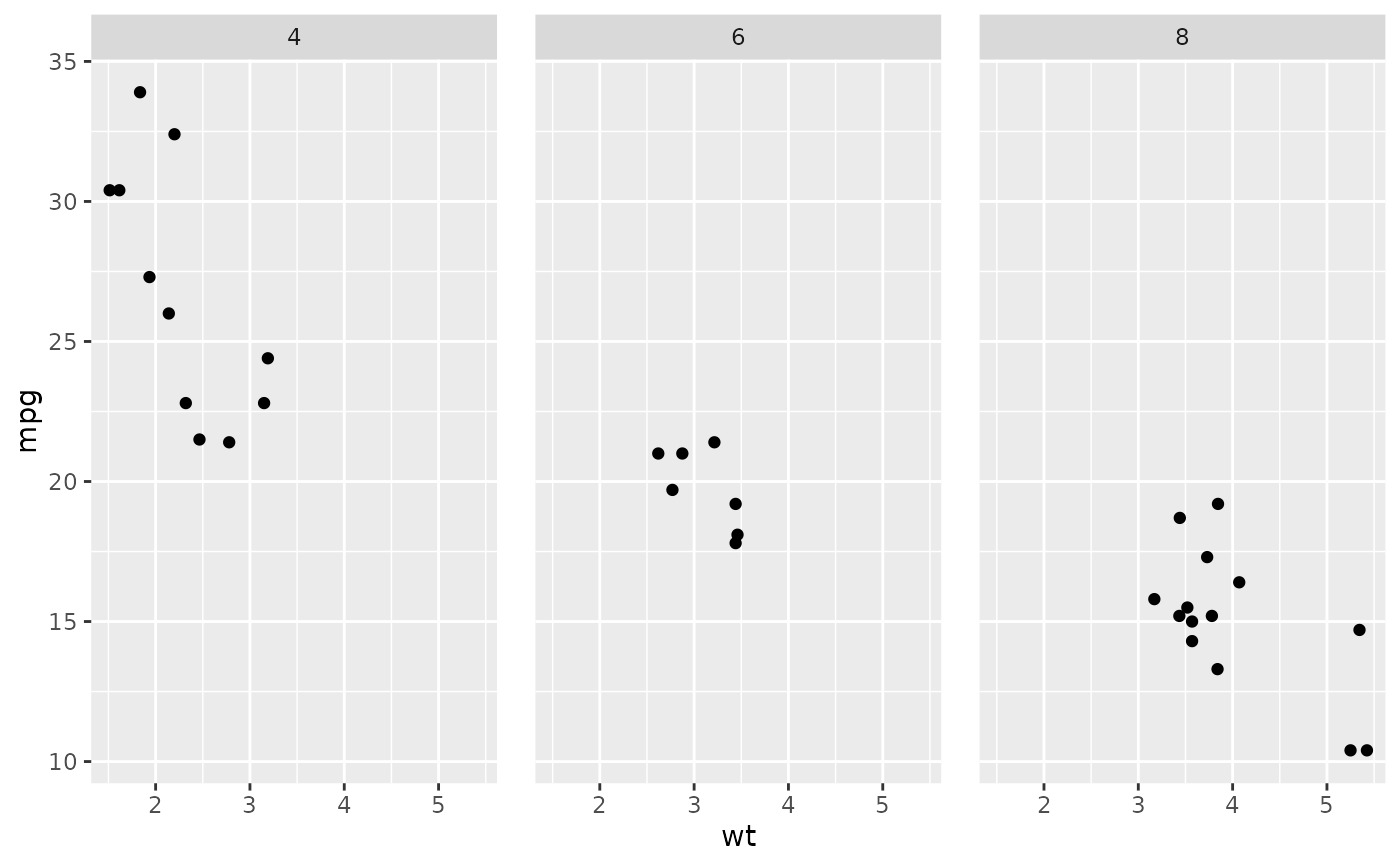
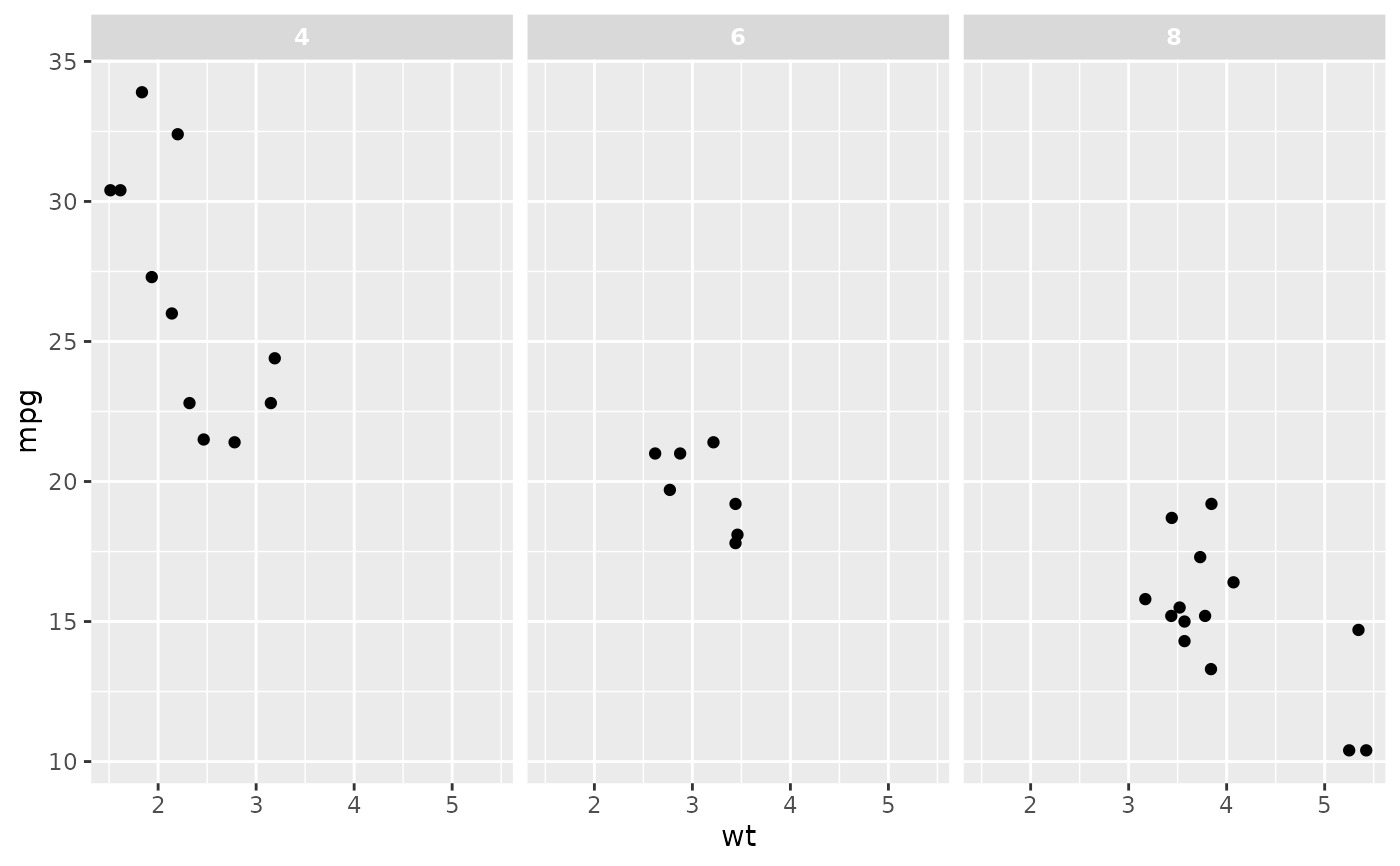 p3 + theme(panel.spacing = unit(1, "lines"))
 # }
# }
相關用法
- R ggplot2 theme_get 獲取、設置和修改活動主題
- R ggplot2 annotation_logticks 注釋:記錄刻度線
- R ggplot2 vars 引用分麵變量
- R ggplot2 position_stack 將重疊的對象堆疊在一起
- R ggplot2 geom_qq 分位數-分位數圖
- R ggplot2 geom_spoke 由位置、方向和距離參數化的線段
- R ggplot2 geom_quantile 分位數回歸
- R ggplot2 geom_text 文本
- R ggplot2 get_alt_text 從繪圖中提取替代文本
- R ggplot2 annotation_custom 注釋:自定義grob
- R ggplot2 geom_ribbon 函數區和麵積圖
- R ggplot2 stat_ellipse 計算法行數據橢圓
- R ggplot2 resolution 計算數值向量的“分辨率”
- R ggplot2 geom_boxplot 盒須圖(Tukey 風格)
- R ggplot2 lims 設置規模限製
- R ggplot2 geom_hex 二維箱計數的六邊形熱圖
- R ggplot2 scale_gradient 漸變色階
- R ggplot2 scale_shape 形狀比例,又稱字形
- R ggplot2 geom_bar 條形圖
- R ggplot2 draw_key 圖例的關鍵字形
- R ggplot2 annotate 創建注釋層
- R ggplot2 label_bquote 帶有數學表達式的標簽
- R ggplot2 annotation_map 注釋:Map
- R ggplot2 scale_viridis 來自 viridisLite 的 Viridis 色標
- R ggplot2 coord_fixed 具有固定“縱橫比”的笛卡爾坐標
注:本文由純淨天空篩選整理自Hadley Wickham等大神的英文原創作品 Modify components of a theme。非經特殊聲明,原始代碼版權歸原作者所有,本譯文未經允許或授權,請勿轉載或複製。
