這些是控製所有非數據顯示的完整主題。如果您隻需要調整現有主題的顯示,請使用theme()。
用法
theme_grey(
  base_size = 11,
  base_family = "",
  base_line_size = base_size/22,
  base_rect_size = base_size/22
)

theme_gray(
  base_size = 11,
  base_family = "",
  base_line_size = base_size/22,
  base_rect_size = base_size/22
)

theme_bw(
  base_size = 11,
  base_family = "",
  base_line_size = base_size/22,
  base_rect_size = base_size/22
)

theme_linedraw(
  base_size = 11,
  base_family = "",
  base_line_size = base_size/22,
  base_rect_size = base_size/22
)

theme_light(
  base_size = 11,
  base_family = "",
  base_line_size = base_size/22,
  base_rect_size = base_size/22
)

theme_dark(
  base_size = 11,
  base_family = "",
  base_line_size = base_size/22,
  base_rect_size = base_size/22
)

theme_minimal(
  base_size = 11,
  base_family = "",
  base_line_size = base_size/22,
  base_rect_size = base_size/22
)

theme_classic(
  base_size = 11,
  base_family = "",
  base_line_size = base_size/22,
  base_rect_size = base_size/22
)

theme_void(
  base_size = 11,
  base_family = "",
  base_line_size = base_size/22,
  base_rect_size = base_size/22
)

theme_test(
  base_size = 11,
  base_family = "",
  base_line_size = base_size/22,
  base_rect_size = base_size/22
)細節
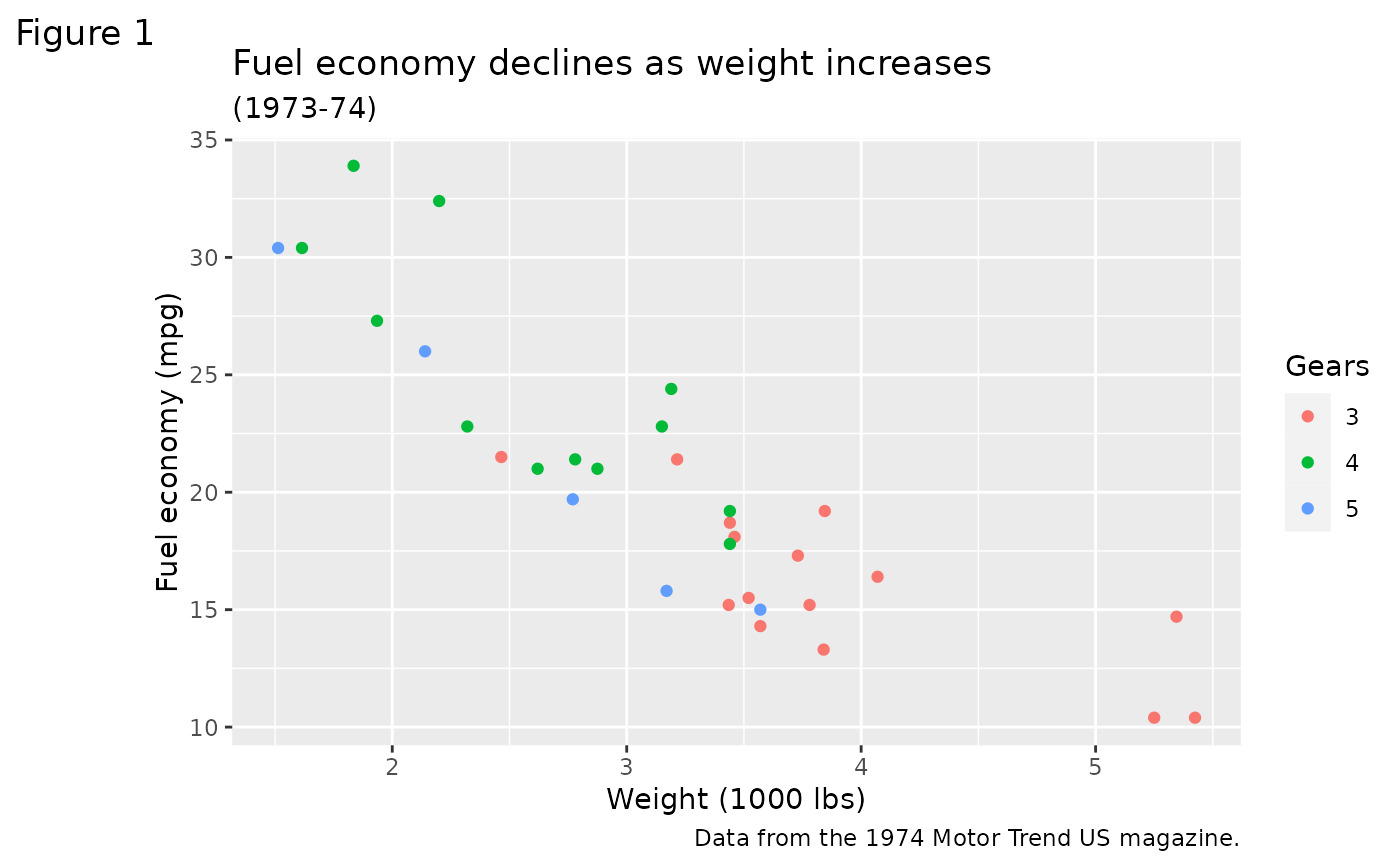
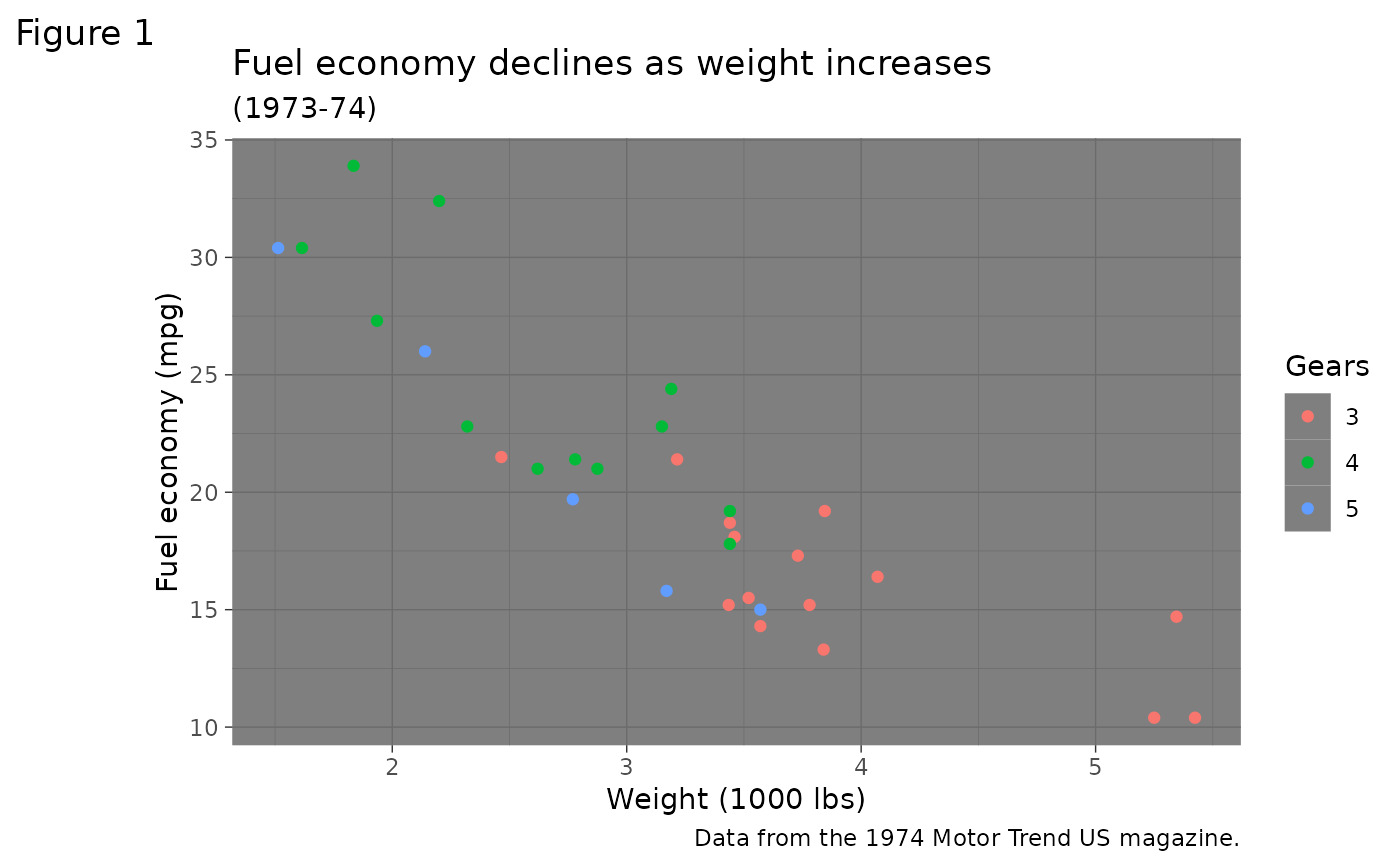
theme_gray()-
帶有灰色背景和白色網格線的標誌性 ggplot2 主題,旨在將數據向前推進,同時使比較變得容易。
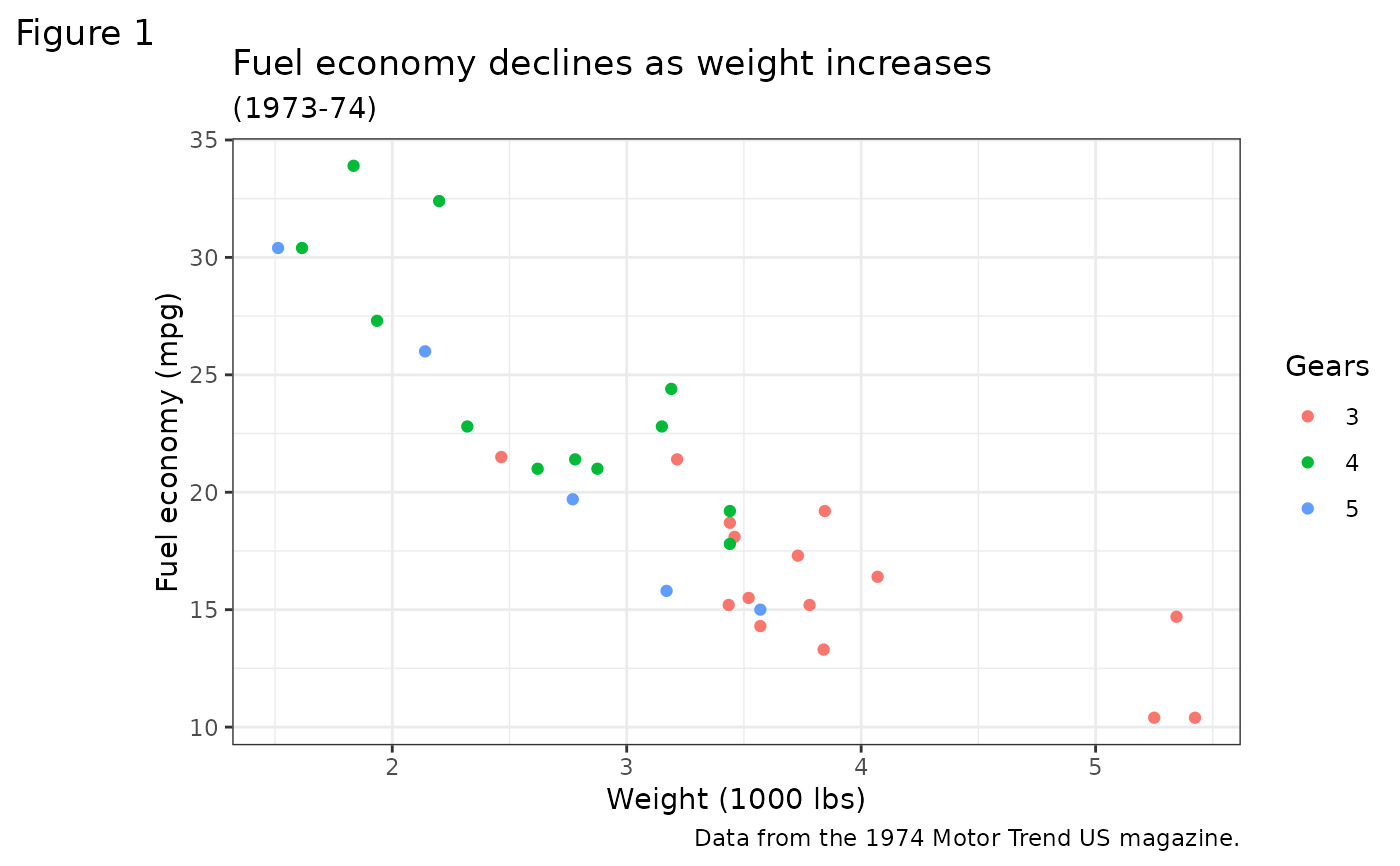
theme_bw()-
經典的 dark-on-light ggplot2 主題。可能更適合使用投影儀顯示的演示文稿。
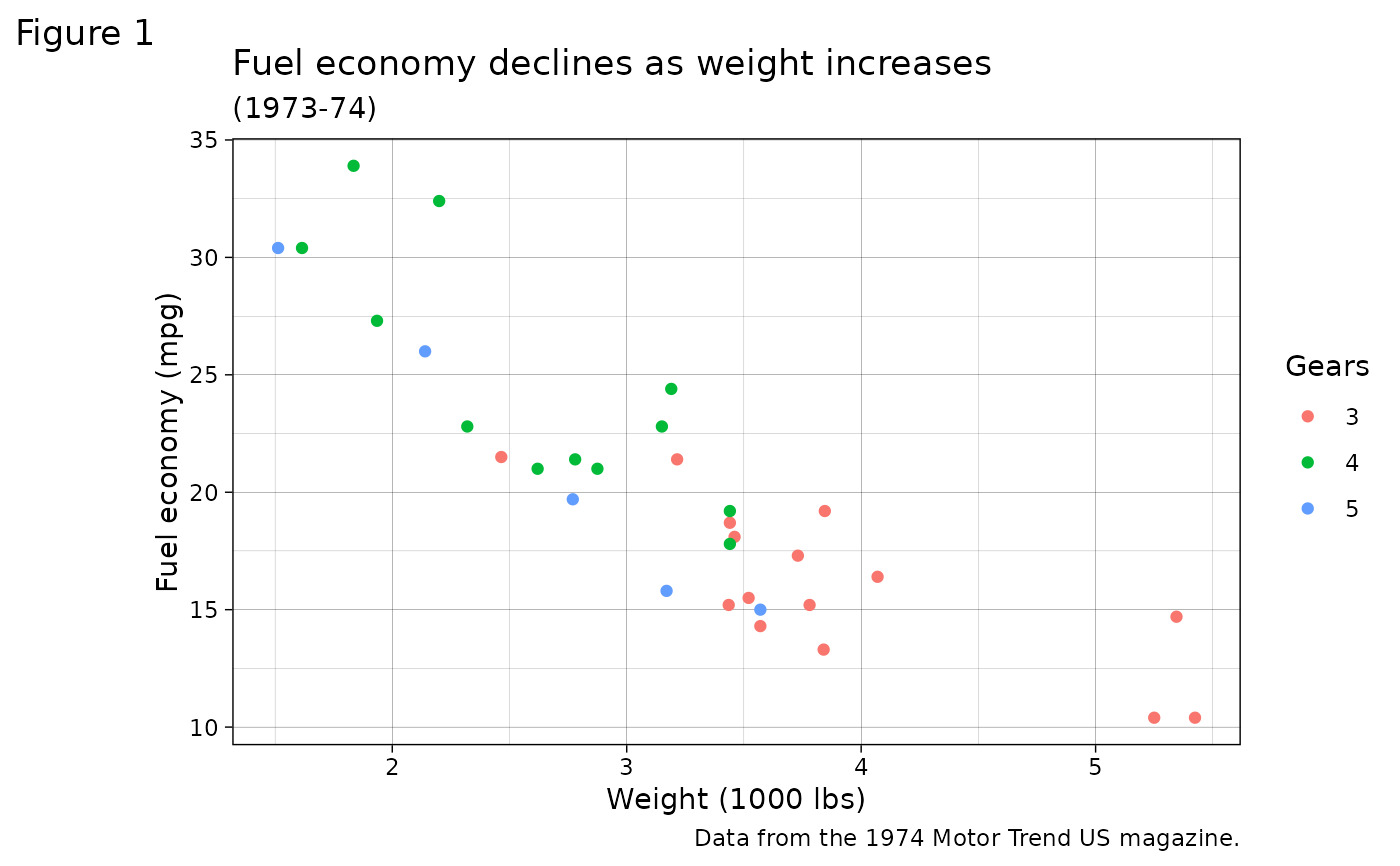
theme_linedraw()-
白色背景上隻有各種寬度的黑色線條的主題,讓人想起線條畫。其用途與
theme_bw()類似。請注意,這個主題有一些非常細的線條(<< 1 pt),一些期刊可能會拒絕。 theme_light()-
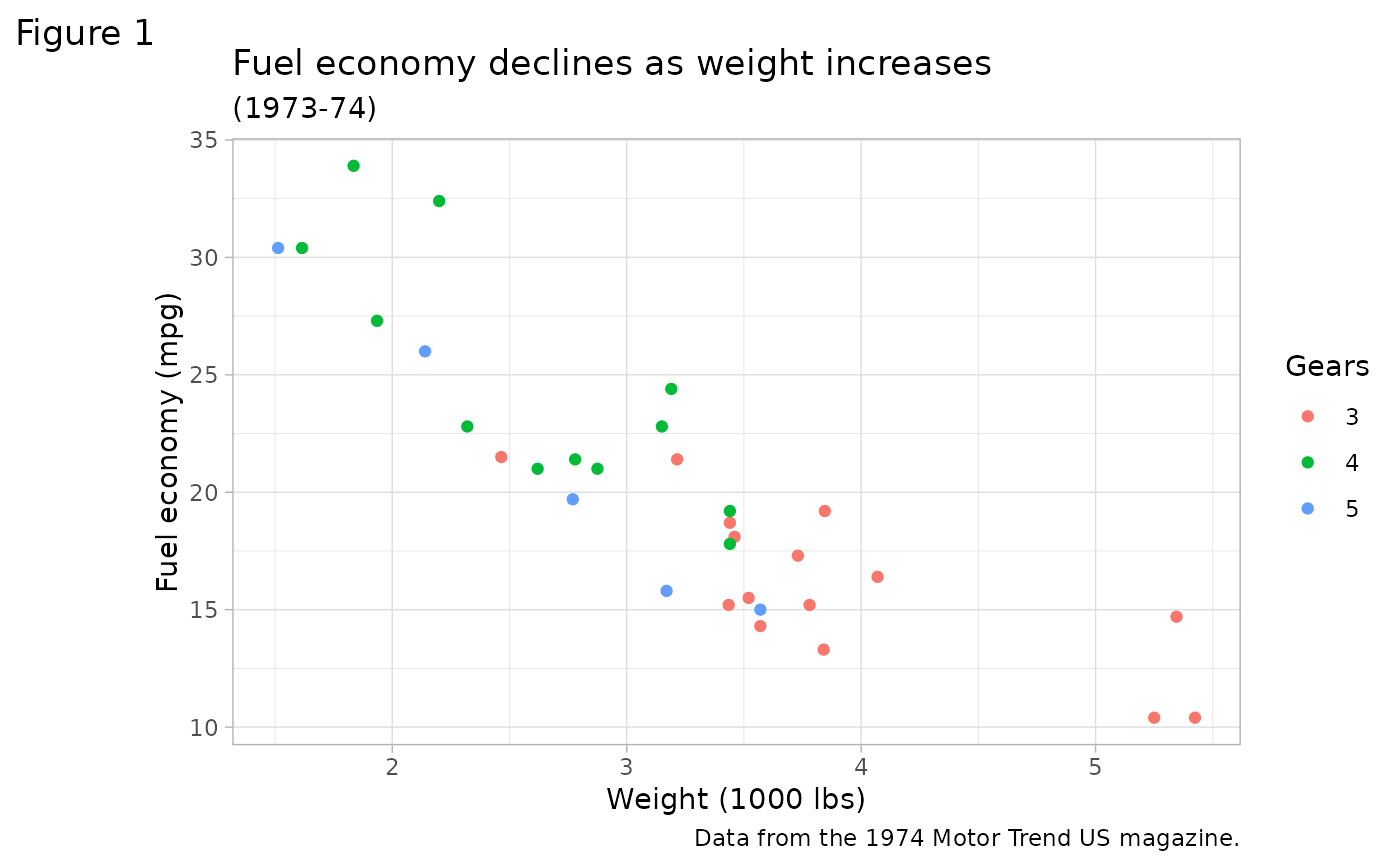
主題類似於
theme_linedraw(),但具有淺灰色的線條和軸,以將更多注意力引向數據。 theme_dark()-
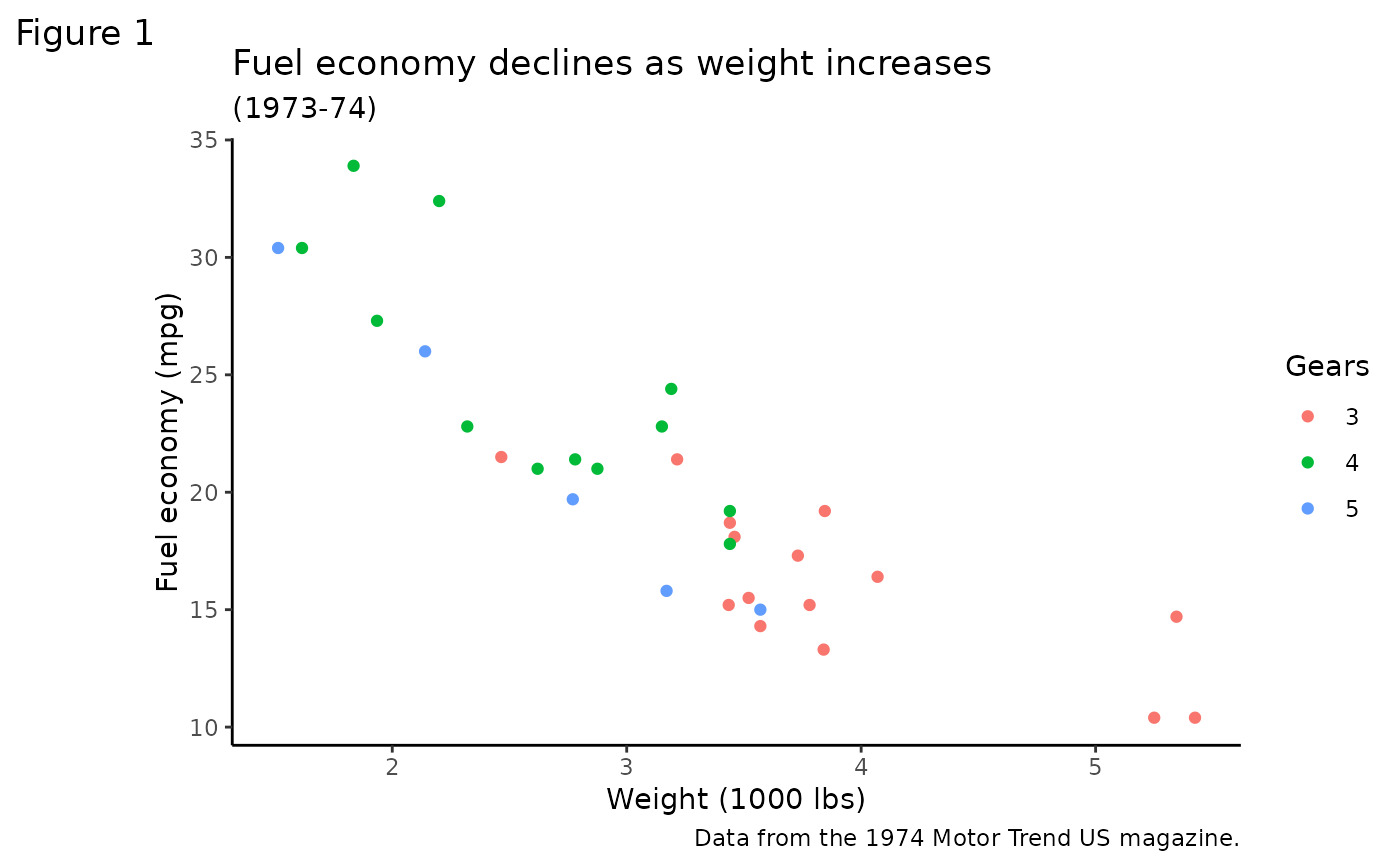
theme_light()的深色表親,具有相似的線條大小,但背景為深色。有助於突出彩色細線。 theme_minimal()-
沒有背景注釋的簡約主題。
theme_classic()-
classic-looking 主題,有 x 和 y 軸線,沒有網格線。
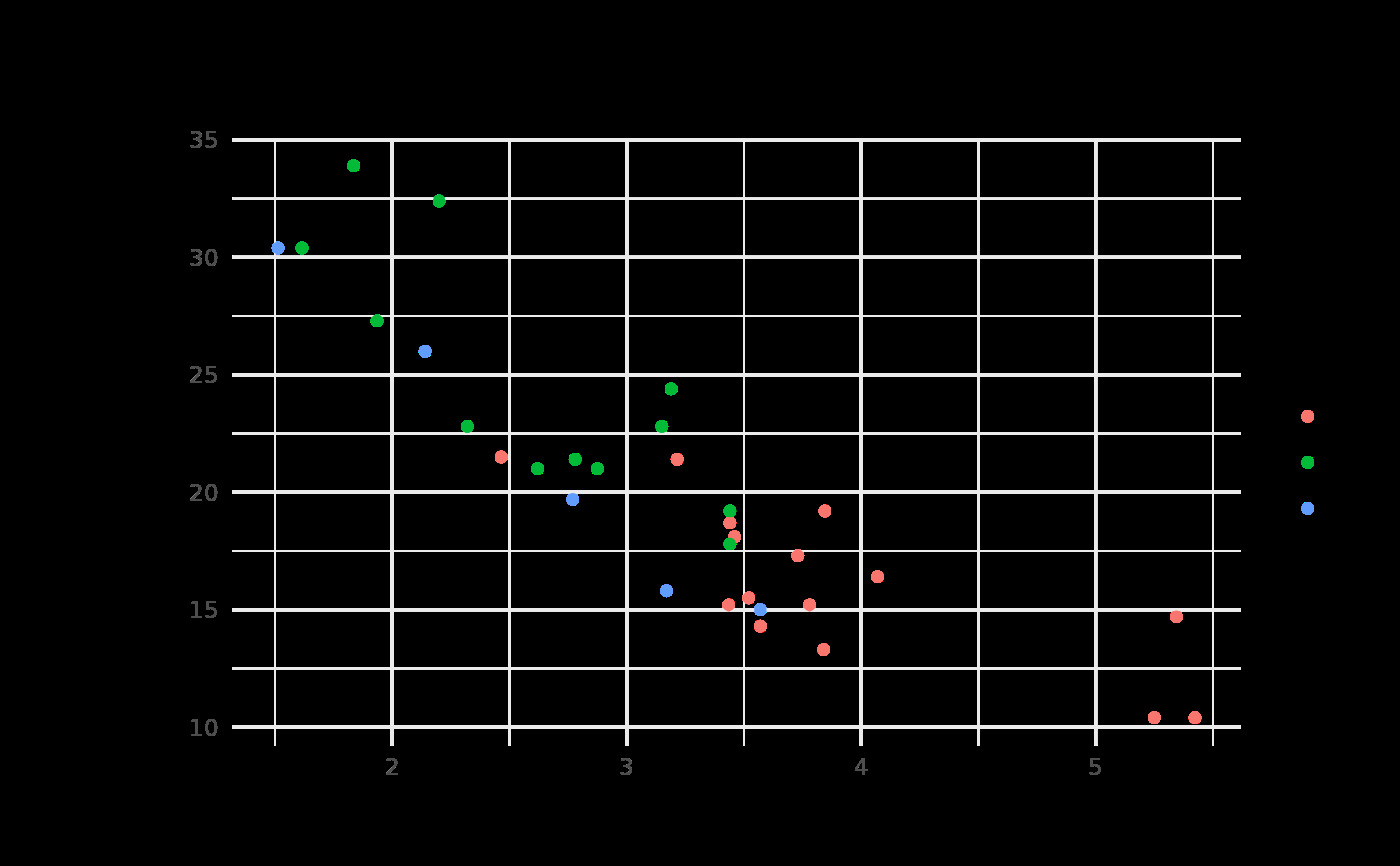
theme_void()-
一個完全空洞的主題。
theme_test()-
視覺單元測試的主題。理想情況下,除了新函數之外,它應該永遠不會改變。
例子
mtcars2 <- within(mtcars, {
vs <- factor(vs, labels = c("V-shaped", "Straight"))
am <- factor(am, labels = c("Automatic", "Manual"))
cyl <- factor(cyl)
gear <- factor(gear)
})
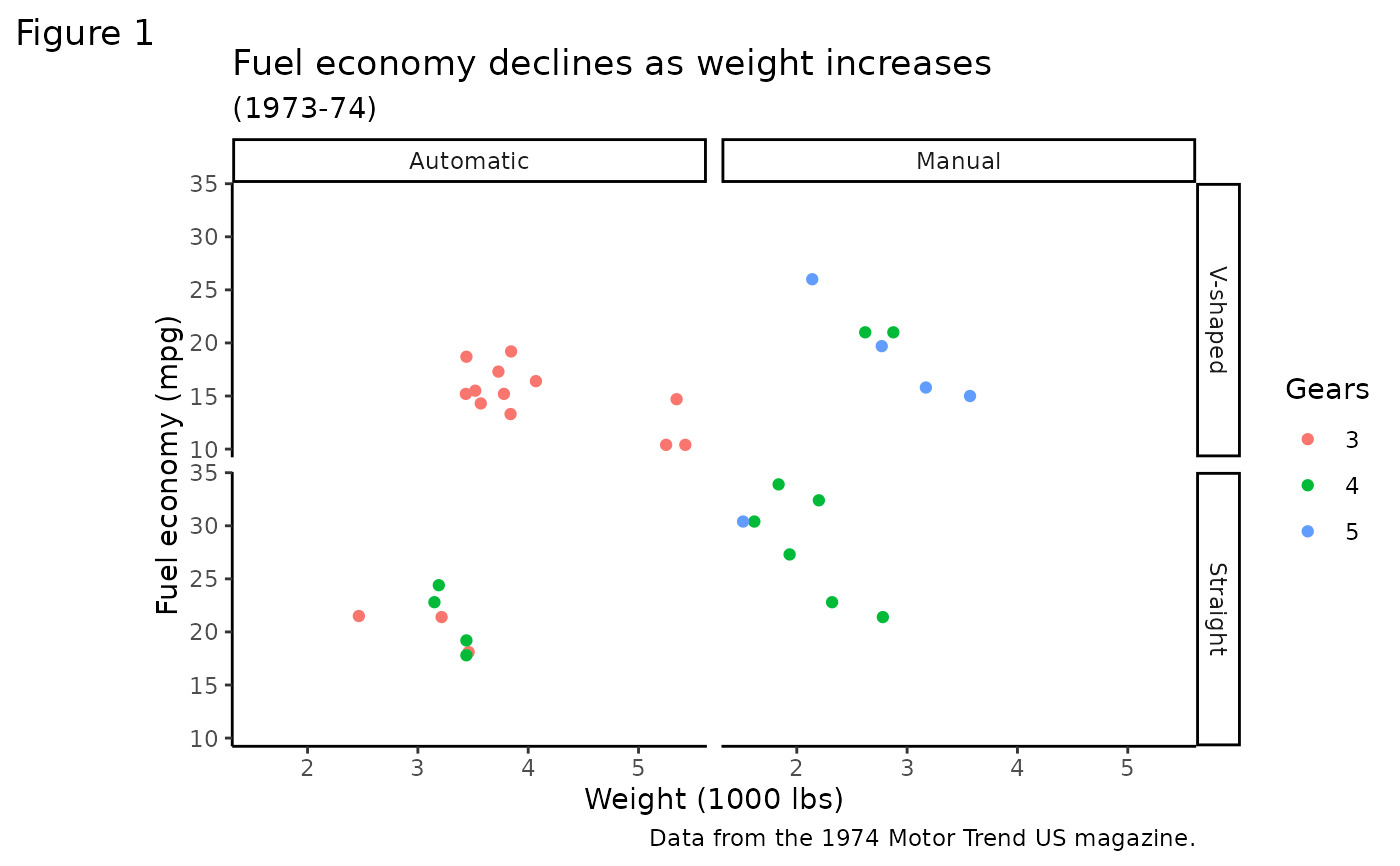
p1 <- ggplot(mtcars2) +
geom_point(aes(x = wt, y = mpg, colour = gear)) +
labs(
title = "Fuel economy declines as weight increases",
subtitle = "(1973-74)",
caption = "Data from the 1974 Motor Trend US magazine.",
tag = "Figure 1",
x = "Weight (1000 lbs)",
y = "Fuel economy (mpg)",
colour = "Gears"
)
p1 + theme_gray() # the default
 p1 + theme_bw()
 p1 + theme_linedraw()
 p1 + theme_light()
 p1 + theme_dark()
 p1 + theme_minimal()
 p1 + theme_classic()
 p1 + theme_void()
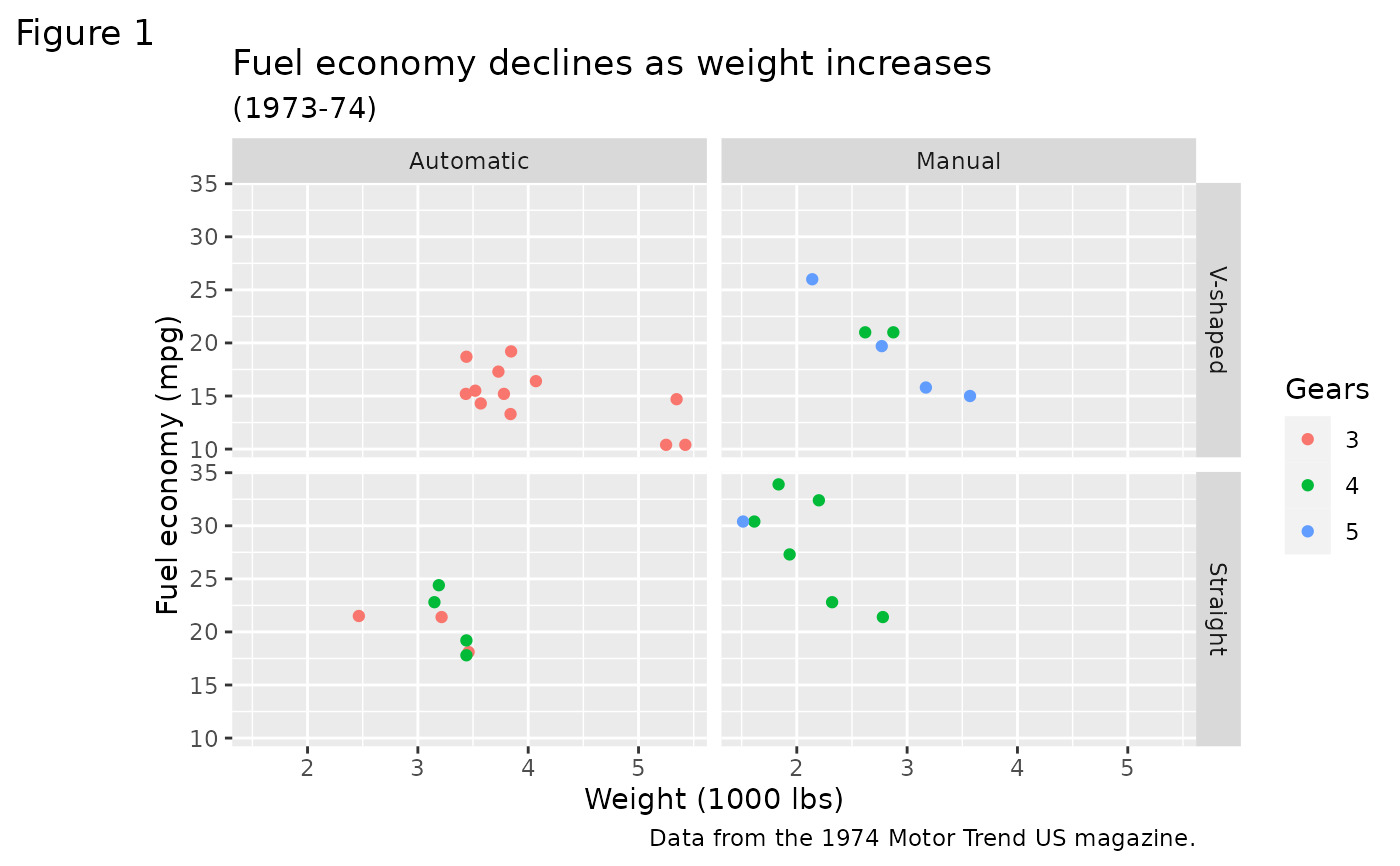
 # Theme examples with panels
# \donttest{
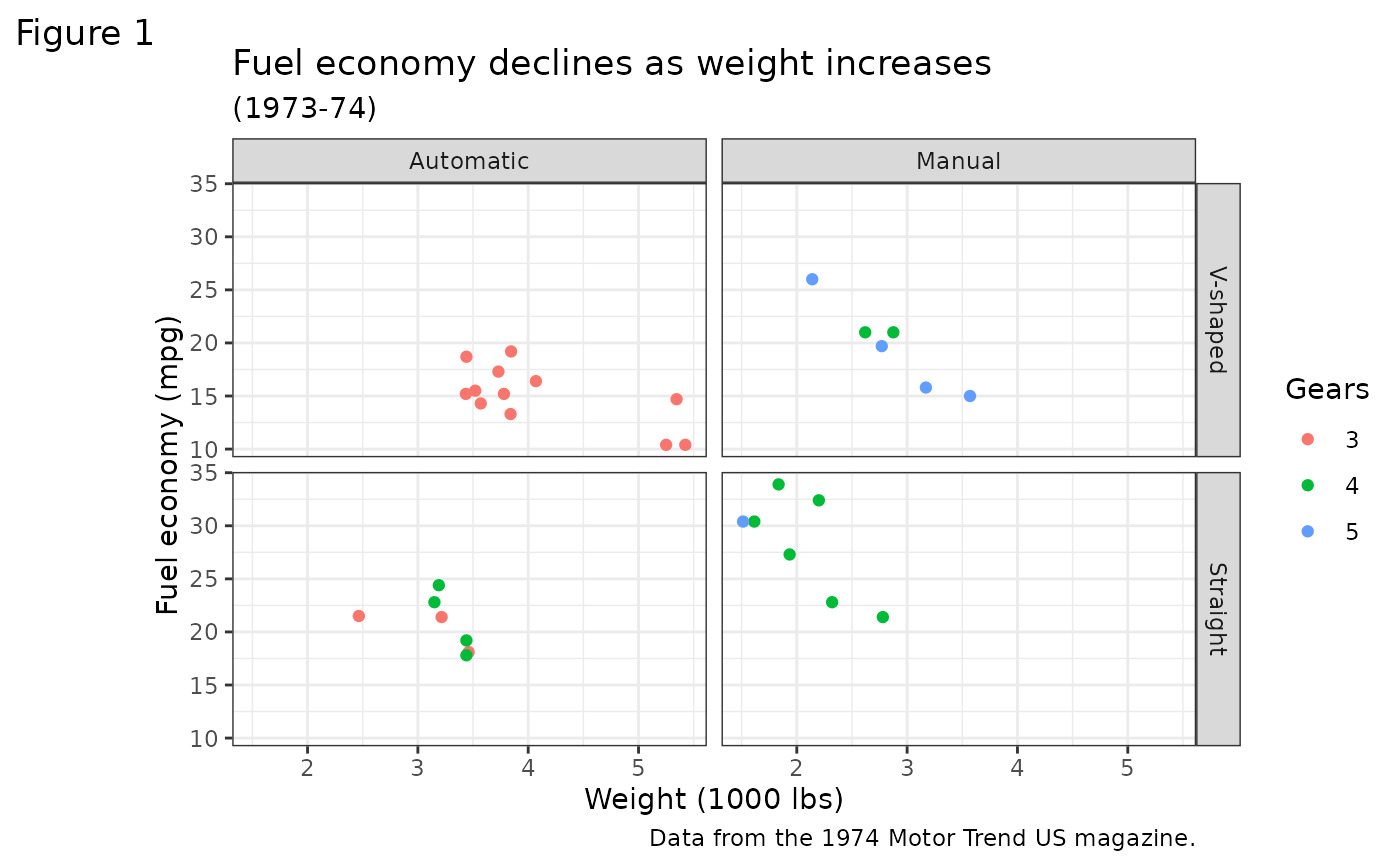
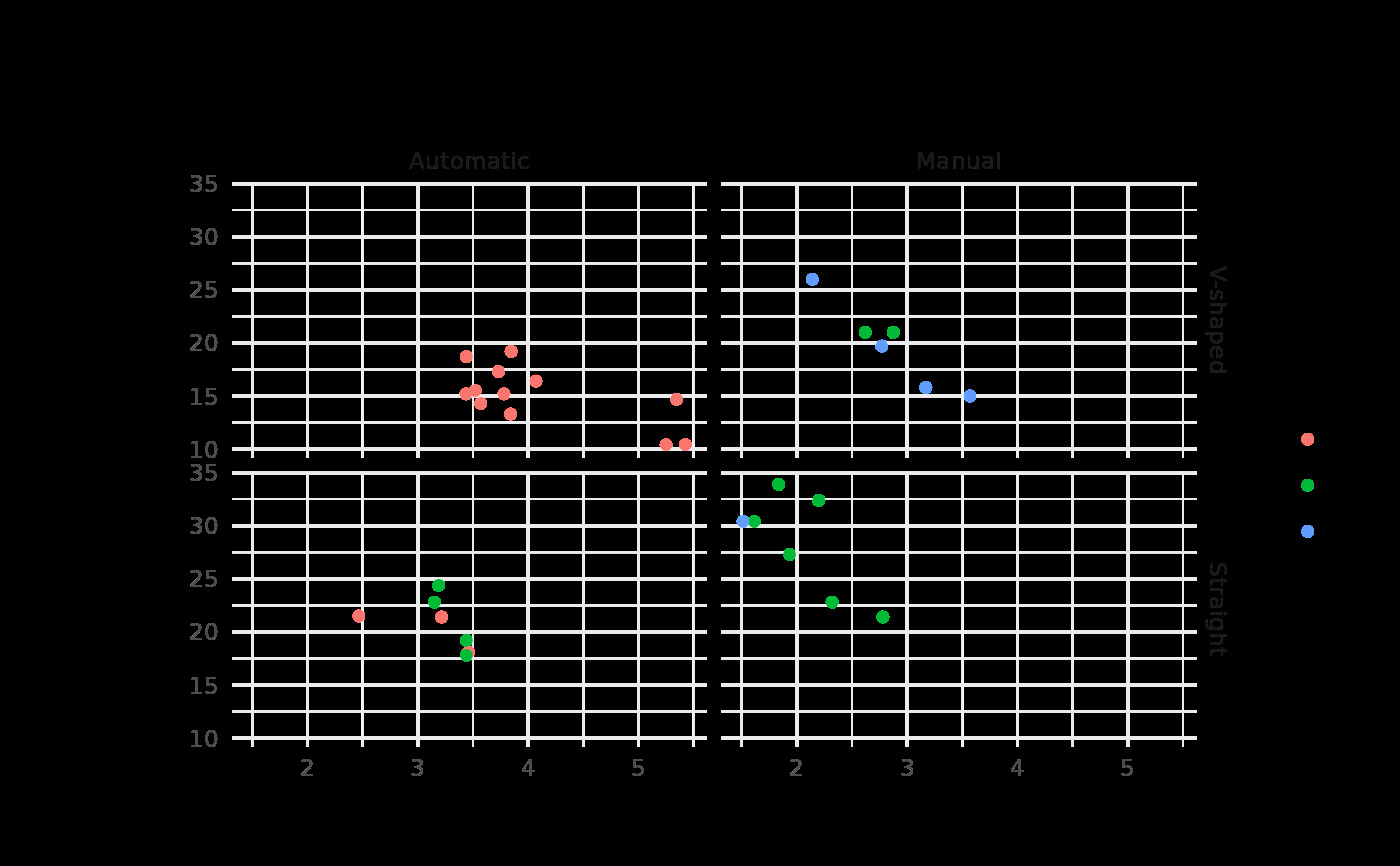
p2 <- p1 + facet_grid(vs ~ am)
p2 + theme_gray() # the default
# Theme examples with panels
# \donttest{
p2 <- p1 + facet_grid(vs ~ am)
p2 + theme_gray() # the default
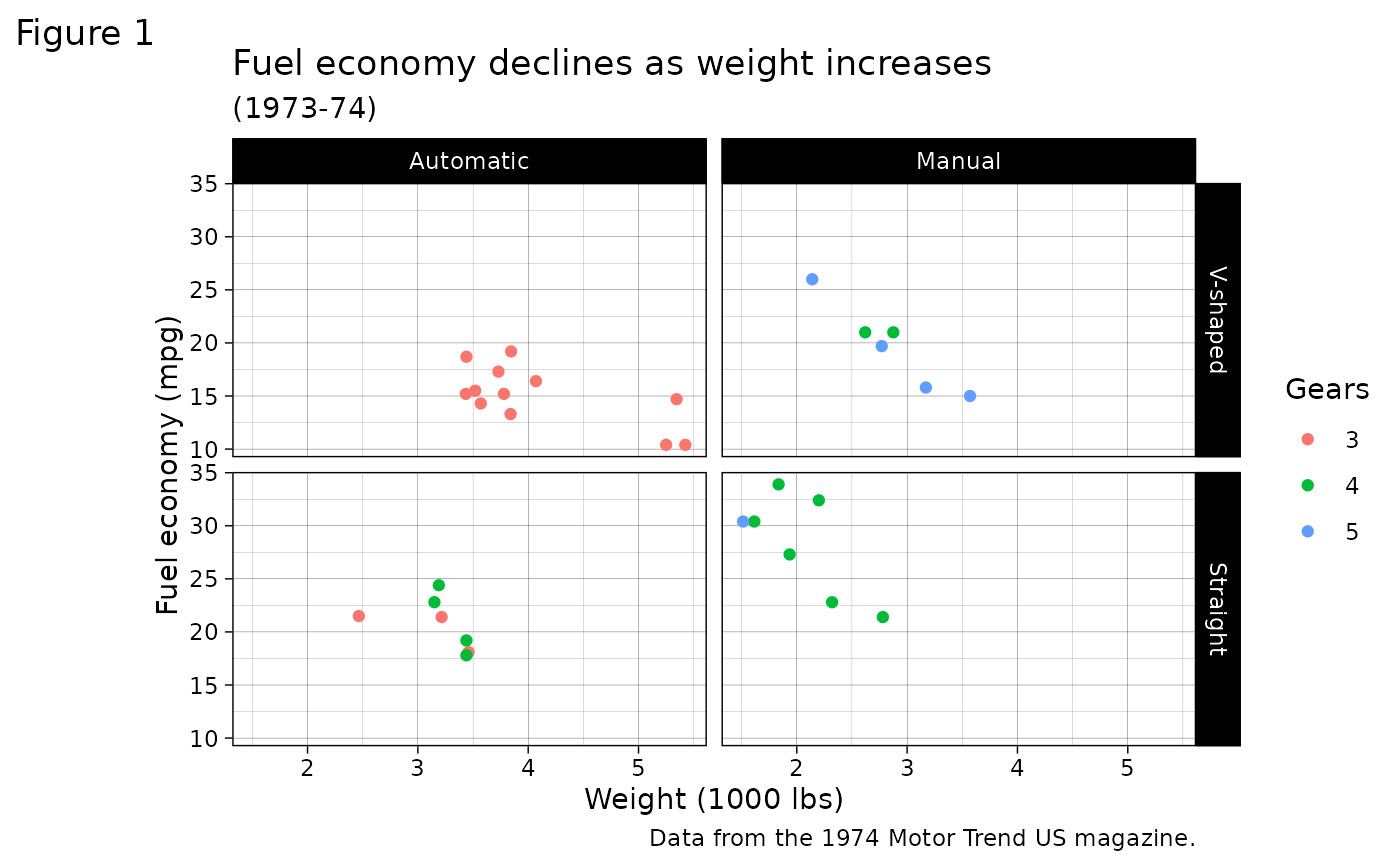
 p2 + theme_bw()
 p2 + theme_linedraw()
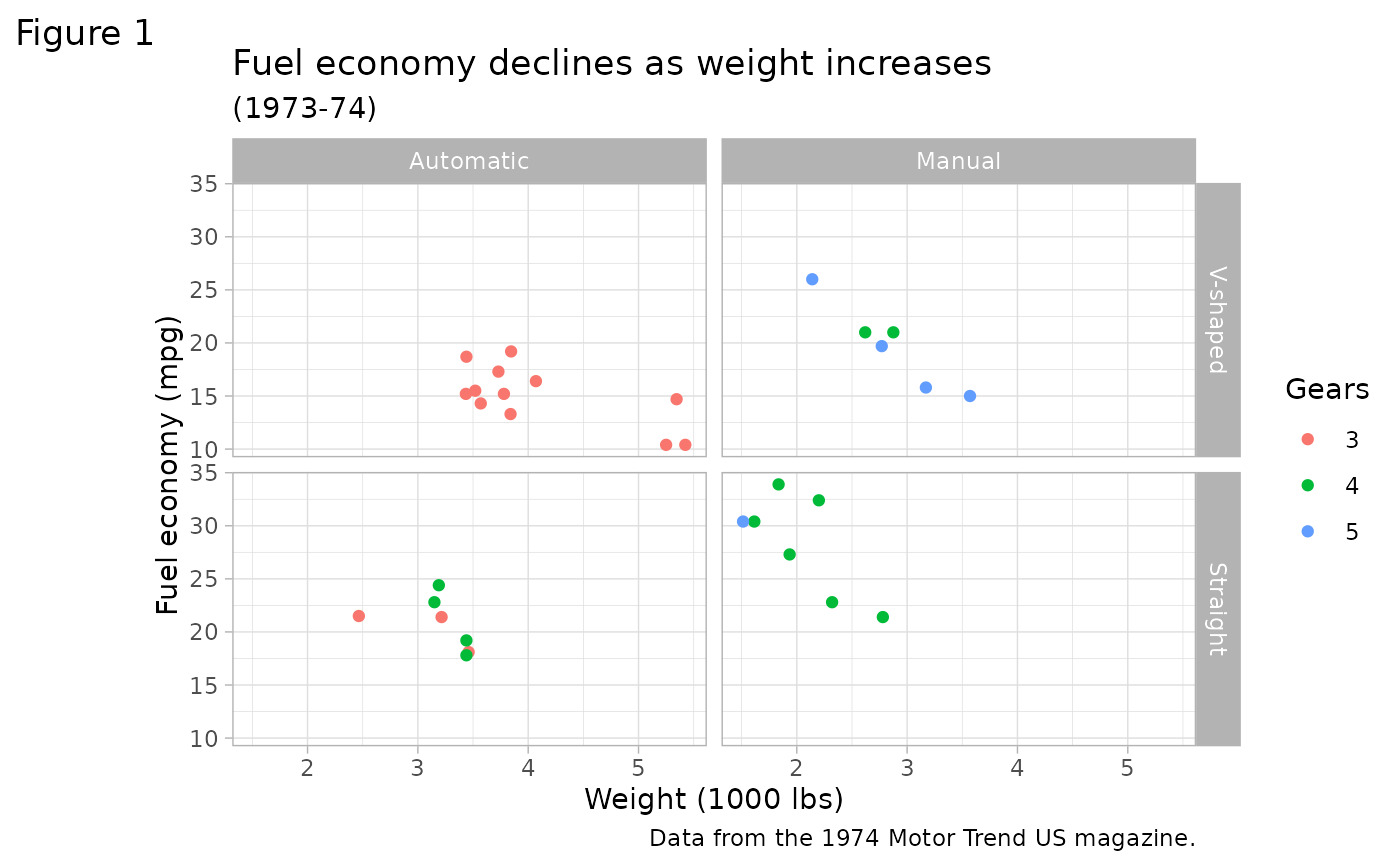
 p2 + theme_light()
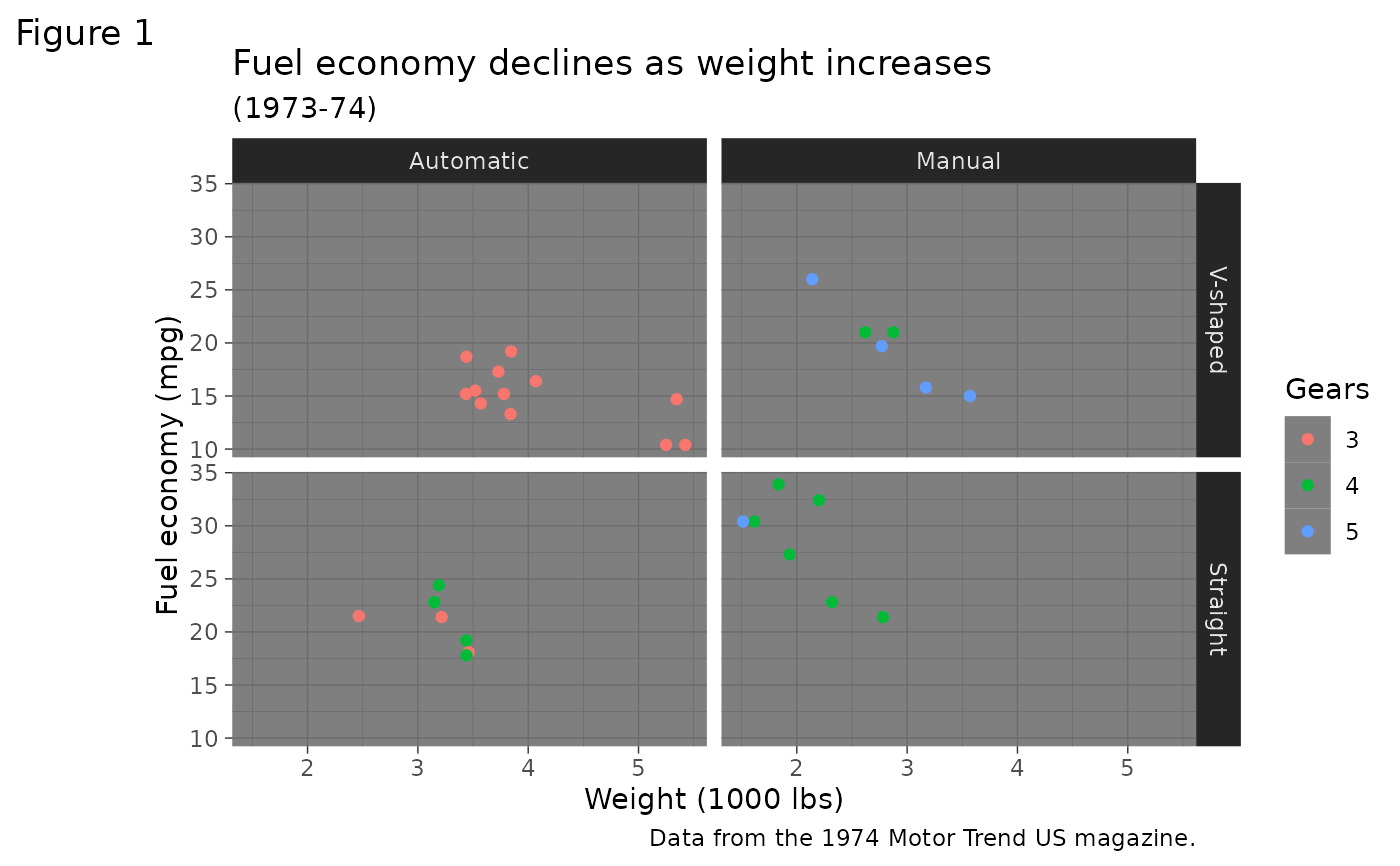
 p2 + theme_dark()
 p2 + theme_minimal()
 p2 + theme_classic()
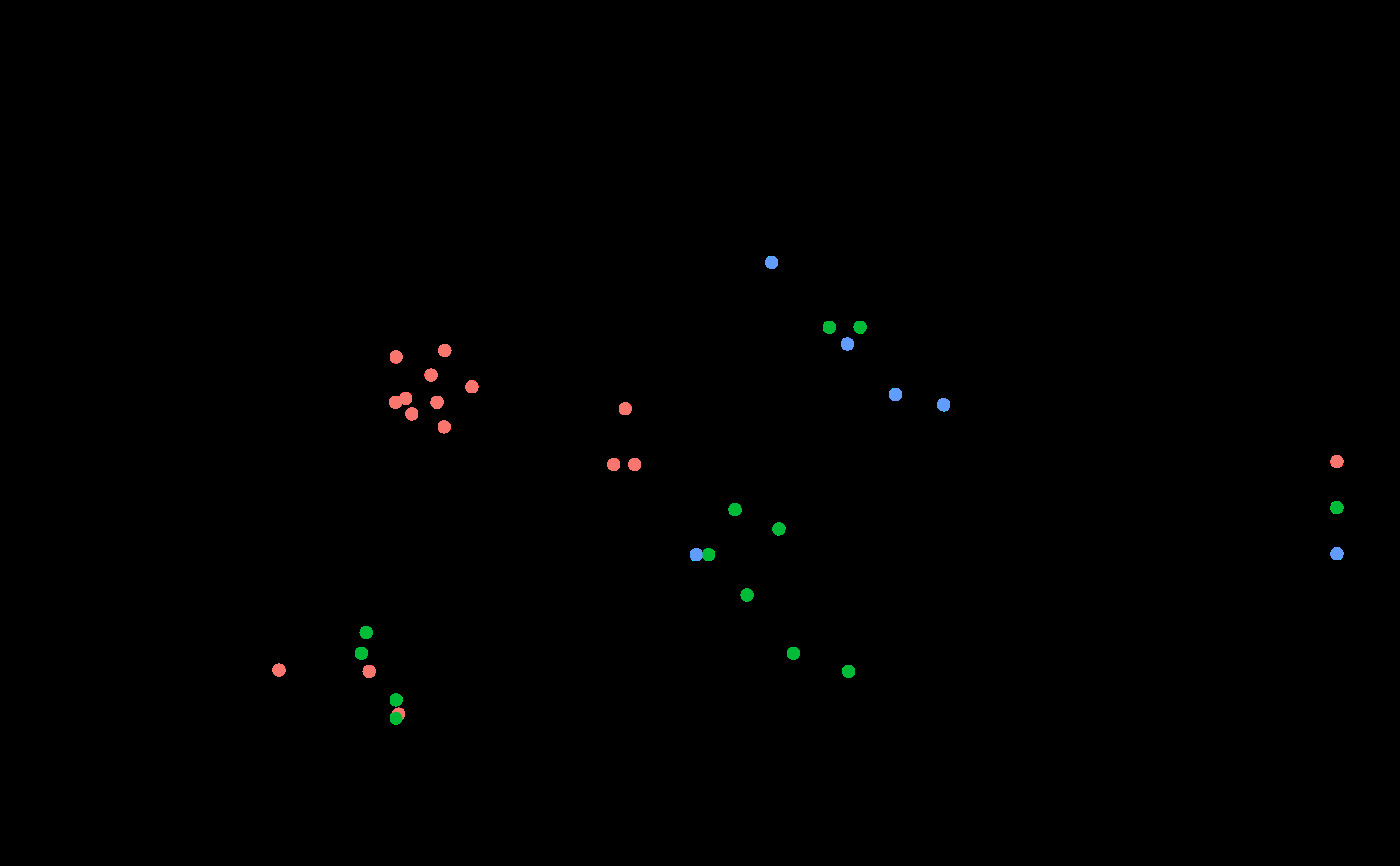
 p2 + theme_void()
 # }
# }
相關用法
- R ggplot2 ggplot 創建一個新的ggplot
- R ggplot2 ggsf 可視化 sf 對象
- R ggplot2 ggsave 使用合理的默認值保存 ggplot (或其他網格對象)
- R ggplot2 gg-add 將組件添加到圖中
- R ggplot2 ggproto 創建一個新的 ggproto 對象
- R ggplot2 geom_qq 分位數-分位數圖
- R ggplot2 geom_spoke 由位置、方向和距離參數化的線段
- R ggplot2 geom_quantile 分位數回歸
- R ggplot2 geom_text 文本
- R ggplot2 get_alt_text 從繪圖中提取替代文本
- R ggplot2 geom_ribbon 函數區和麵積圖
- R ggplot2 geom_boxplot 盒須圖(Tukey 風格)
- R ggplot2 geom_hex 二維箱計數的六邊形熱圖
- R ggplot2 geom_bar 條形圖
- R ggplot2 guide_legend 圖例指南
- R ggplot2 geom_bin_2d 二維 bin 計數熱圖
- R ggplot2 geom_jitter 抖動點
- R ggplot2 geom_point 積分
- R ggplot2 geom_linerange 垂直間隔:線、橫線和誤差線
- R ggplot2 geom_blank 什麽也不畫
- R ggplot2 guides 為每個尺度設置指南
- R ggplot2 geom_path 連接觀察結果
- R ggplot2 geom_violin 小提琴情節
- R ggplot2 guide_bins Guide_legend 的分箱版本
- R ggplot2 geom_dotplot 點圖
注:本文由純淨天空篩選整理自Hadley Wickham等大神的英文原創作品 Complete themes。非經特殊聲明,原始代碼版權歸原作者所有,本譯文未經允許或授權,請勿轉載或複製。