圖例類型指南顯示映射到值的鍵(即幾何圖形)。如果可能的話,集成各種比例的圖例指南。
用法
guide_legend(
  title = waiver(),
  title.position = NULL,
  title.theme = NULL,
  title.hjust = NULL,
  title.vjust = NULL,
  label = TRUE,
  label.position = NULL,
  label.theme = NULL,
  label.hjust = NULL,
  label.vjust = NULL,
  keywidth = NULL,
  keyheight = NULL,
  direction = NULL,
  default.unit = "line",
  override.aes = list(),
  nrow = NULL,
  ncol = NULL,
  byrow = FALSE,
  reverse = FALSE,
  order = 0,
  ...
)
參數
- title
-
指示指南標題的字符串或表達式。如果是
NULL,則不顯示標題。默認情況下 (waiver()),比例對象的名稱或labs()中指定的名稱用作標題。 - title.position
-
表示標題位置的字符串。 "top"(垂直參考線默認)、"bottom"、"left"(水平參考線默認)或 "right." 之一
- title.theme
-
用於渲染標題文本的主題對象。通常需要
element_text()對象。默認情況下,主題由theme()或主題中的legend.title指定。 - title.hjust
-
指定標題文本的水平對齊方式的數字。
- title.vjust
-
指定標題文本垂直對齊的數字。
- label
-
合乎邏輯的。如果
TRUE則繪製標簽。如果FALSE則標簽不可見。 - label.position
-
指示標簽位置的字符串。 "top"、"bottom"(水平參考線默認)、"left" 或 "right"(垂直參考線默認)之一。
- label.theme
-
用於渲染標簽文本的主題對象。通常需要
element_text()對象。默認情況下,主題由theme()中的legend.text指定。 - label.hjust
-
指定標簽文本水平對齊的數字。對於表達式,標準文本的默認值是 0(左對齊)和 1(右對齊)。
- label.vjust
-
指定標簽文本垂直對齊的數字。
- keywidth
-
指定圖例鍵寬度的數字或
grid::unit()對象。默認值為theme()中的legend.key.width或legend.key.size。 - keyheight
-
指定圖例鍵高度的數字或
grid::unit()對象。默認值為theme()中的legend.key.height或legend.key.size。 - direction
-
指示引導方向的字符串。 "horizontal" 或 "vertical." 之一
- default.unit
-
對於
keywidth和keyheight表示grid::unit()的字符串。 - override.aes
-
指定圖例鍵的美觀參數的列表。請參閱詳細信息和示例。
- nrow
-
所需的圖例行數。
- ncol
-
所需的圖例列數。
- byrow
-
合乎邏輯的。如果
FALSE(默認),則legend-matrix按列填充,否則legend-matrix按行填充。 - reverse
-
合乎邏輯的。如果
TRUE,則圖例的順序相反。 - order
-
小於 99 的正整數,指定該指南在多個指南中的順序。這控製多個指南的顯示順序,而不是指南本身的內容。如果為 0(默認),則順序由秘密算法確定。
- ...
-
被忽略。
細節
可以在每個 scale_* 或 guides() 中指定指南。 scale_* 中的 guide = "legend" 是 guide = guide_legend() 的語法糖(例如 scale_color_manual(guide = "legend") )。至於如何更詳細地指定每個尺度的指南,請參見guides()。
也可以看看
其他指南:guide_bins()、guide_colourbar()、guide_coloursteps()、guides()
例子
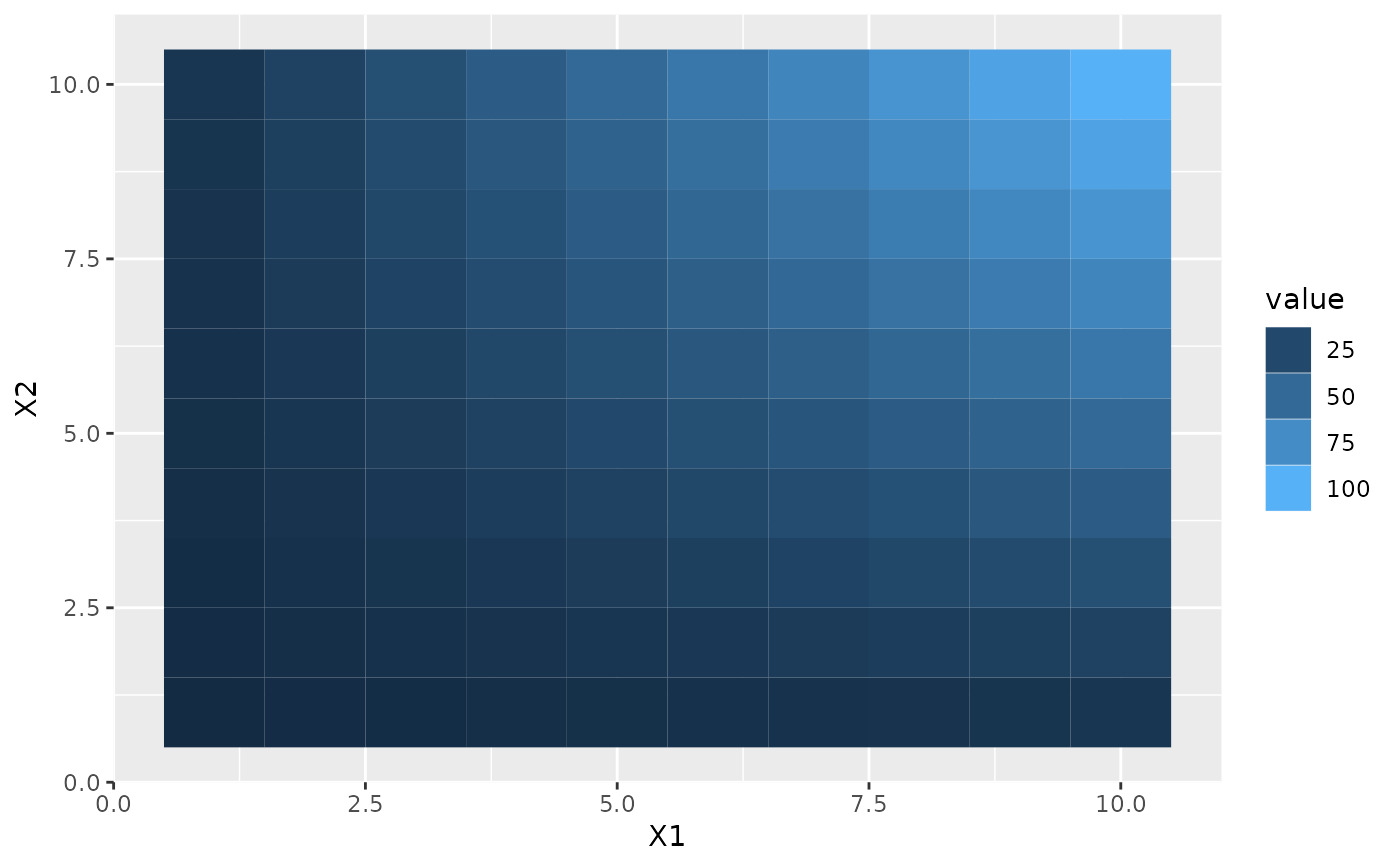
# \donttest{
df <- expand.grid(X1 = 1:10, X2 = 1:10)
df$value <- df$X1 * df$X2
p1 <- ggplot(df, aes(X1, X2)) + geom_tile(aes(fill = value))
p2 <- p1 + geom_point(aes(size = value))
# Basic form
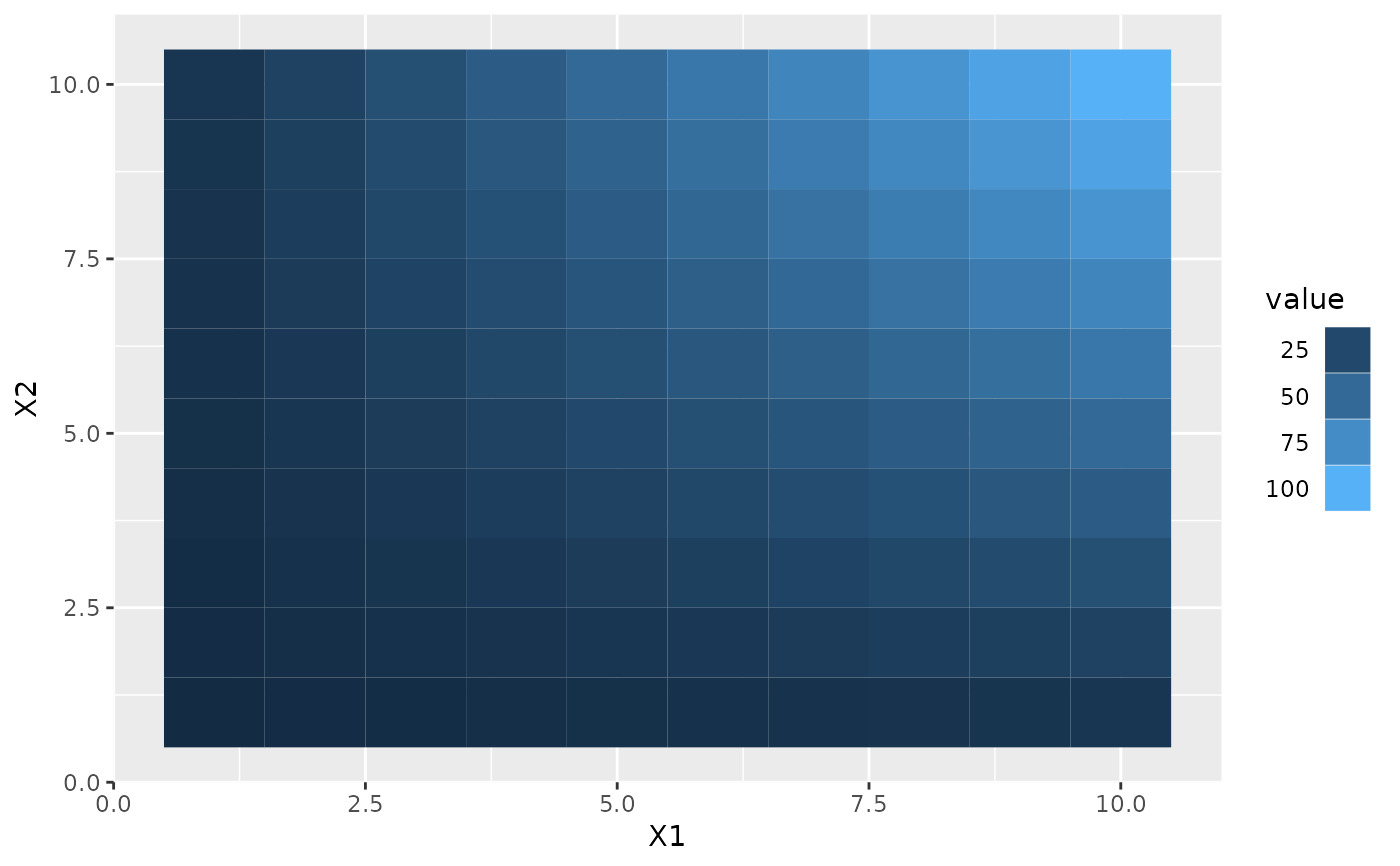
p1 + scale_fill_continuous(guide = guide_legend())
 # Control styles
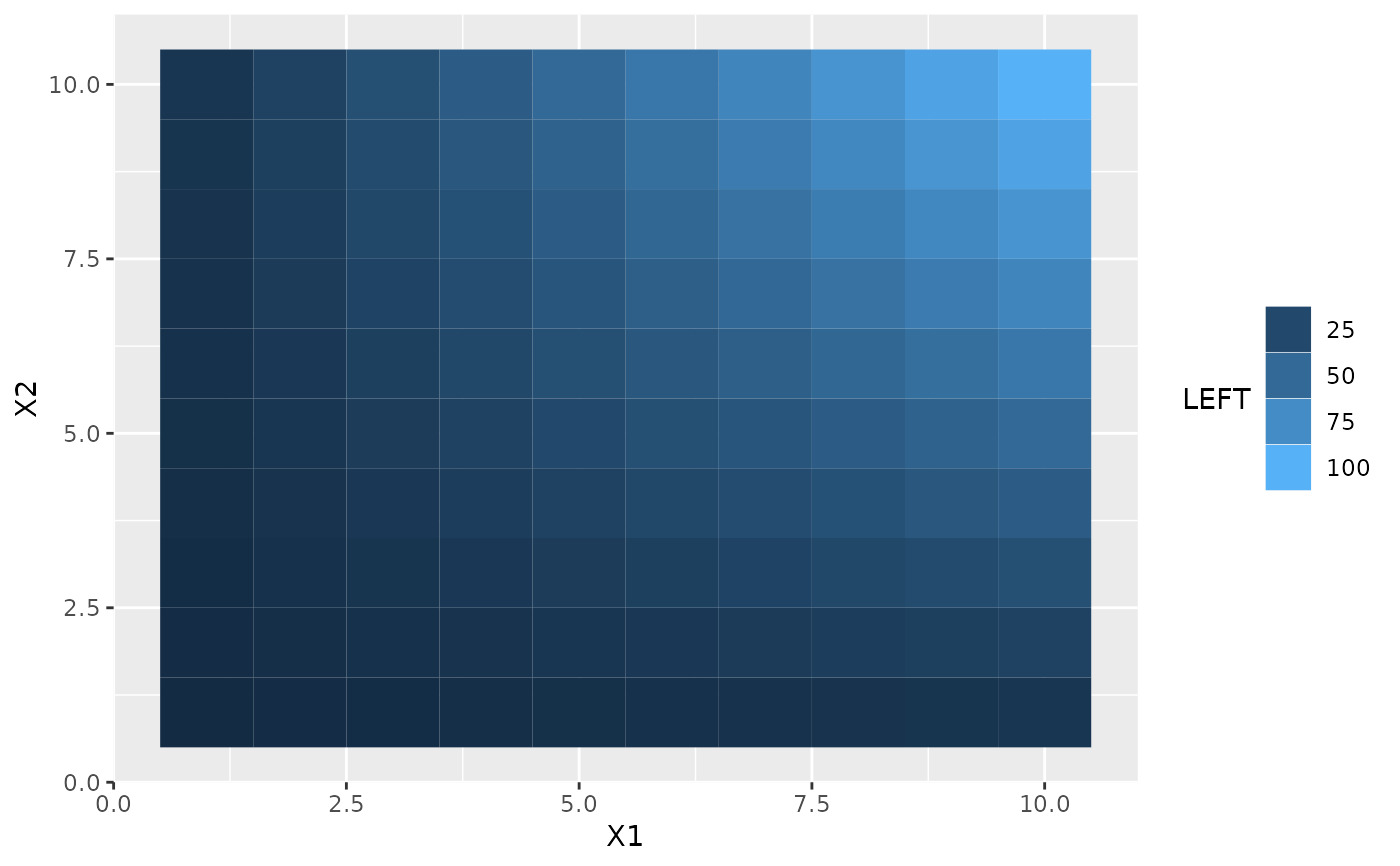
# title position
p1 + guides(fill = guide_legend(title = "LEFT", title.position = "left"))
# Control styles
# title position
p1 + guides(fill = guide_legend(title = "LEFT", title.position = "left"))
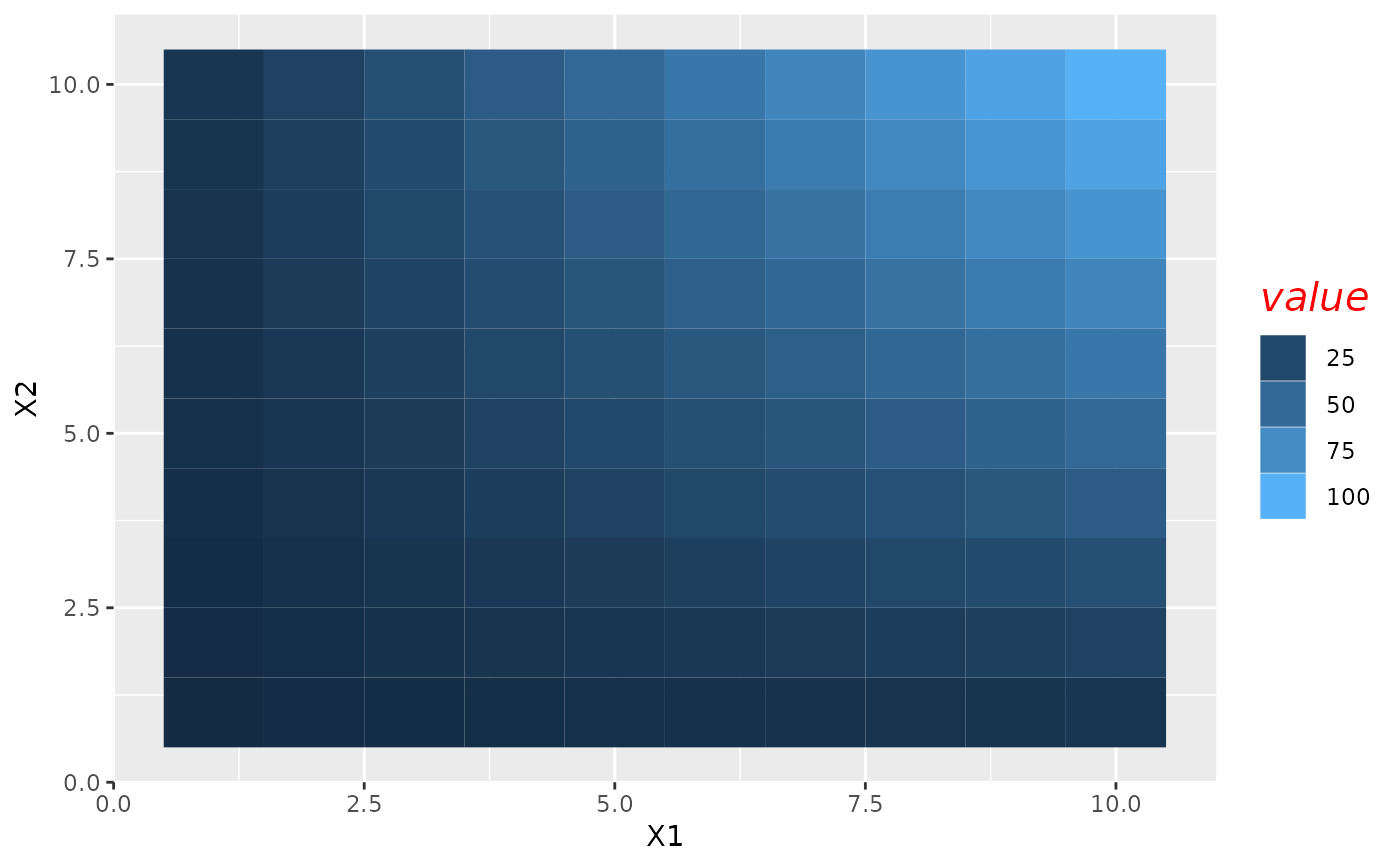
 # title text styles via element_text
p1 + guides(fill =
guide_legend(
title.theme = element_text(
size = 15,
face = "italic",
colour = "red",
angle = 0
)
)
)
# title text styles via element_text
p1 + guides(fill =
guide_legend(
title.theme = element_text(
size = 15,
face = "italic",
colour = "red",
angle = 0
)
)
)
 # label position
p1 + guides(fill = guide_legend(label.position = "left", label.hjust = 1))
# label position
p1 + guides(fill = guide_legend(label.position = "left", label.hjust = 1))
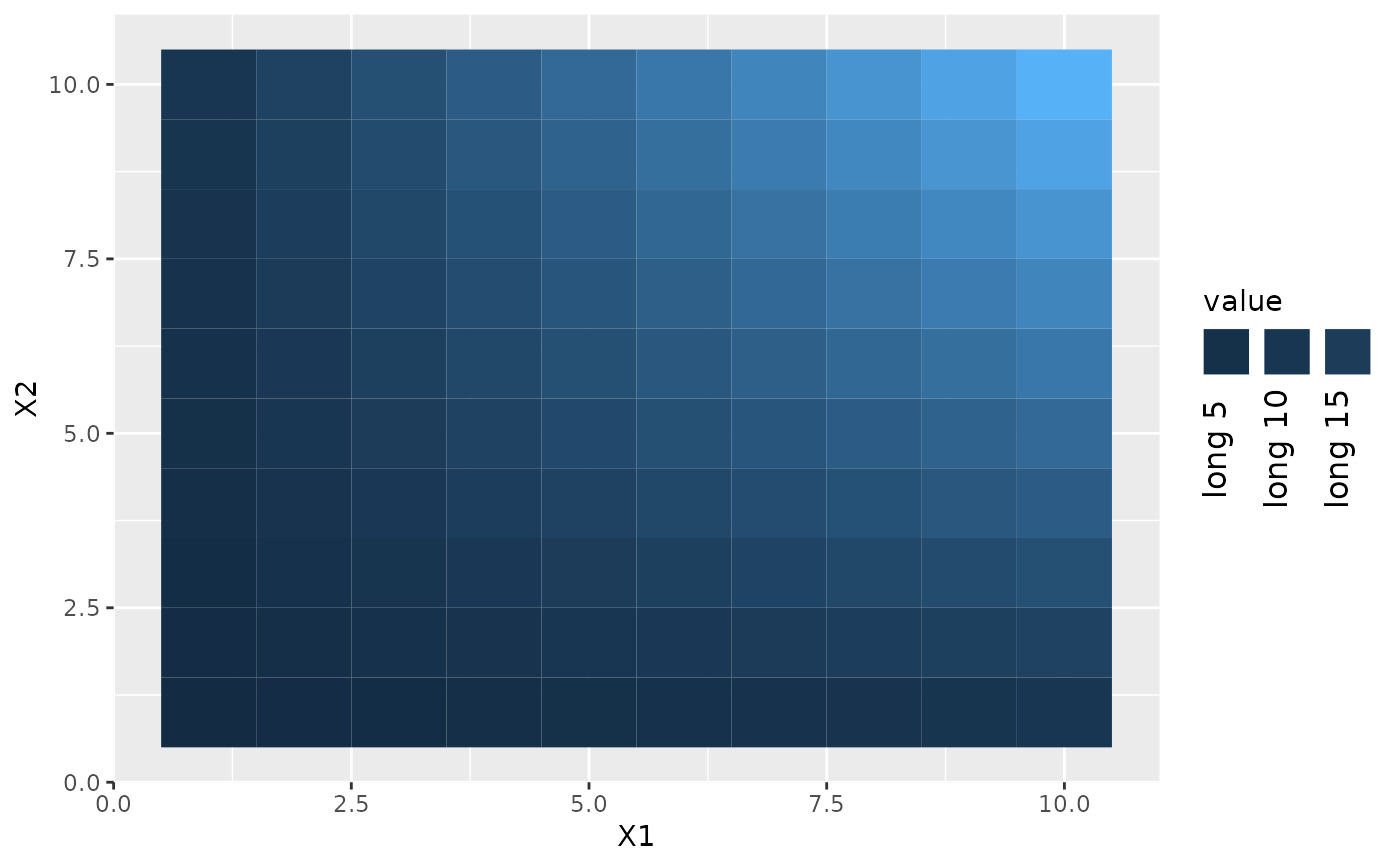
 # label styles
p1 +
scale_fill_continuous(
breaks = c(5, 10, 15),
labels = paste("long", c(5, 10, 15)),
guide = guide_legend(
direction = "horizontal",
title.position = "top",
label.position = "bottom",
label.hjust = 0.5,
label.vjust = 1,
label.theme = element_text(angle = 90)
)
)
# label styles
p1 +
scale_fill_continuous(
breaks = c(5, 10, 15),
labels = paste("long", c(5, 10, 15)),
guide = guide_legend(
direction = "horizontal",
title.position = "top",
label.position = "bottom",
label.hjust = 0.5,
label.vjust = 1,
label.theme = element_text(angle = 90)
)
)
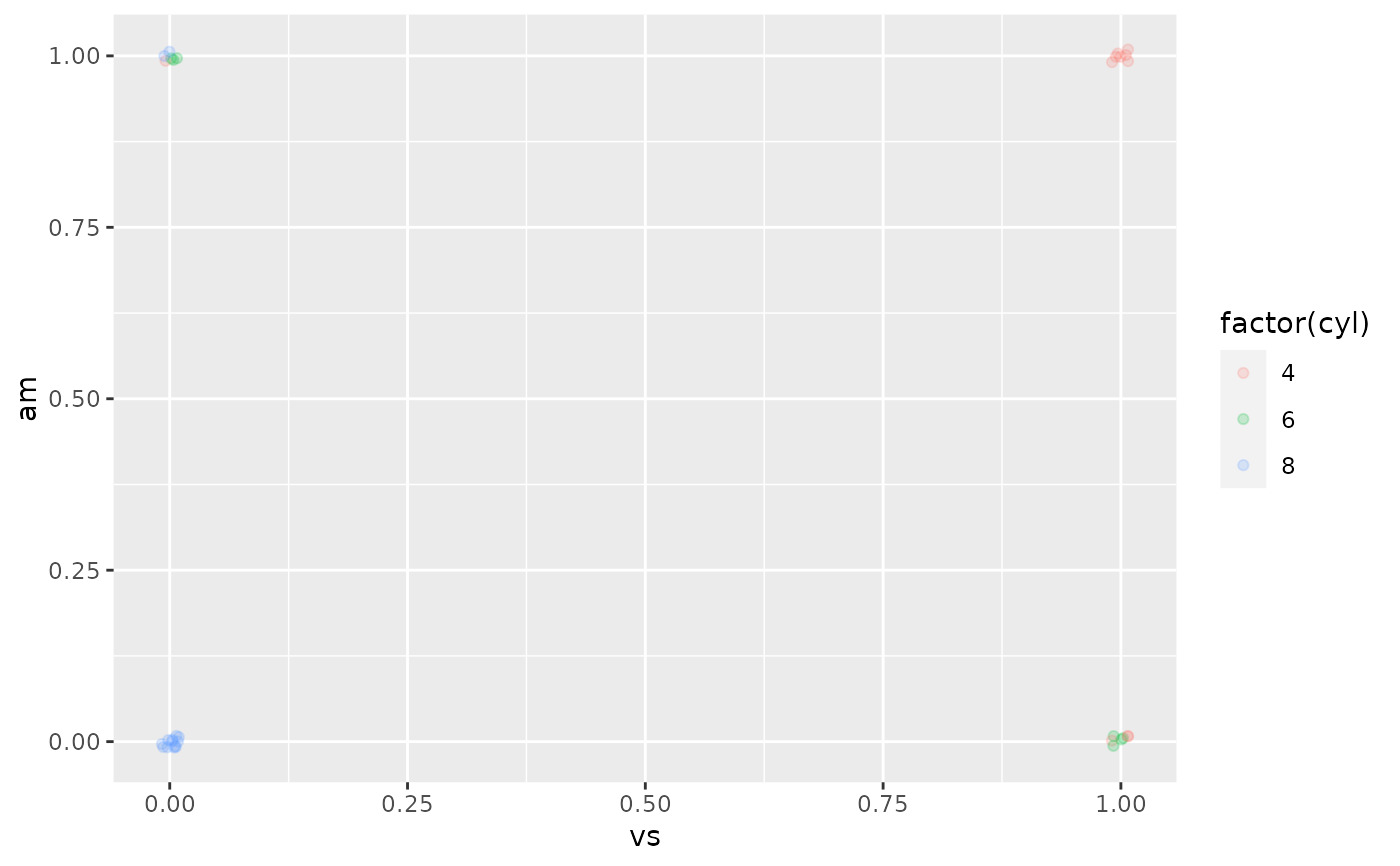
 # Set aesthetic of legend key
# very low alpha value make it difficult to see legend key
p3 <- ggplot(mtcars, aes(vs, am, colour = factor(cyl))) +
geom_jitter(alpha = 1/5, width = 0.01, height = 0.01)
p3
# Set aesthetic of legend key
# very low alpha value make it difficult to see legend key
p3 <- ggplot(mtcars, aes(vs, am, colour = factor(cyl))) +
geom_jitter(alpha = 1/5, width = 0.01, height = 0.01)
p3
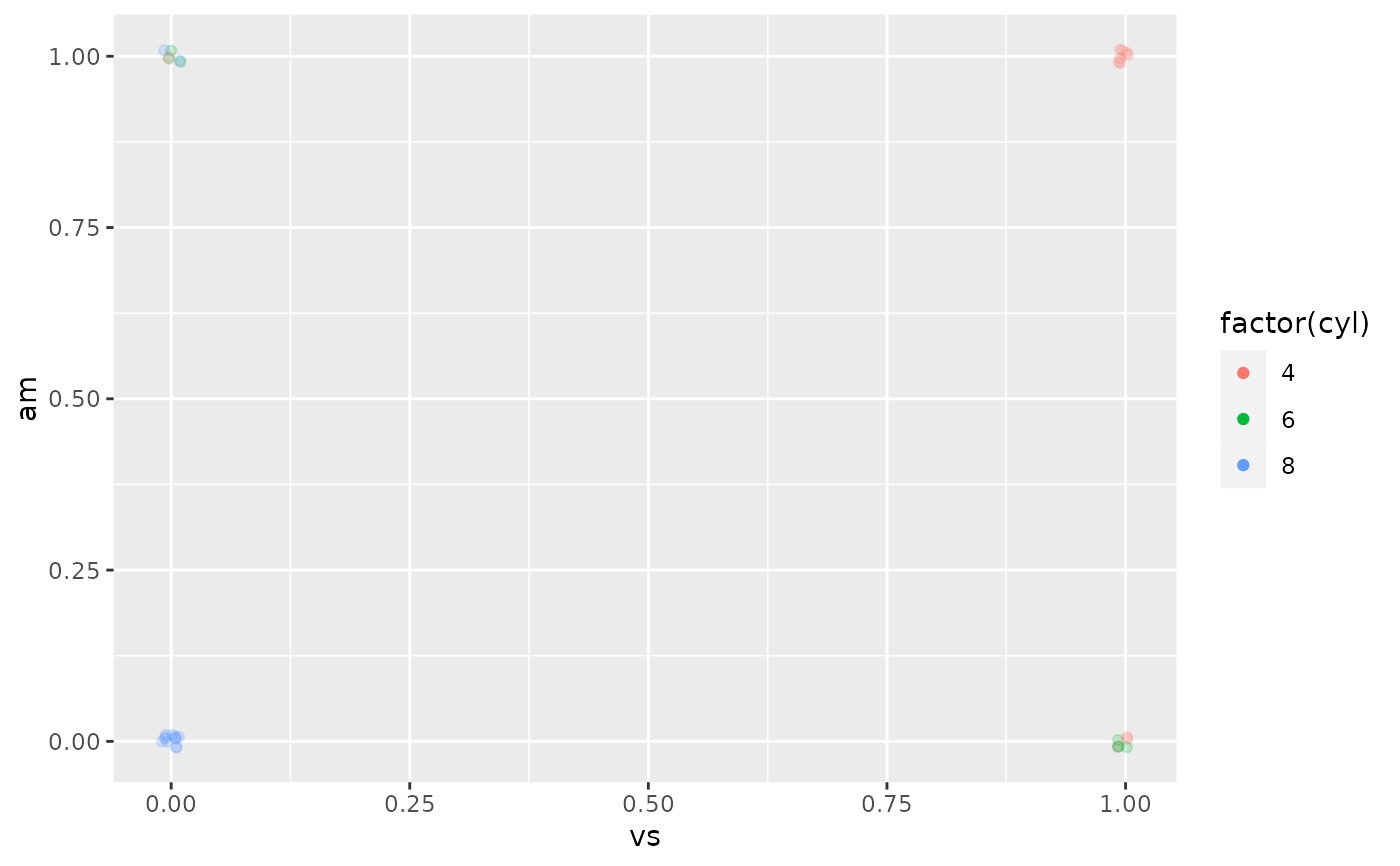
 # override.aes overwrites the alpha
p3 + guides(colour = guide_legend(override.aes = list(alpha = 1)))
# override.aes overwrites the alpha
p3 + guides(colour = guide_legend(override.aes = list(alpha = 1)))
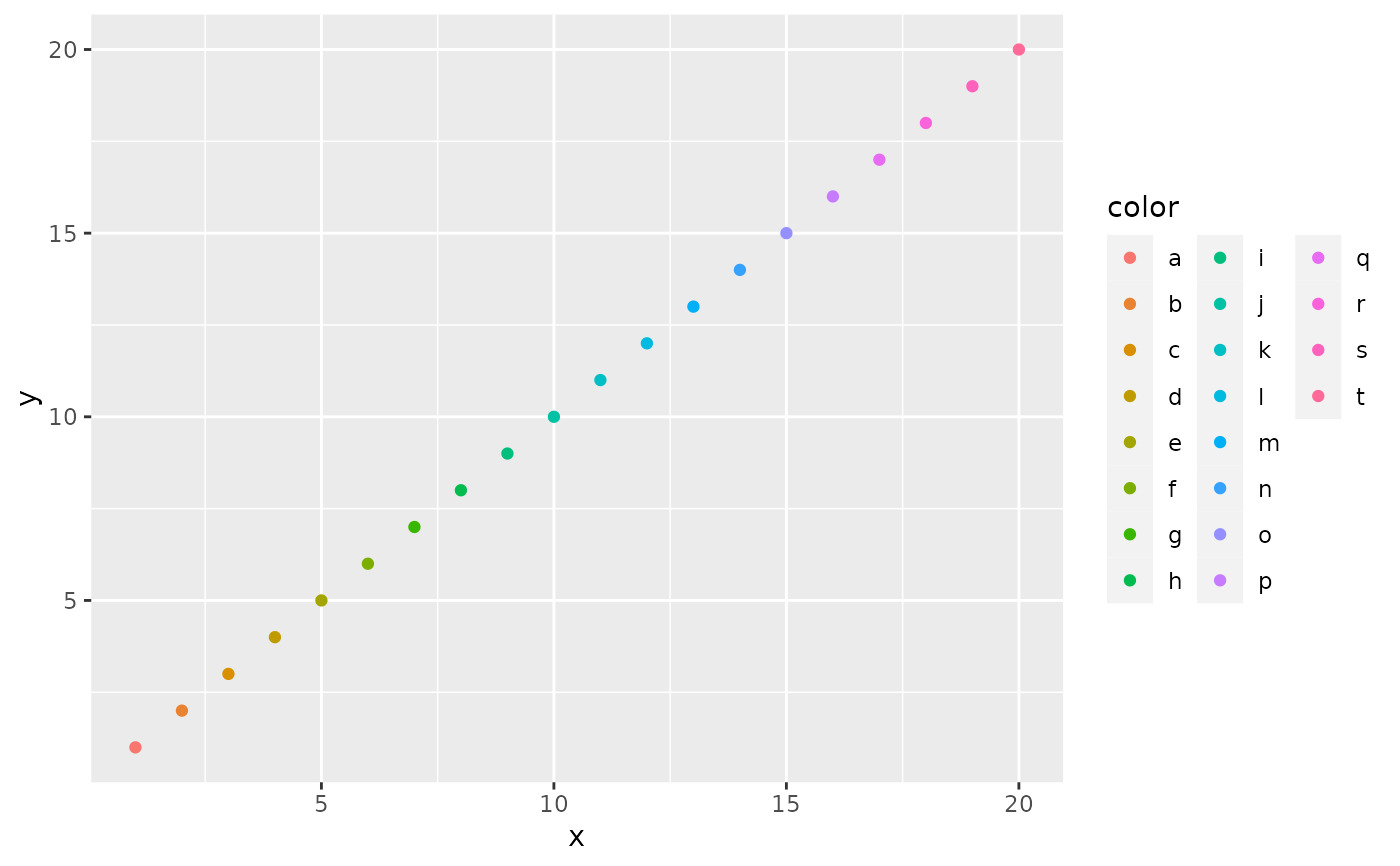
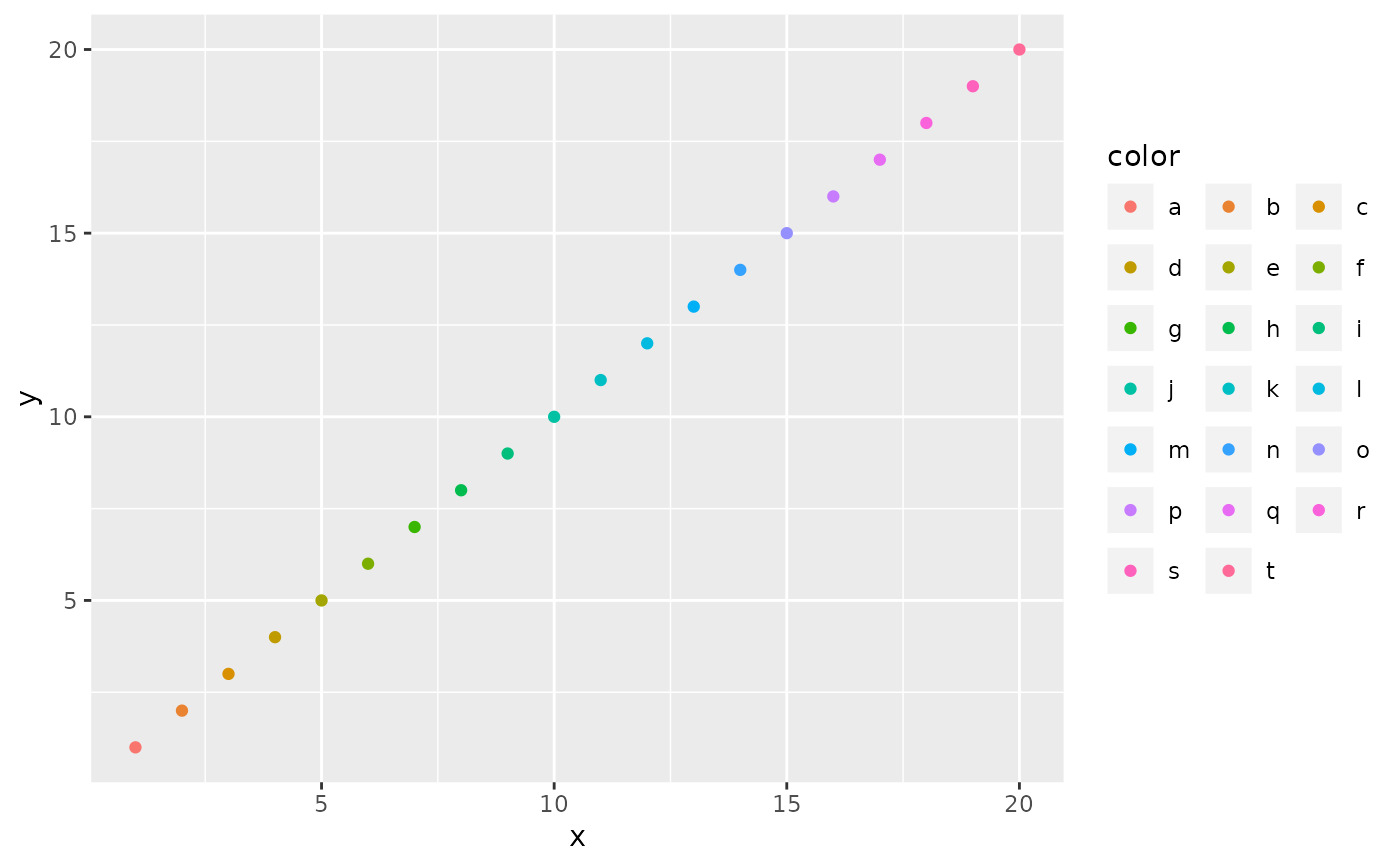
 # multiple row/col legends
df <- data.frame(x = 1:20, y = 1:20, color = letters[1:20])
p <- ggplot(df, aes(x, y)) +
geom_point(aes(colour = color))
p + guides(col = guide_legend(nrow = 8))
# multiple row/col legends
df <- data.frame(x = 1:20, y = 1:20, color = letters[1:20])
p <- ggplot(df, aes(x, y)) +
geom_point(aes(colour = color))
p + guides(col = guide_legend(nrow = 8))
 p + guides(col = guide_legend(ncol = 8))
 p + guides(col = guide_legend(nrow = 8, byrow = TRUE))
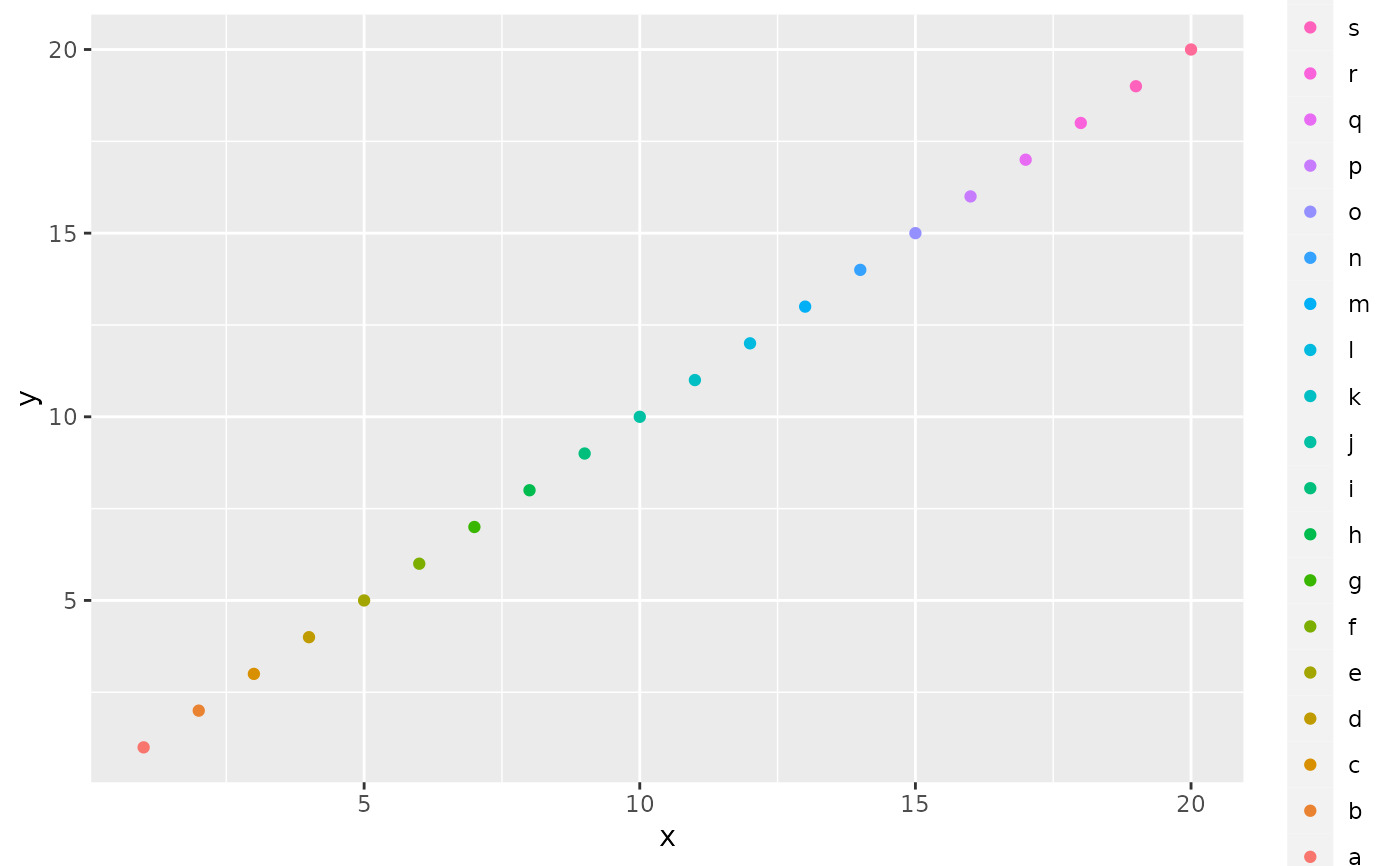
 # reversed order legend
p + guides(col = guide_legend(reverse = TRUE))
# reversed order legend
p + guides(col = guide_legend(reverse = TRUE))
 # }
# }
相關用法
- R ggplot2 guide_bins Guide_legend 的分箱版本
- R ggplot2 guide_axis 軸導軌
- R ggplot2 guide_coloursteps 離散顏色條指南
- R ggplot2 guide_colourbar 連續色條指南
- R ggplot2 guides 為每個尺度設置指南
- R ggplot2 geom_qq 分位數-分位數圖
- R ggplot2 geom_spoke 由位置、方向和距離參數化的線段
- R ggplot2 geom_quantile 分位數回歸
- R ggplot2 geom_text 文本
- R ggplot2 get_alt_text 從繪圖中提取替代文本
- R ggplot2 geom_ribbon 函數區和麵積圖
- R ggplot2 geom_boxplot 盒須圖(Tukey 風格)
- R ggplot2 geom_hex 二維箱計數的六邊形熱圖
- R ggplot2 geom_bar 條形圖
- R ggplot2 geom_bin_2d 二維 bin 計數熱圖
- R ggplot2 ggplot 創建一個新的ggplot
- R ggplot2 geom_jitter 抖動點
- R ggplot2 geom_point 積分
- R ggplot2 geom_linerange 垂直間隔:線、橫線和誤差線
- R ggplot2 ggsf 可視化 sf 對象
- R ggplot2 geom_blank 什麽也不畫
- R ggplot2 ggsave 使用合理的默認值保存 ggplot (或其他網格對象)
- R ggplot2 ggtheme 完整的主題
- R ggplot2 geom_path 連接觀察結果
- R ggplot2 geom_violin 小提琴情節
注:本文由純淨天空篩選整理自Hadley Wickham等大神的英文原創作品 Legend guide。非經特殊聲明,原始代碼版權歸原作者所有,本譯文未經允許或授權,請勿轉載或複製。