ggplot() 初始化 ggplot 对象。它可用于声明图形的输入数据帧,并指定一组在所有后续层中通用的绘图美学,除非特别覆盖。
参数
- data
-
用于绘图的默认数据集。如果还不是 data.frame,将由
fortify()转换为 data.frame。如果未指定,则必须在添加到绘图的每个图层中提供。 - mapping
-
用于绘图的默认美学映射列表。如果未指定,则必须在添加到绘图的每个图层中提供。
- ...
-
其他参数传递给方法。目前未使用。
- environment
-
在整洁评估之前使用。
细节
ggplot() 用于构造初始绘图对象,并且后面几乎总是跟有一个加号 ( + ) 以将组件添加到绘图中。
用于调用 ggplot() 的三种常见模式:
-
ggplot(data = df, mapping = aes(x, y, other aesthetics)) -
ggplot(data = df) -
ggplot()
如果所有图层都使用相同的数据和相同的美学集,则建议使用第一种模式,尽管在使用来自另一个数据帧的数据添加图层时也可以使用此方法。
第二个模式指定用于绘图的默认 DataFrame ,但没有预先定义美观。当一个 DataFrame 主要用于绘图但美观程度因图层而异时,这非常有用。
第三种模式初始化一个骨架 ggplot 对象,该对象随着层的添加而充实。当使用多个数据帧生成不同的图层时(复杂图形中经常出现这种情况),这非常有用。
参数中的 data = 和 mapping = 规范是可选的(在实践中经常被省略),只要数据和映射值以正确的顺序传递到函数中即可。然而,在下面的示例中,为了清楚起见,它们保留在原处。
例子
# Create a data frame with some sample data, then create a data frame
# containing the mean value for each group in the sample data.
set.seed(1)
sample_df <- data.frame(
group = factor(rep(letters[1:3], each = 10)),
value = rnorm(30)
)
group_means_df <- setNames(
aggregate(value ~ group, sample_df, mean),
c("group", "group_mean")
)
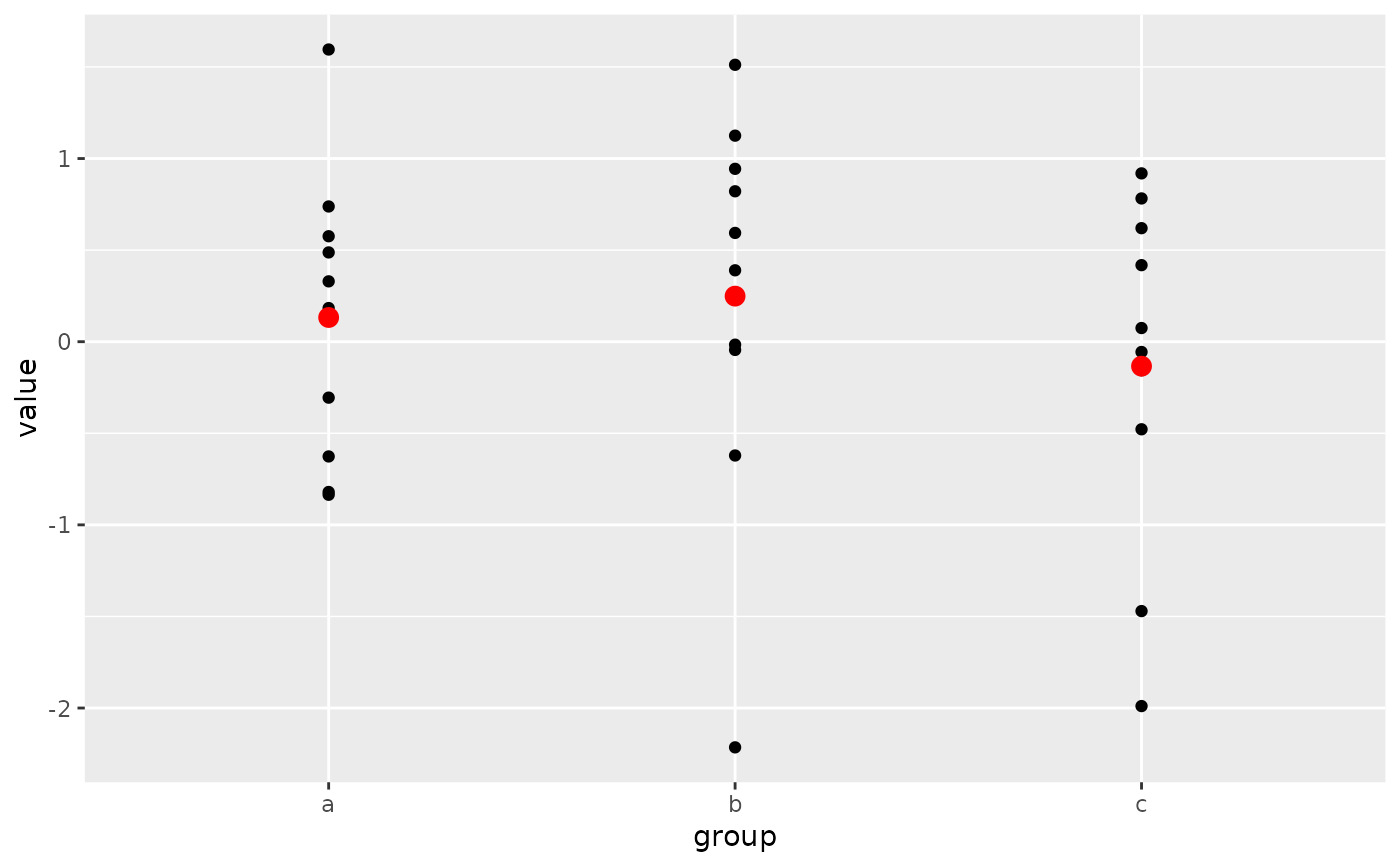
# The following three code blocks create the same graphic, each using one
# of the three patterns specified above. In each graphic, the sample data
# are plotted in the first layer and the group means data frame is used to
# plot larger red points on top of the sample data in the second layer.
# Pattern 1
# Both the `data` and `mapping` arguments are passed into the `ggplot()`
# call. Those arguments are omitted in the first `geom_point()` layer
# because they get passed along from the `ggplot()` call. Note that the
# second `geom_point()` layer re-uses the `x = group` aesthetic through
# that mechanism but overrides the y-position aesthetic.
ggplot(data = sample_df, mapping = aes(x = group, y = value)) +
geom_point() +
geom_point(
mapping = aes(y = group_mean), data = group_means_df,
colour = 'red', size = 3
)
 # Pattern 2
# Same plot as above, passing only the `data` argument into the `ggplot()`
# call. The `mapping` arguments are now required in each `geom_point()`
# layer because there is no `mapping` argument passed along from the
# `ggplot()` call.
ggplot(data = sample_df) +
geom_point(mapping = aes(x = group, y = value)) +
geom_point(
mapping = aes(x = group, y = group_mean), data = group_means_df,
colour = 'red', size = 3
)
# Pattern 2
# Same plot as above, passing only the `data` argument into the `ggplot()`
# call. The `mapping` arguments are now required in each `geom_point()`
# layer because there is no `mapping` argument passed along from the
# `ggplot()` call.
ggplot(data = sample_df) +
geom_point(mapping = aes(x = group, y = value)) +
geom_point(
mapping = aes(x = group, y = group_mean), data = group_means_df,
colour = 'red', size = 3
)
 # Pattern 3
# Same plot as above, passing neither the `data` or `mapping` arguments
# into the `ggplot()` call. Both those arguments are now required in
# each `geom_point()` layer. This pattern can be particularly useful when
# creating more complex graphics with many layers using data from multiple
# data frames.
ggplot() +
geom_point(mapping = aes(x = group, y = value), data = sample_df) +
geom_point(
mapping = aes(x = group, y = group_mean), data = group_means_df,
colour = 'red', size = 3
)
# Pattern 3
# Same plot as above, passing neither the `data` or `mapping` arguments
# into the `ggplot()` call. Both those arguments are now required in
# each `geom_point()` layer. This pattern can be particularly useful when
# creating more complex graphics with many layers using data from multiple
# data frames.
ggplot() +
geom_point(mapping = aes(x = group, y = value), data = sample_df) +
geom_point(
mapping = aes(x = group, y = group_mean), data = group_means_df,
colour = 'red', size = 3
)
相关用法
- R ggplot2 ggproto 创建一个新的 ggproto 对象
- R ggplot2 ggsf 可视化 sf 对象
- R ggplot2 ggsave 使用合理的默认值保存 ggplot (或其他网格对象)
- R ggplot2 ggtheme 完整的主题
- R ggplot2 gg-add 将组件添加到图中
- R ggplot2 geom_qq 分位数-分位数图
- R ggplot2 geom_spoke 由位置、方向和距离参数化的线段
- R ggplot2 geom_quantile 分位数回归
- R ggplot2 geom_text 文本
- R ggplot2 get_alt_text 从绘图中提取替代文本
- R ggplot2 geom_ribbon 函数区和面积图
- R ggplot2 geom_boxplot 盒须图(Tukey 风格)
- R ggplot2 geom_hex 二维箱计数的六边形热图
- R ggplot2 geom_bar 条形图
- R ggplot2 guide_legend 图例指南
- R ggplot2 geom_bin_2d 二维 bin 计数热图
- R ggplot2 geom_jitter 抖动点
- R ggplot2 geom_point 积分
- R ggplot2 geom_linerange 垂直间隔:线、横线和误差线
- R ggplot2 geom_blank 什么也不画
- R ggplot2 guides 为每个尺度设置指南
- R ggplot2 geom_path 连接观察结果
- R ggplot2 geom_violin 小提琴情节
- R ggplot2 guide_bins Guide_legend 的分箱版本
- R ggplot2 geom_dotplot 点图
注:本文由纯净天空筛选整理自Hadley Wickham等大神的英文原创作品 Create a new ggplot。非经特殊声明,原始代码版权归原作者所有,本译文未经允许或授权,请勿转载或复制。