当前/活动主题(请参阅 theme() )会自动应用于您绘制的每个绘图。使用 theme_get() 获取当前主题,并使用 theme_set() 完全覆盖它。 theme_update() 和 theme_replace() 是更改各个元素的简写。
添加到主题
+ 和 %+replace% 可用于修改主题中的元素。
+ 更新 e1 中与 e2 中指定的元素(非 NULL)不同的元素。因此,该运算符可用于增量添加或修改 ggplot 主题的属性。
相反,%+replace% 替换整个元素; e2 中未指定的主题的任何元素都不会出现在生成的主题中(即 NULL)。因此,该运算符可用于覆盖整个主题。
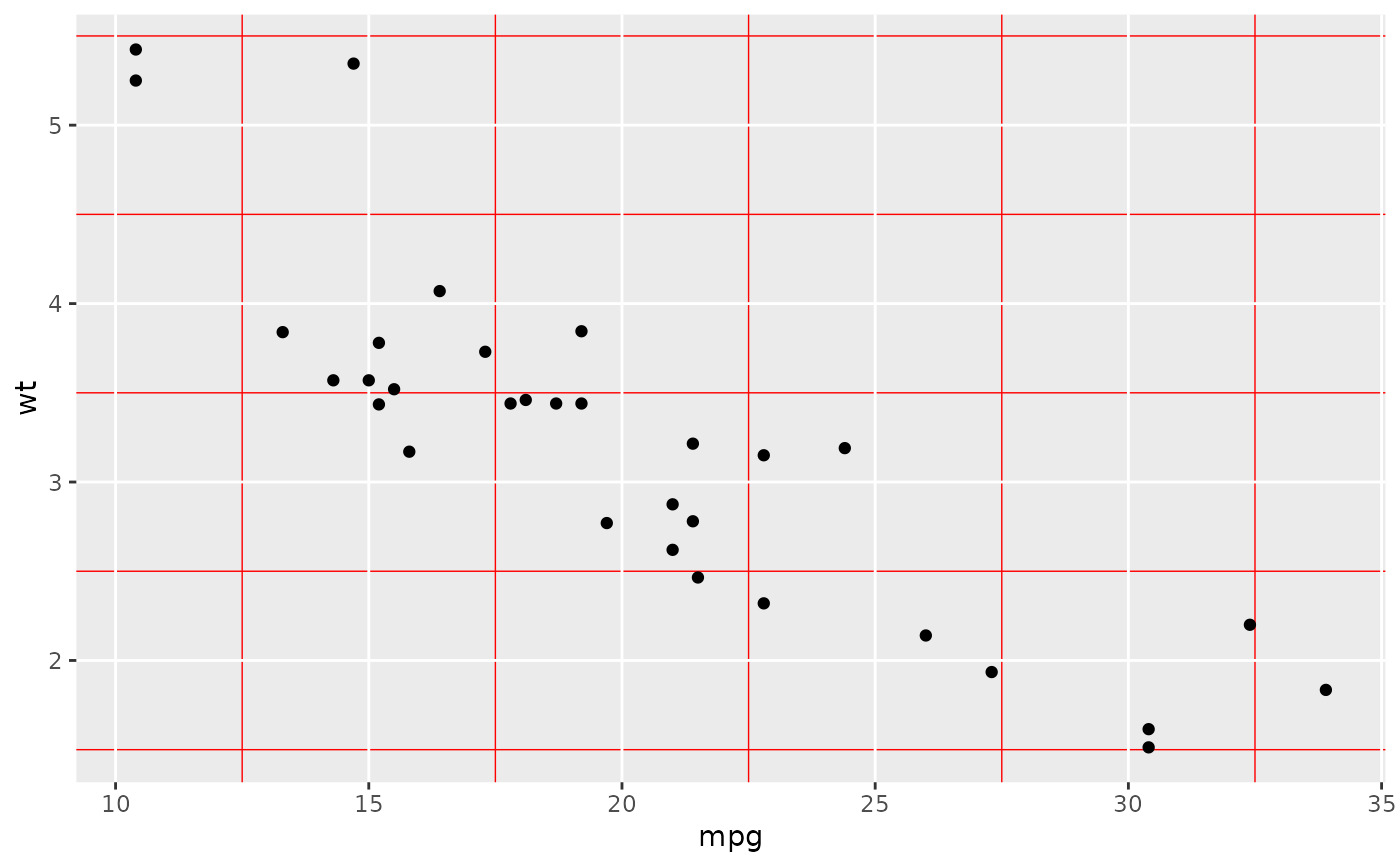
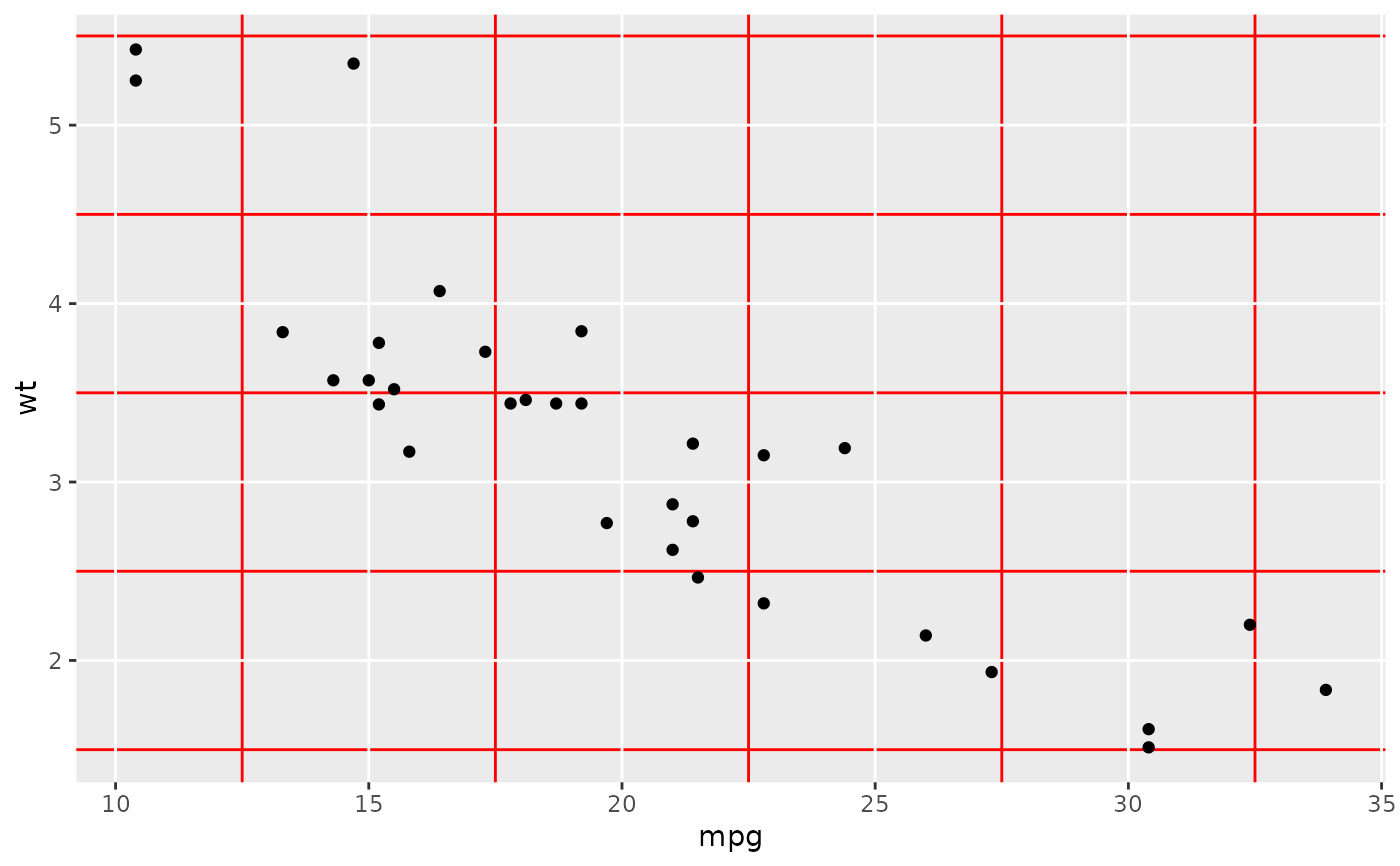
theme_update() 使用 + 运算符,以便主题元素中任何未指定的值将默认为它们在主题中设置的值。 theme_replace() 使用 %+replace% 完全替换该元素,因此任何未指定的值都会用 NULL 覆盖主题中的当前值。
综上所述, theme_set() 、 theme_update() 和 theme_replace() 之间的主要区别是:
-
theme_set()完全覆盖当前主题。 -
theme_update()使用+运算符修改当前主题的特定元素。 -
theme_replace()使用%+replace%运算符修改当前主题的特定元素。
例子
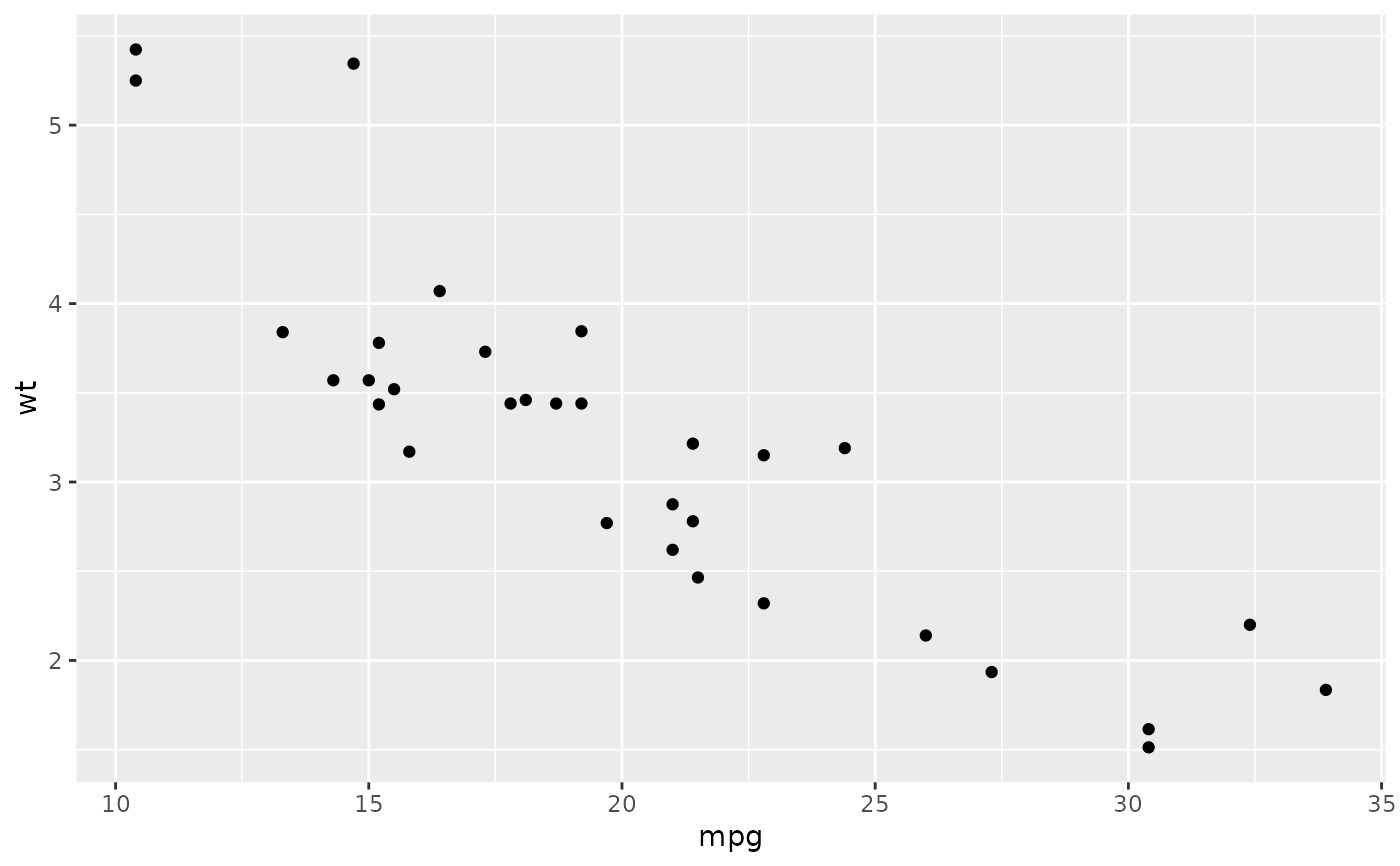
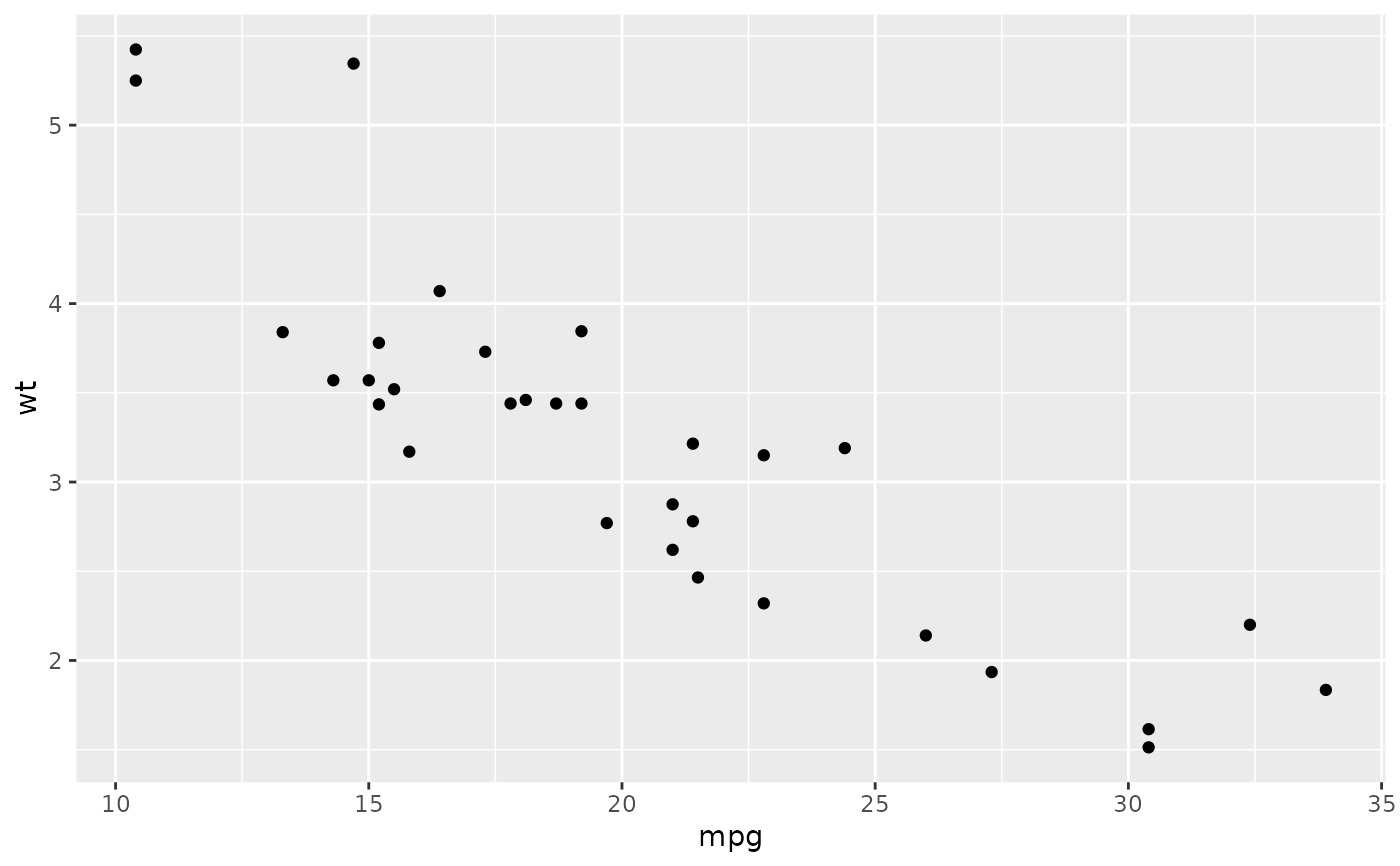
p <- ggplot(mtcars, aes(mpg, wt)) +
geom_point()
p
 # Use theme_set() to completely override the current theme.
# theme_update() and theme_replace() are similar except they
# apply directly to the current/active theme.
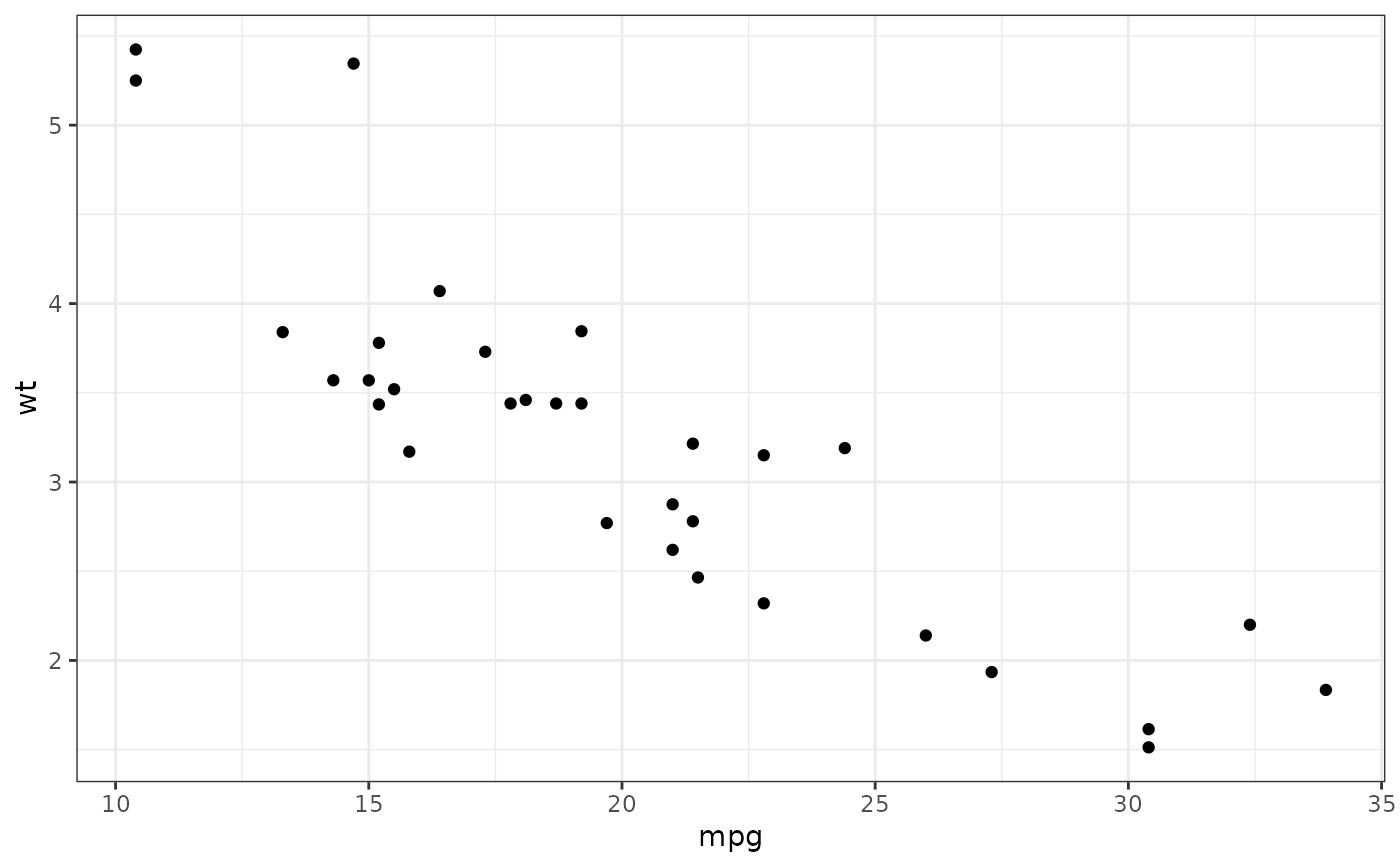
# theme_update() modifies a particular element of the current theme.
# Here we have the old theme so we can later restore it.
# Note that the theme is applied when the plot is drawn, not
# when it is created.
old <- theme_set(theme_bw())
p
 theme_set(old)
theme_update(panel.grid.minor = element_line(colour = "red"))
p
 theme_set(old)
theme_replace(panel.grid.minor = element_line(colour = "red"))
p
 theme_set(old)
p
 # Modifying theme objects -----------------------------------------
# You can use + and %+replace% to modify a theme object.
# They differ in how they deal with missing arguments in
# the theme elements.
add_el <- theme_grey() +
theme(text = element_text(family = "Times"))
add_el$text
#> List of 11
#> $ family : chr "Times"
#> $ face : chr "plain"
#> $ colour : chr "black"
#> $ size : num 11
#> $ hjust : num 0.5
#> $ vjust : num 0.5
#> $ angle : num 0
#> $ lineheight : num 0.9
#> $ margin : 'margin' num [1:4] 0points 0points 0points 0points
#> ..- attr(*, "unit")= int 8
#> $ debug : logi FALSE
#> $ inherit.blank: logi FALSE
#> - attr(*, "class")= chr [1:2] "element_text" "element"
rep_el <- theme_grey() %+replace%
theme(text = element_text(family = "Times"))
rep_el$text
#> List of 11
#> $ family : chr "Times"
#> $ face : NULL
#> $ colour : NULL
#> $ size : NULL
#> $ hjust : NULL
#> $ vjust : NULL
#> $ angle : NULL
#> $ lineheight : NULL
#> $ margin : NULL
#> $ debug : NULL
#> $ inherit.blank: logi FALSE
#> - attr(*, "class")= chr [1:2] "element_text" "element"
相关用法
- R ggplot2 theme 修改主题的组件
- R ggplot2 annotation_logticks 注释:记录刻度线
- R ggplot2 vars 引用分面变量
- R ggplot2 position_stack 将重叠的对象堆叠在一起
- R ggplot2 geom_qq 分位数-分位数图
- R ggplot2 geom_spoke 由位置、方向和距离参数化的线段
- R ggplot2 geom_quantile 分位数回归
- R ggplot2 geom_text 文本
- R ggplot2 get_alt_text 从绘图中提取替代文本
- R ggplot2 annotation_custom 注释:自定义grob
- R ggplot2 geom_ribbon 函数区和面积图
- R ggplot2 stat_ellipse 计算法行数据椭圆
- R ggplot2 resolution 计算数值向量的“分辨率”
- R ggplot2 geom_boxplot 盒须图(Tukey 风格)
- R ggplot2 lims 设置规模限制
- R ggplot2 geom_hex 二维箱计数的六边形热图
- R ggplot2 scale_gradient 渐变色阶
- R ggplot2 scale_shape 形状比例,又称字形
- R ggplot2 geom_bar 条形图
- R ggplot2 draw_key 图例的关键字形
- R ggplot2 annotate 创建注释层
- R ggplot2 label_bquote 带有数学表达式的标签
- R ggplot2 annotation_map 注释:Map
- R ggplot2 scale_viridis 来自 viridisLite 的 Viridis 色标
- R ggplot2 coord_fixed 具有固定“纵横比”的笛卡尔坐标
注:本文由纯净天空筛选整理自Hadley Wickham等大神的英文原创作品 Get, set, and modify the active theme。非经特殊声明,原始代码版权归原作者所有,本译文未经允许或授权,请勿转载或复制。
