此函数与位置刻度结合使用以创建与主轴相对的辅助轴。所有辅助轴必须基于主轴的一对一转换。
用法
sec_axis(
  trans = NULL,
  name = waiver(),
  breaks = waiver(),
  labels = waiver(),
  guide = waiver()
)

dup_axis(
  trans = ~.,
  name = derive(),
  breaks = derive(),
  labels = derive(),
  guide = derive()
)

derive()
参数
- trans
-
变换的公式或函数
- name
-
辅助轴的名称
- breaks
-
之一:
-
NULL不间断 -
waiver()用于由转换对象计算的默认中断 -
位置的数值向量
-
将限制作为输入并返回中断作为输出的函数
-
- labels
-
之一:
-
NULL无标签 -
waiver()用于由转换对象计算的默认标签 -
给出标签的字符向量(必须与
breaks长度相同) -
将中断作为输入并返回标签作为输出的函数
-
- guide
-
将用于在绘图上渲染轴的位置指南。通常这是
guide_axis()。
细节
sec_axis() 用于创建辅助轴的规格。除了 trans 参数之外,任何参数都可以设置为 derive(),这将导致辅助轴继承主轴的设置。
dup_axis() 是作为创建辅助轴的简写形式提供的,该辅助轴是主轴的副本,从而有效地镜像主轴。
从 v3.1 开始,日期和日期时间刻度的辅助轴函数有限。与其他连续刻度不同,日期和日期时间刻度的辅助轴转换必须遵循其主要 POSIX 数据结构。这意味着它们只能通过加法或减法进行转换,例如~ . + hms::hms(days = 8) 或 ~ . - 8*60*60 。非线性变换将返回错误。要在这种情况下生成事件以来的次轴,用户可以考虑调整次轴标签。
例子
p <- ggplot(mtcars, aes(cyl, mpg)) +
geom_point()
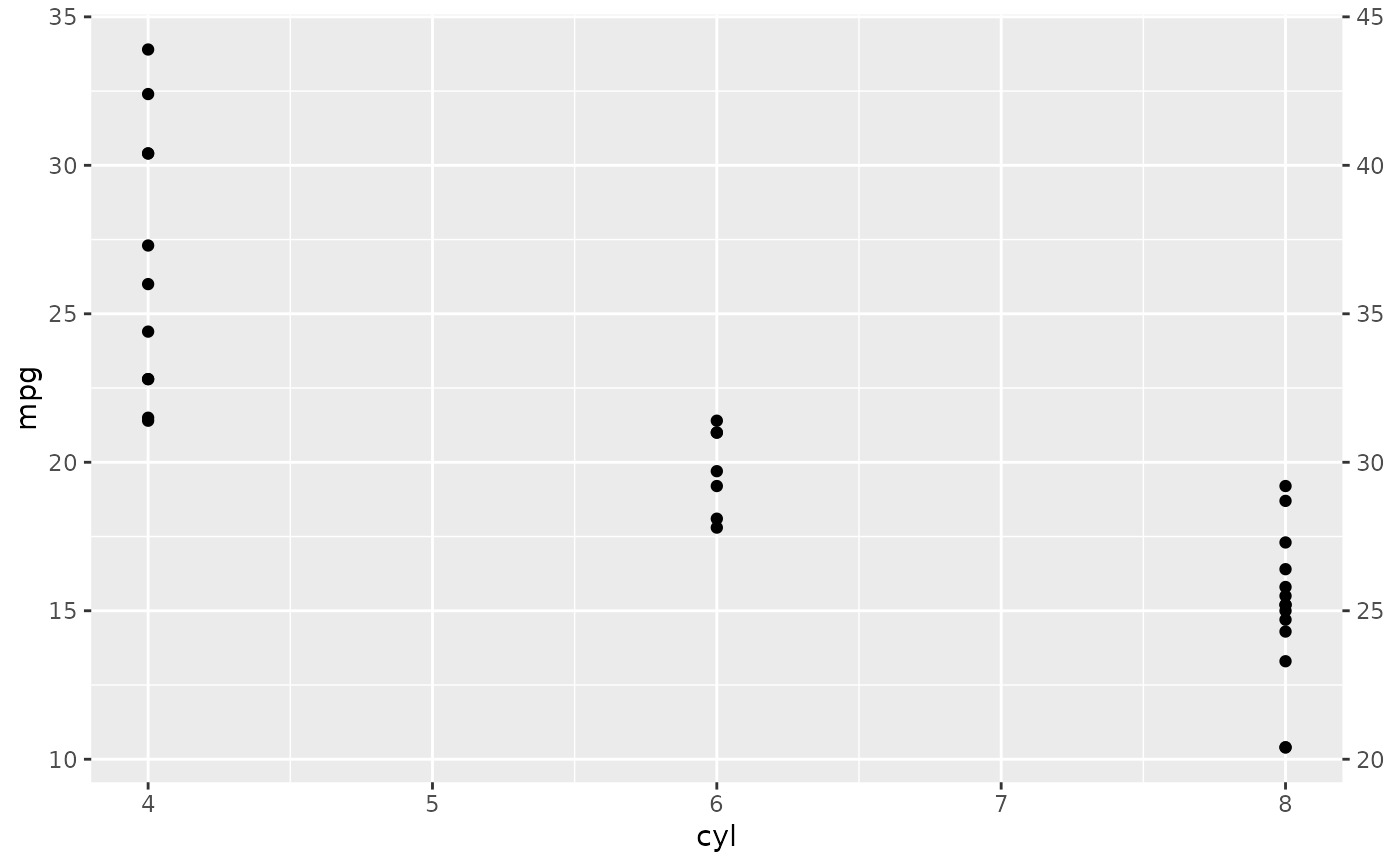
# Create a simple secondary axis
p + scale_y_continuous(sec.axis = sec_axis(~ . + 10))
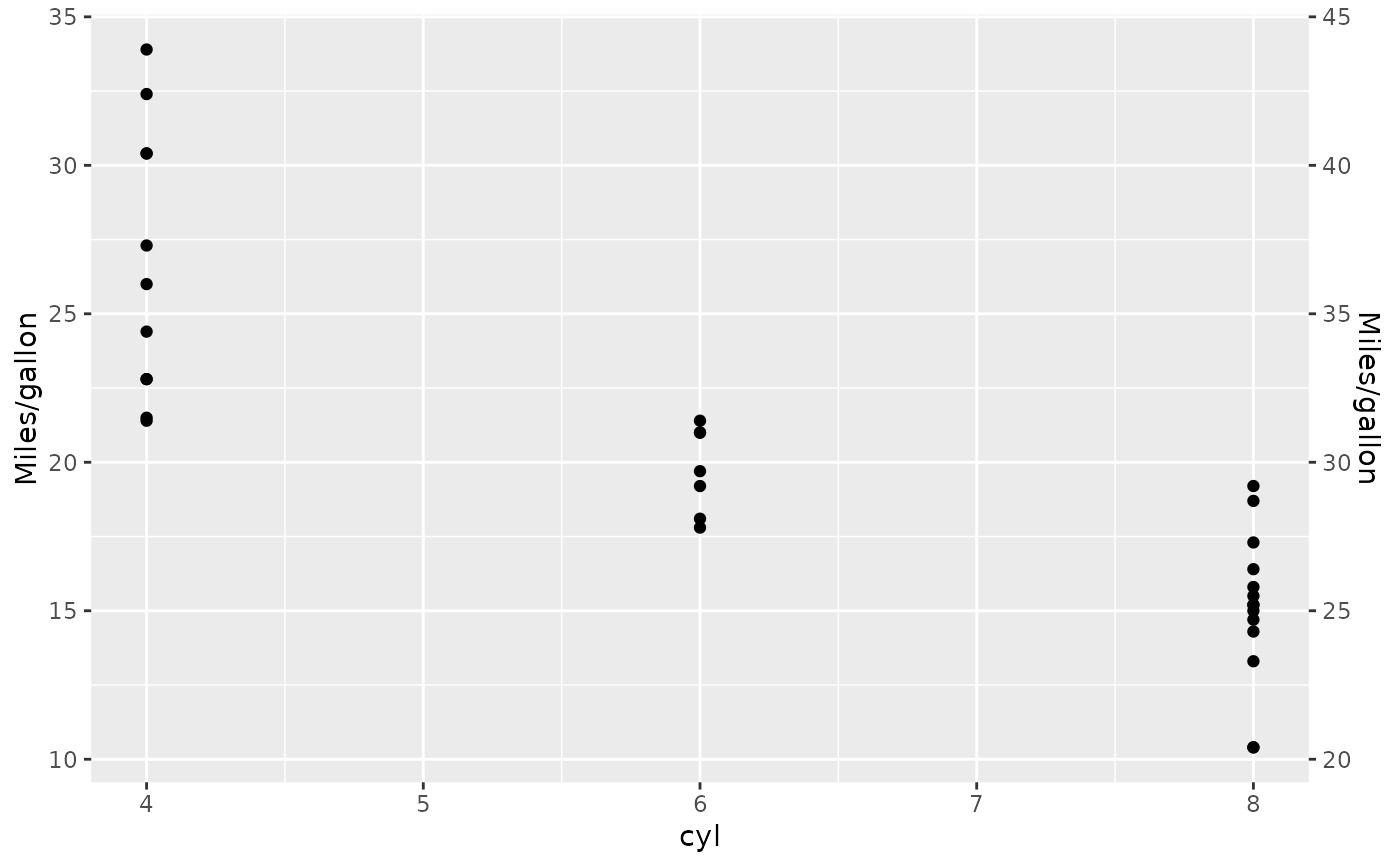
 # Inherit the name from the primary axis
p + scale_y_continuous("Miles/gallon", sec.axis = sec_axis(~ . + 10, name = derive()))
# Inherit the name from the primary axis
p + scale_y_continuous("Miles/gallon", sec.axis = sec_axis(~ . + 10, name = derive()))
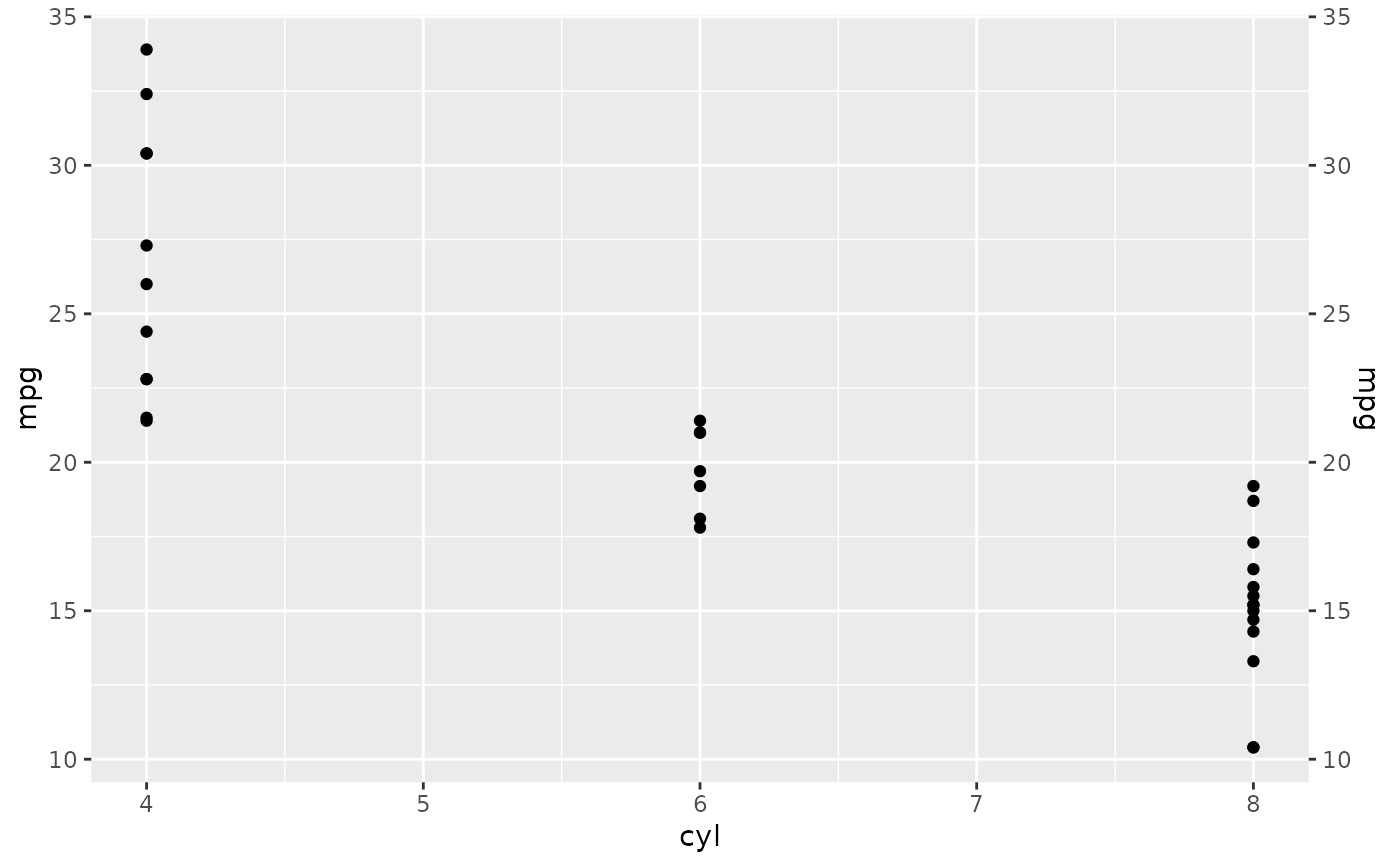
 # Duplicate the primary axis
p + scale_y_continuous(sec.axis = dup_axis())
# Duplicate the primary axis
p + scale_y_continuous(sec.axis = dup_axis())
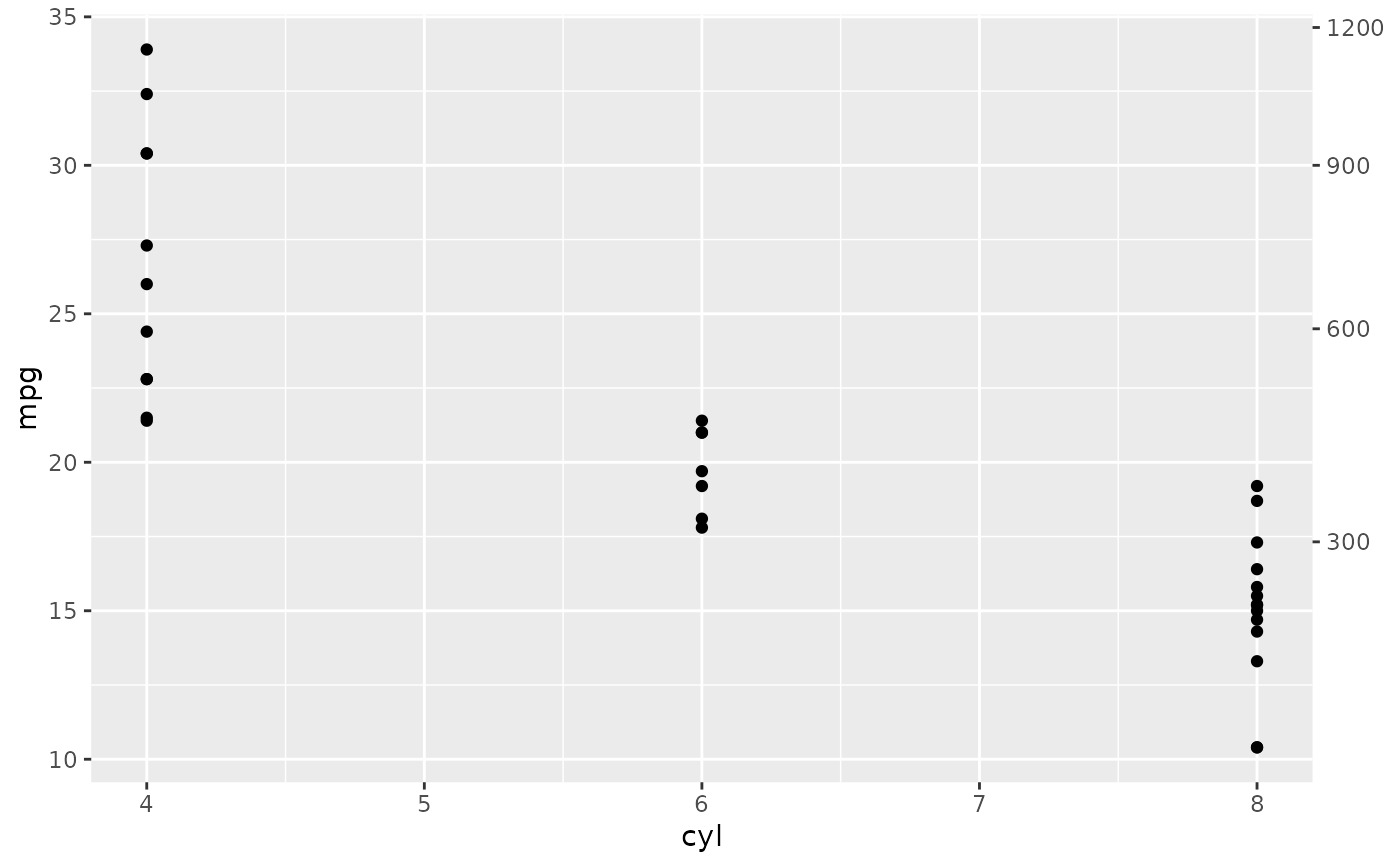
 # You can pass in a formula as a shorthand
p + scale_y_continuous(sec.axis = ~ .^2)
# You can pass in a formula as a shorthand
p + scale_y_continuous(sec.axis = ~ .^2)
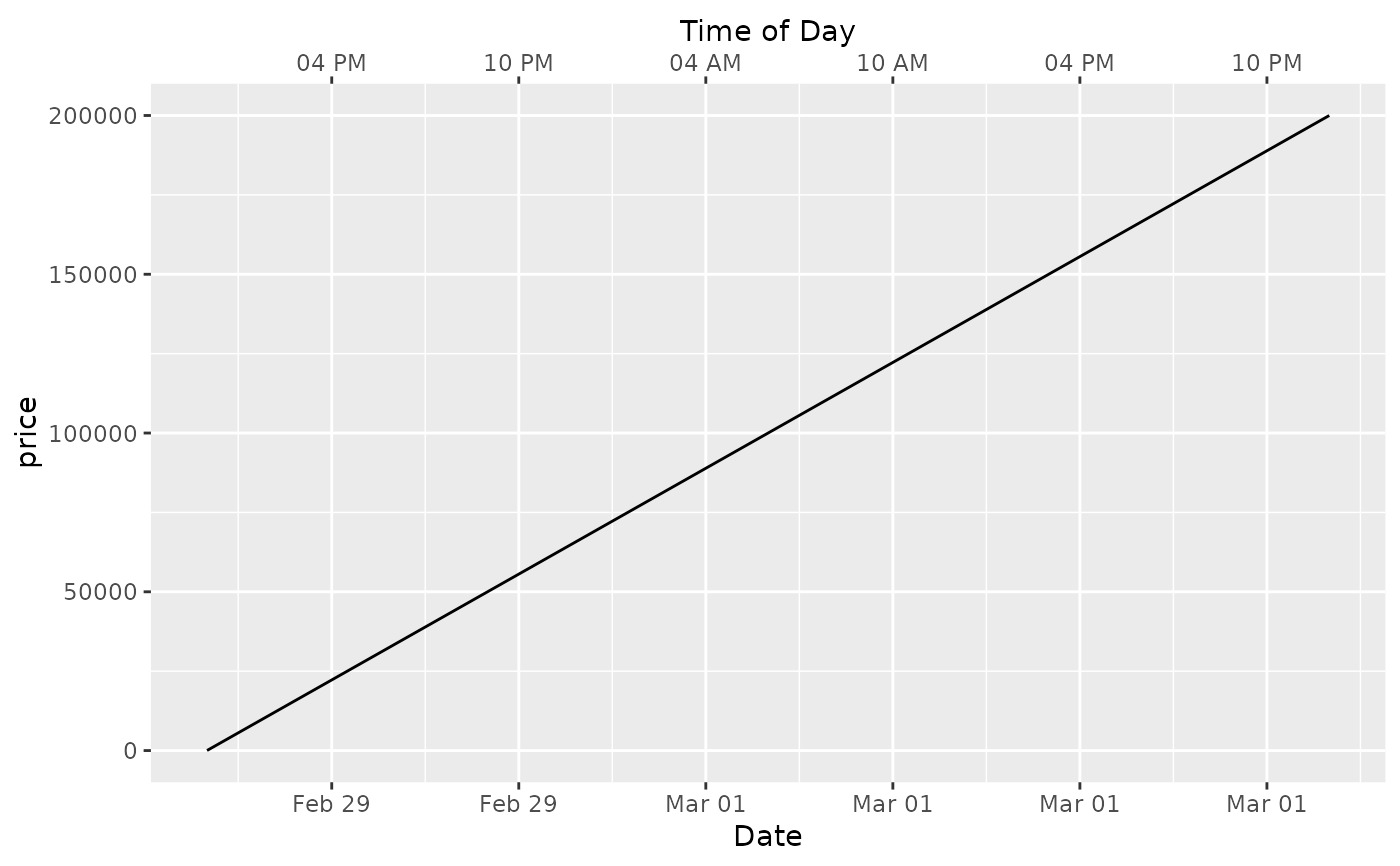
 # Secondary axes work for date and datetime scales too:
df <- data.frame(
dx = seq(
as.POSIXct("2012-02-29 12:00:00", tz = "UTC"),
length.out = 10,
by = "4 hour"
),
price = seq(20, 200000, length.out = 10)
)
# This may useful for labelling different time scales in the same plot
ggplot(df, aes(x = dx, y = price)) +
geom_line() +
scale_x_datetime(
"Date",
date_labels = "%b %d",
date_breaks = "6 hour",
sec.axis = dup_axis(
name = "Time of Day",
labels = scales::time_format("%I %p")
)
)
# Secondary axes work for date and datetime scales too:
df <- data.frame(
dx = seq(
as.POSIXct("2012-02-29 12:00:00", tz = "UTC"),
length.out = 10,
by = "4 hour"
),
price = seq(20, 200000, length.out = 10)
)
# This may useful for labelling different time scales in the same plot
ggplot(df, aes(x = dx, y = price)) +
geom_line() +
scale_x_datetime(
"Date",
date_labels = "%b %d",
date_breaks = "6 hour",
sec.axis = dup_axis(
name = "Time of Day",
labels = scales::time_format("%I %p")
)
)
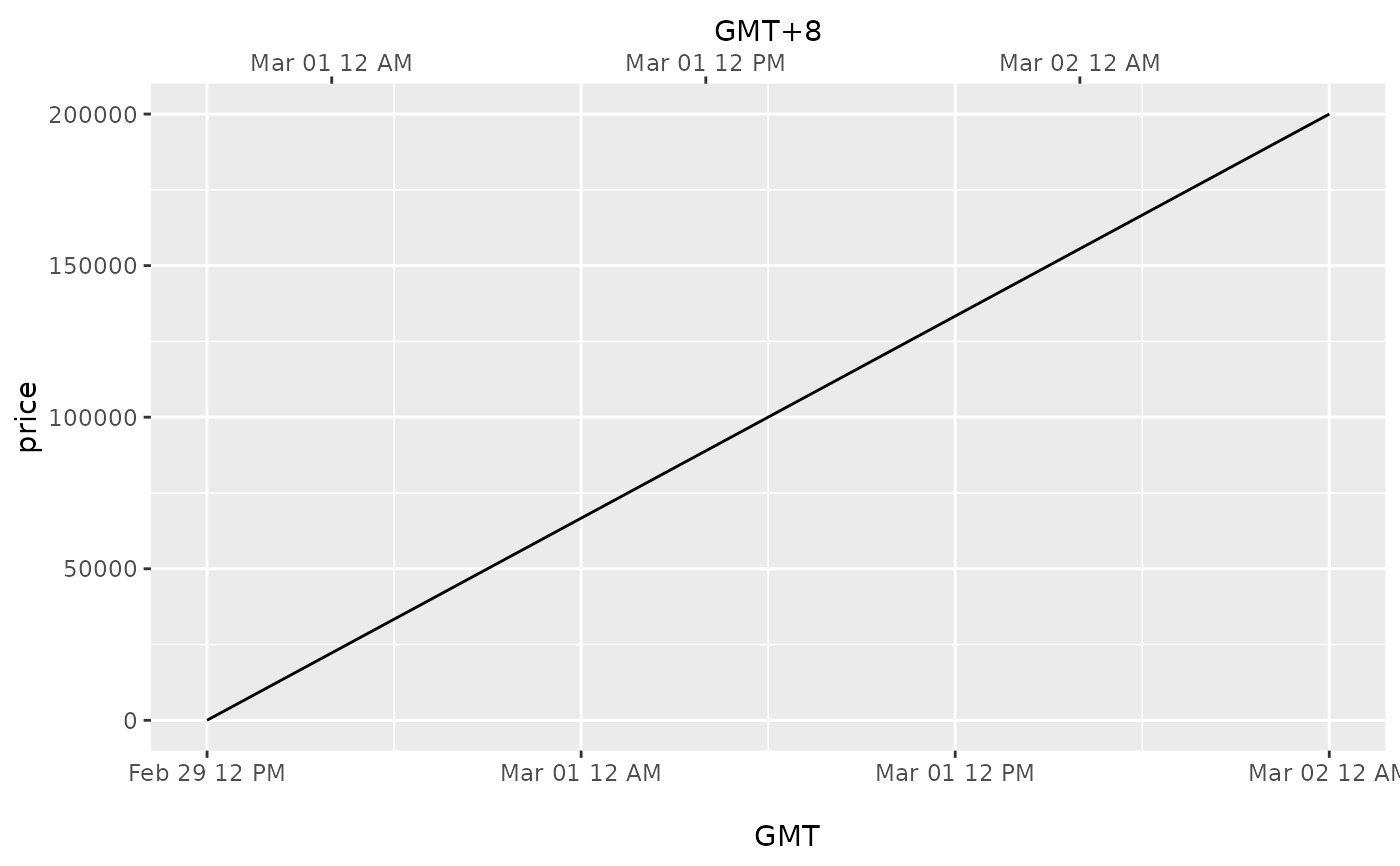
 # or to transform axes for different timezones
ggplot(df, aes(x = dx, y = price)) +
geom_line() +
scale_x_datetime("
GMT",
date_labels = "%b %d %I %p",
sec.axis = sec_axis(
~ . + 8 * 3600,
name = "GMT+8",
labels = scales::time_format("%b %d %I %p")
)
)
# or to transform axes for different timezones
ggplot(df, aes(x = dx, y = price)) +
geom_line() +
scale_x_datetime("
GMT",
date_labels = "%b %d %I %p",
sec.axis = sec_axis(
~ . + 8 * 3600,
name = "GMT+8",
labels = scales::time_format("%b %d %I %p")
)
)
相关用法
- R ggplot2 stat_ellipse 计算法行数据椭圆
- R ggplot2 scale_gradient 渐变色阶
- R ggplot2 scale_shape 形状比例,又称字形
- R ggplot2 scale_viridis 来自 viridisLite 的 Viridis 色标
- R ggplot2 scale_grey 连续灰度色阶
- R ggplot2 scale_linetype 线条图案的比例
- R ggplot2 scale_discrete 离散数据的位置尺度
- R ggplot2 stat_identity 保留数据原样
- R ggplot2 scale_manual 创建您自己的离散尺度
- R ggplot2 scale_colour_discrete 离散色阶
- R ggplot2 stat_summary_2d 以二维形式进行分类和汇总(矩形和六边形)
- R ggplot2 scale_steps 分级渐变色标
- R ggplot2 should_stop 在示例中用于说明何时应该发生错误。
- R ggplot2 scale_size 面积或半径比例
- R ggplot2 stat_summary 总结唯一/分箱 x 处的 y 值
- R ggplot2 scale_date 日期/时间数据的位置刻度
- R ggplot2 stat_sf_coordinates 从“sf”对象中提取坐标
- R ggplot2 stat_unique 删除重复项
- R ggplot2 scale_continuous 连续数据的位置比例(x 和 y)
- R ggplot2 scale_binned 用于对连续数据进行装箱的位置比例(x 和 y)
- R ggplot2 scale_alpha Alpha 透明度比例
- R ggplot2 scale_colour_continuous 连续色标和分级色标
- R ggplot2 stat_ecdf 计算经验累积分布
- R ggplot2 scale_identity 使用不缩放的值
- R ggplot2 scale_linewidth 线宽比例
注:本文由纯净天空筛选整理自Hadley Wickham等大神的英文原创作品 Specify a secondary axis。非经特殊声明,原始代码版权归原作者所有,本译文未经允许或授权,请勿转载或复制。