当连续数据值分别映射到 colour 或 fill 美学时,scale_colour_continuous() 和 scale_fill_continuous() 是 ggplot2 使用的默认色标。标度 scale_colour_binned() 和 scale_fill_binned() 是等效的标度函数,它们将离散颜色箱分配给连续值,而不是使用连续色谱。
用法
scale_colour_continuous(..., type = getOption("ggplot2.continuous.colour"))

scale_fill_continuous(..., type = getOption("ggplot2.continuous.fill"))

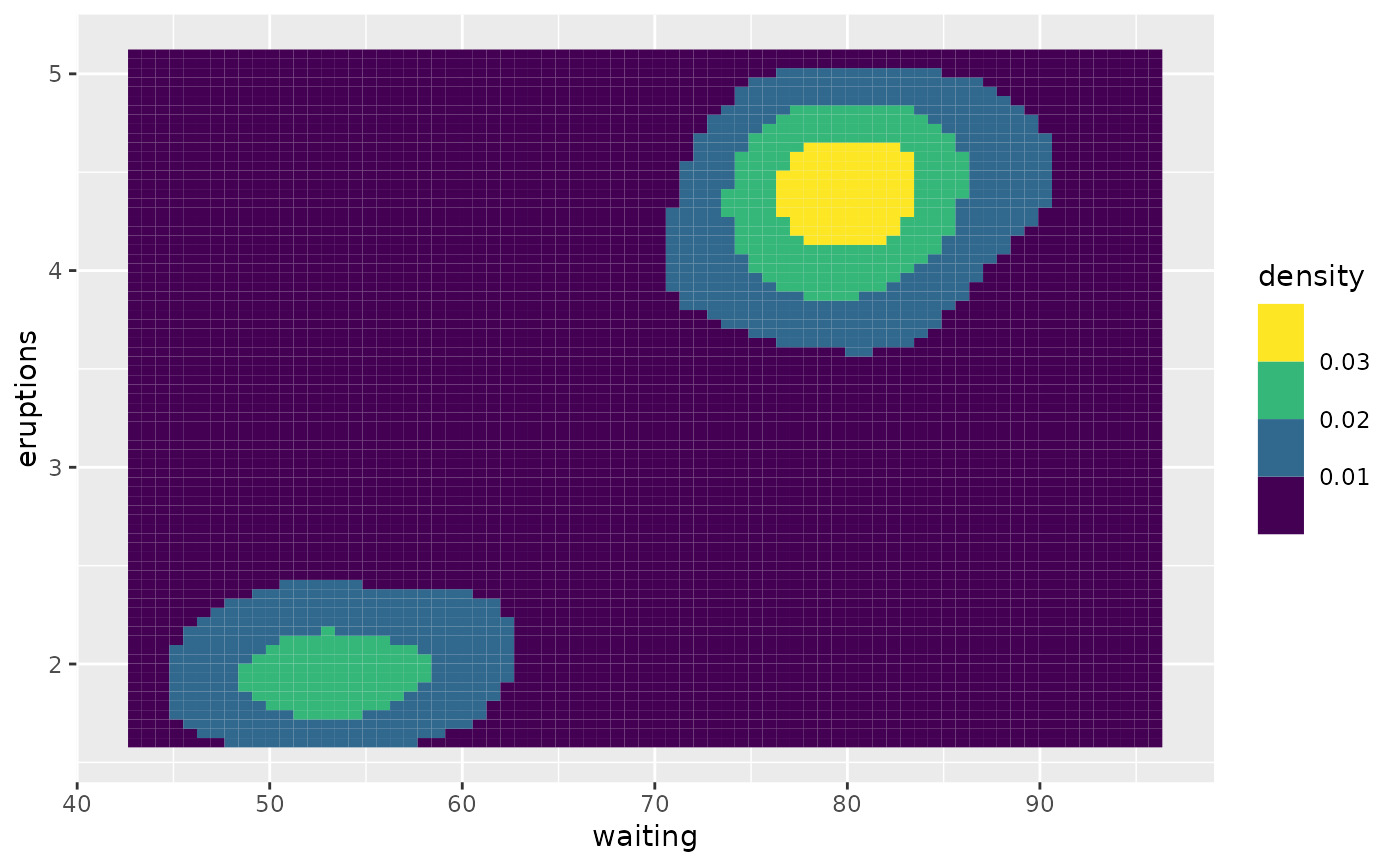
scale_colour_binned(..., type = getOption("ggplot2.binned.colour"))

scale_fill_binned(..., type = getOption("ggplot2.binned.fill"))细节
所有这些色标都使用 options() 机制来确定默认设置。连续色标默认为 ggplot2.continuous.colour 和 ggplot2.continuous.fill 选项的值,分箱色标默认为 ggplot2.binned.colour 和 ggplot2.binned.fill 选项的值。这些选项值默认为 "gradient" ,这意味着实际使用的比例函数是 scale_colour_gradient() /scale_fill_gradient() (连续比例)和 scale_colour_steps() /scale_fill_steps() (分箱比例)。替代选项值为"viridis" 或不同的比例函数。有关详细信息,请参阅 type 参数的说明。
请注意,如果未设置 ggplot2.binned.colour 或 ggplot2.binned.fill,则分箱色标将分别使用 ggplot2.continuous.colour 和 ggplot2.continuous.fill 的设置作为后备。
这些比例函数旨在提供简单的默认值。如果您想手动设置刻度的颜色,请考虑使用 scale_colour_gradient() 或 scale_colour_steps() 。
色盲
许多源自 RGB 组合的调色板(例如 "rainbow" 调色板)并不适合支持所有观看者,尤其是那些有色觉缺陷的观看者。使用 viridis 类型(颜色和 black-and-white 显示在感知上一致)是确保可视化具有良好感知属性的简单选择。色彩空间包提供的函数
-
生成具有良好感知特性的调色板,
-
分析给定的调色板,例如模拟色盲,
-
并修改给定的调色板以获得更好的感知能力。
有关色觉缺陷和合适的颜色选择的更多信息,请参阅paper on the colorspace package 及其参考文献。
也可以看看
scale_colour_gradient()、scale_colour_viridis_c()、scale_colour_steps()、scale_colour_viridis_b()、scale_fill_gradient()、scale_fill_viridis_c()、scale_fill_steps() 和 scale_fill_viridis_b()
其他色标:scale_alpha()、scale_colour_brewer()、scale_colour_gradient()、scale_colour_grey()、scale_colour_hue()、scale_colour_steps()、scale_colour_viridis_d()
例子
v <- ggplot(faithfuld, aes(waiting, eruptions, fill = density)) +
geom_tile()
v
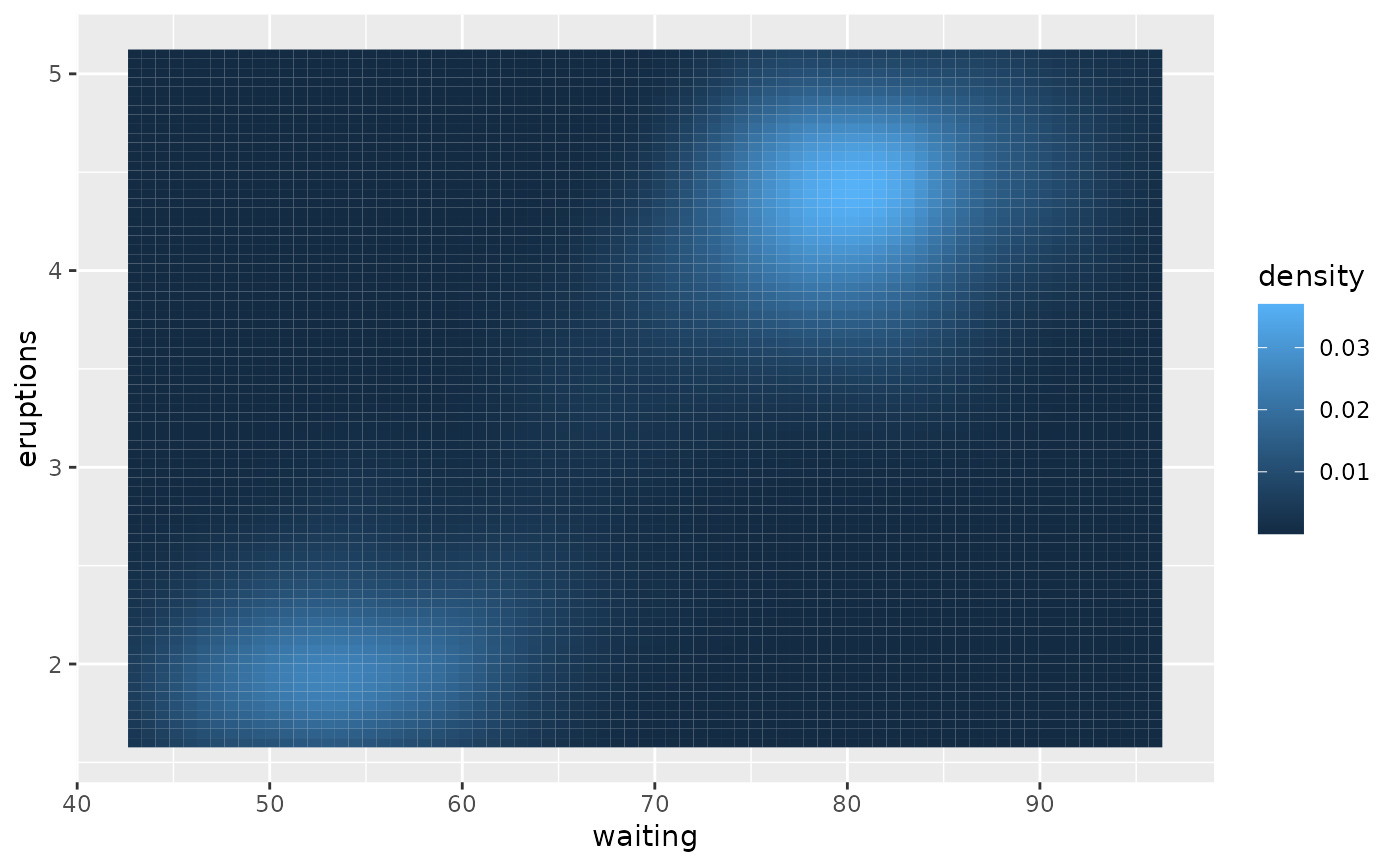 v + scale_fill_continuous(type = "gradient")
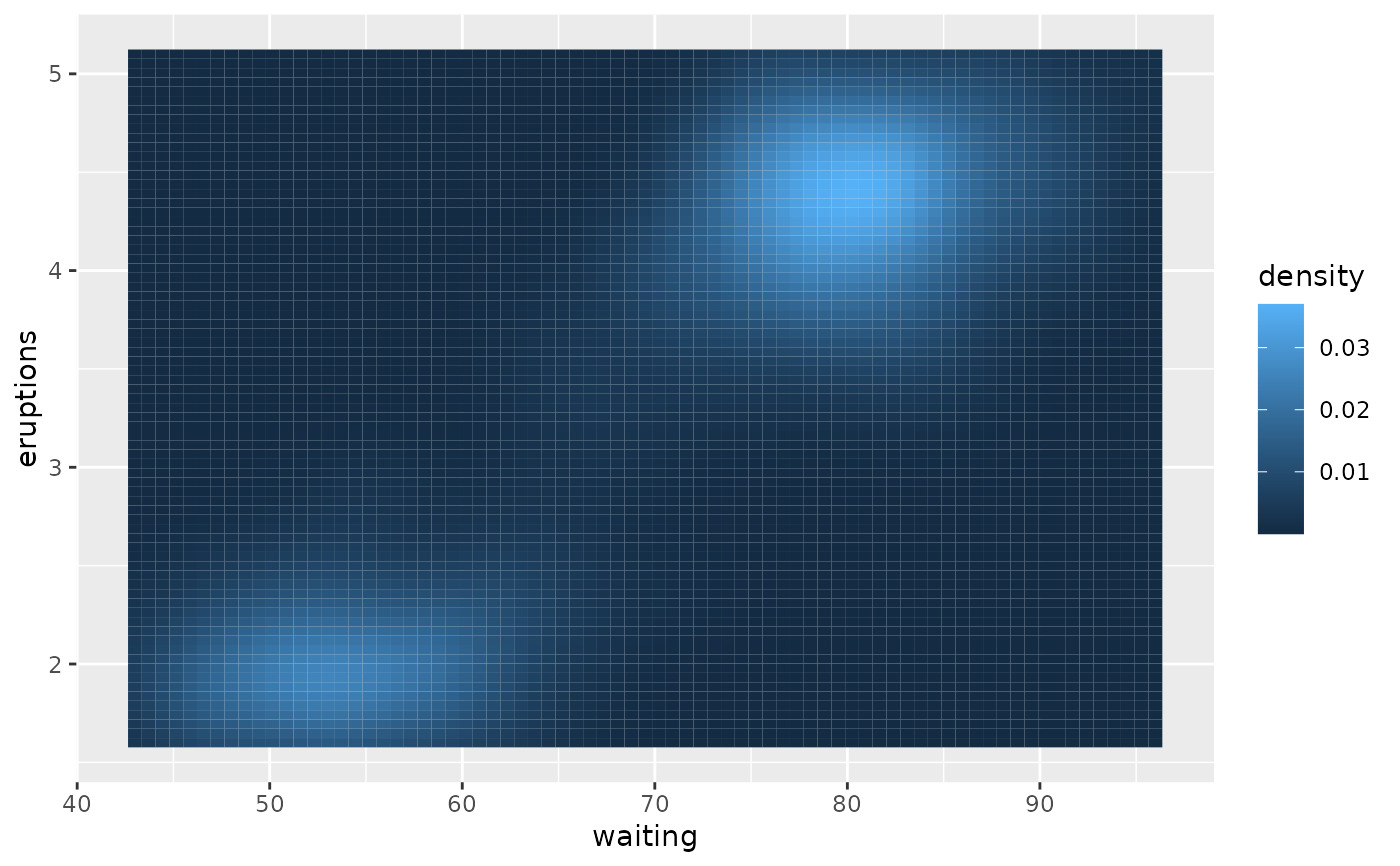 v + scale_fill_continuous(type = "viridis")
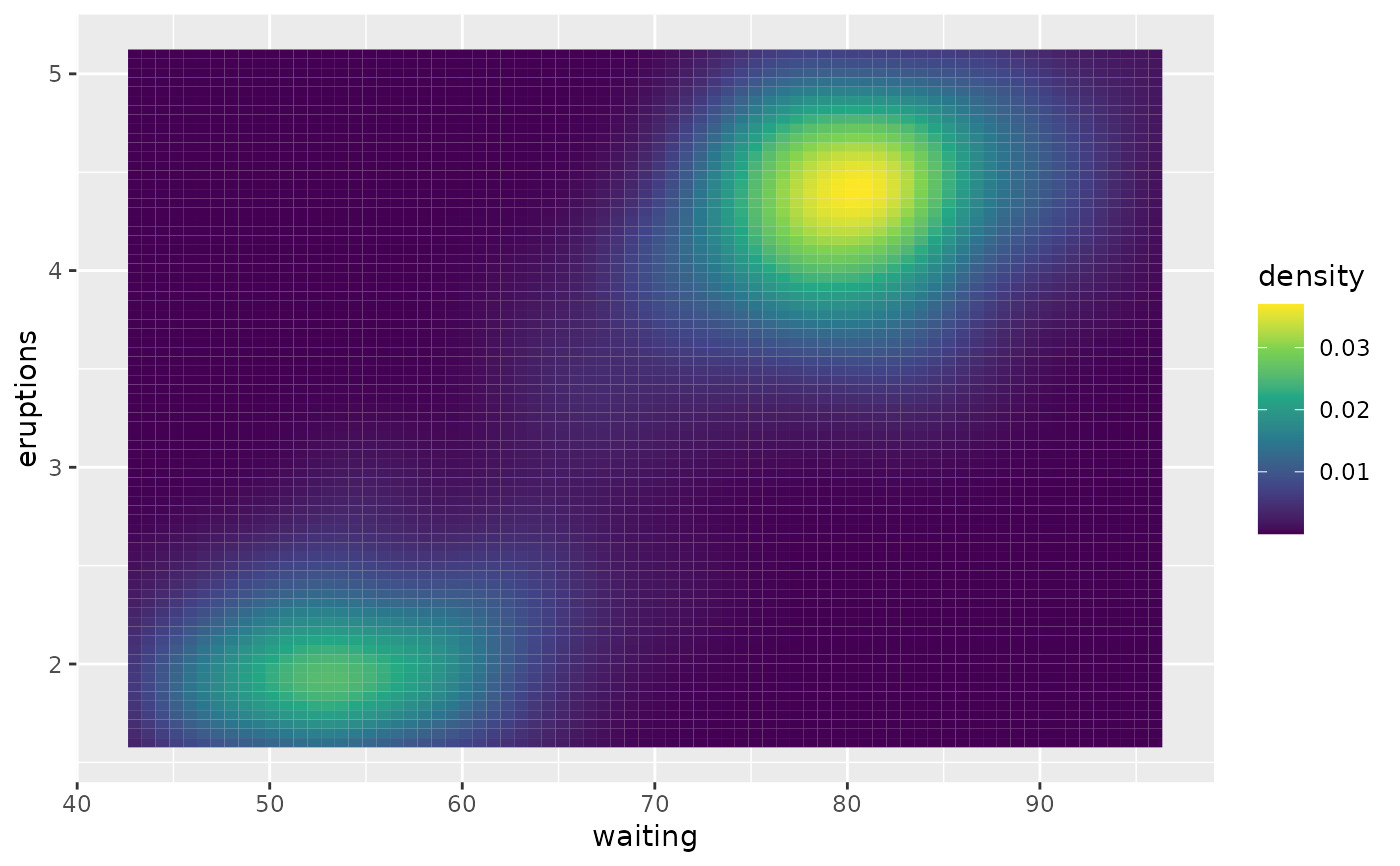 # The above are equivalent to
v + scale_fill_gradient()
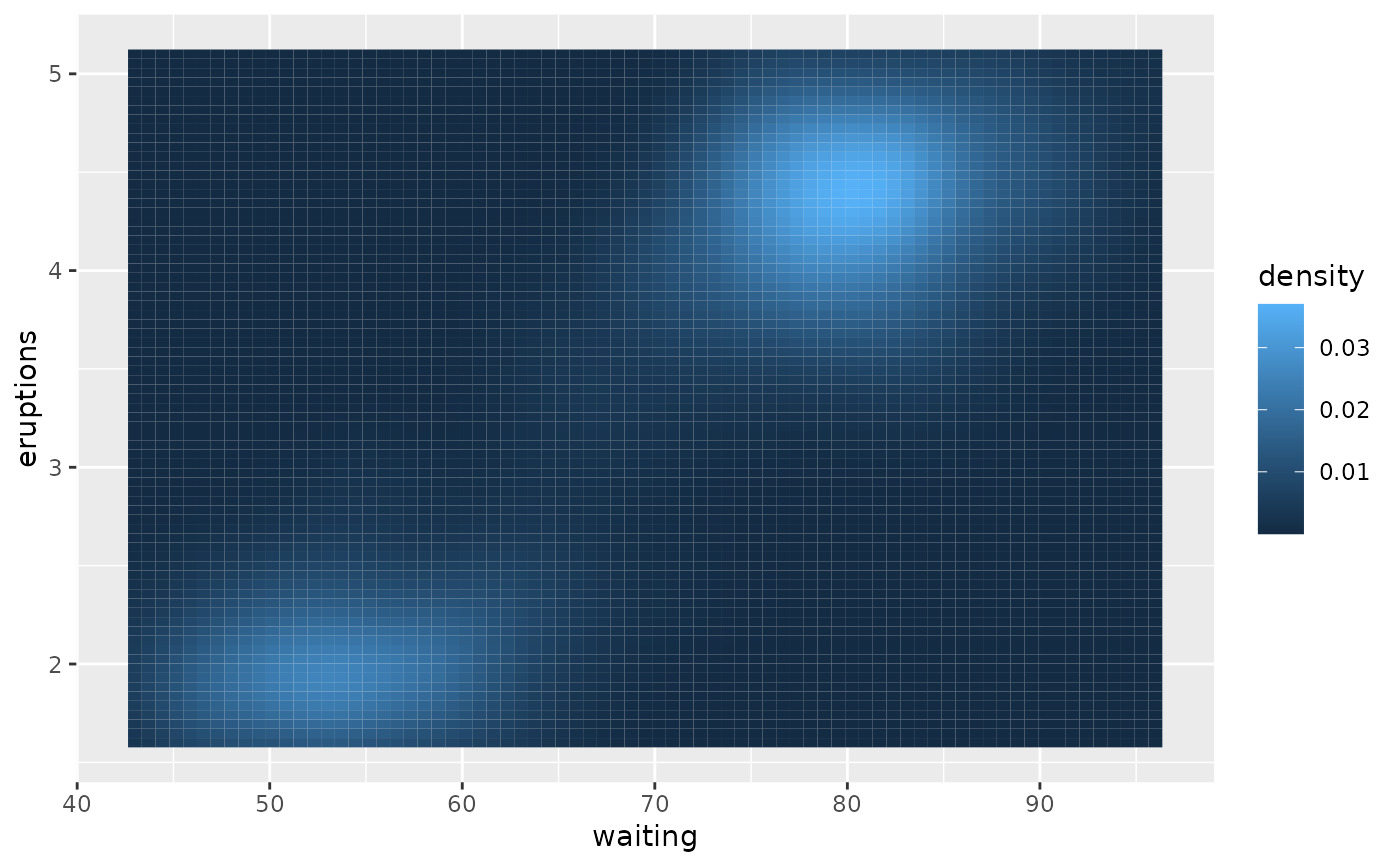 v + scale_fill_viridis_c()
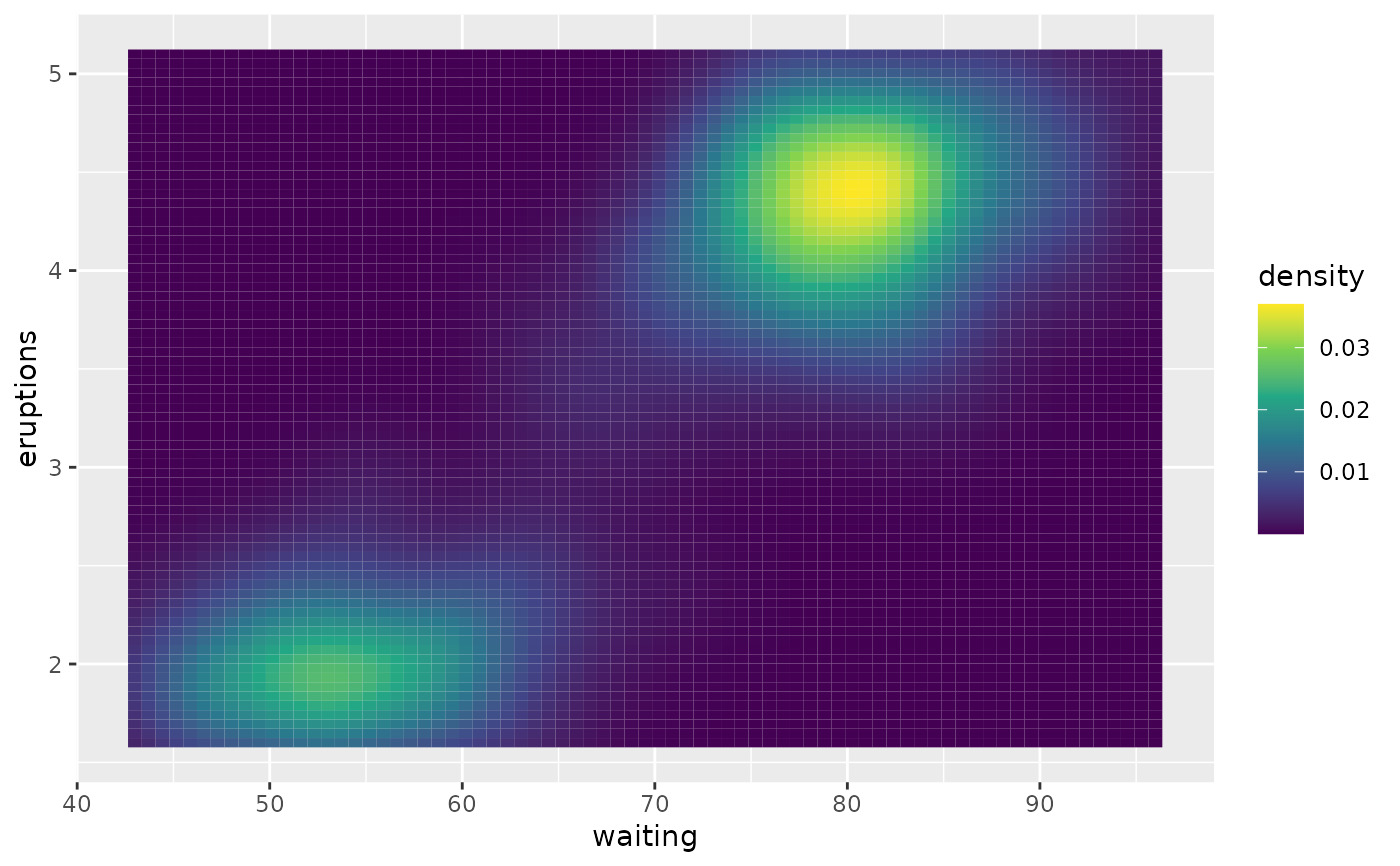 # To make a binned version of this plot
v + scale_fill_binned(type = "viridis")
 # Set a different default scale using the options
# mechanism
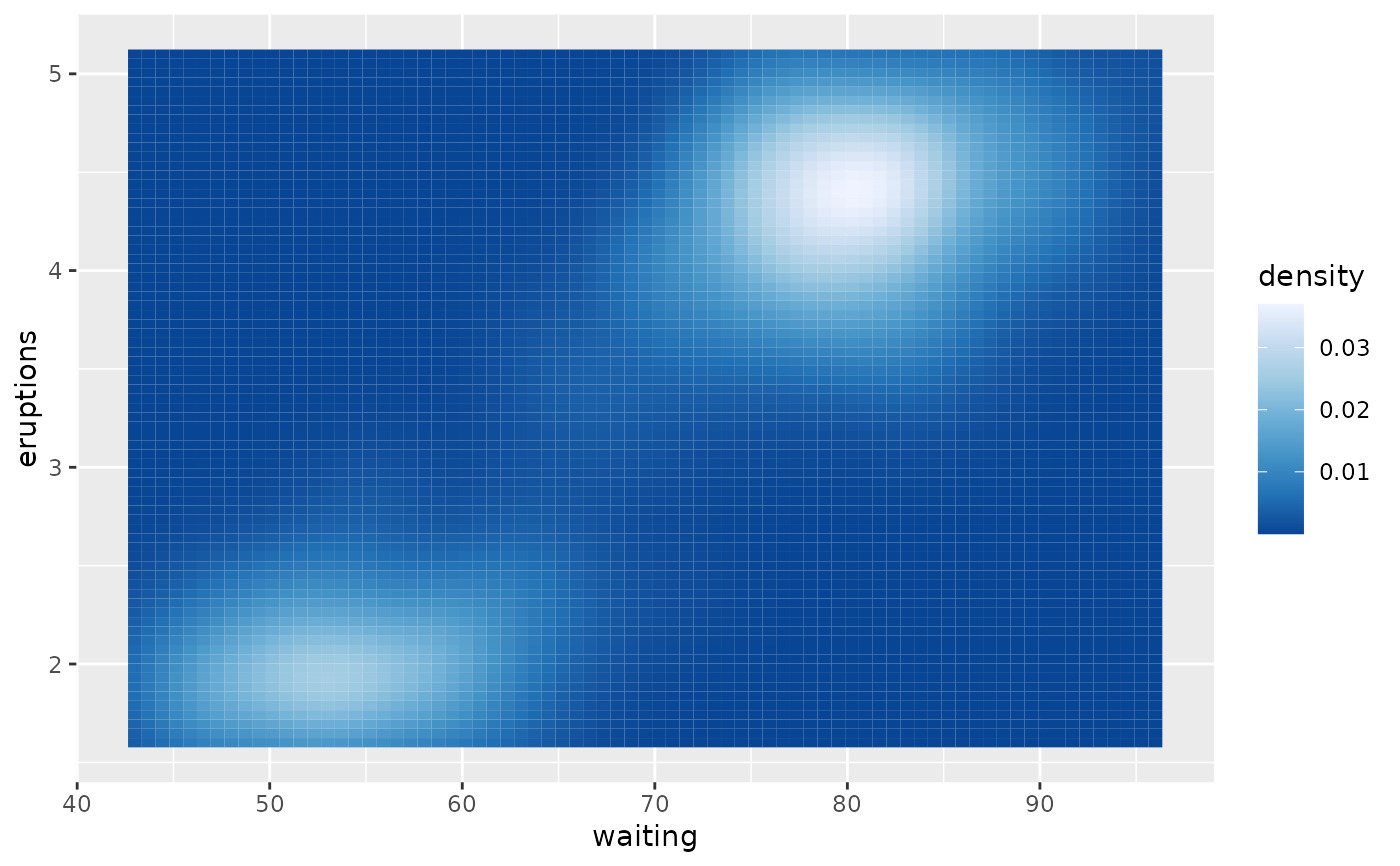
tmp <- getOption("ggplot2.continuous.fill") # store current setting
options(ggplot2.continuous.fill = scale_fill_distiller)
v
 options(ggplot2.continuous.fill = tmp) # restore previous setting
相关用法
- R ggplot2 scale_colour_discrete 离散色阶
- R ggplot2 scale_continuous 连续数据的位置比例(x 和 y)
- R ggplot2 scale_gradient 渐变色阶
- R ggplot2 scale_shape 形状比例,又称字形
- R ggplot2 scale_viridis 来自 viridisLite 的 Viridis 色标
- R ggplot2 scale_grey 连续灰度色阶
- R ggplot2 scale_linetype 线条图案的比例
- R ggplot2 scale_discrete 离散数据的位置尺度
- R ggplot2 scale_manual 创建您自己的离散尺度
- R ggplot2 scale_steps 分级渐变色标
- R ggplot2 scale_size 面积或半径比例
- R ggplot2 scale_date 日期/时间数据的位置刻度
- R ggplot2 scale_binned 用于对连续数据进行装箱的位置比例(x 和 y)
- R ggplot2 scale_alpha Alpha 透明度比例
- R ggplot2 scale_identity 使用不缩放的值
- R ggplot2 scale_linewidth 线宽比例
- R ggplot2 scale_hue 离散数据的均匀间隔颜色
- R ggplot2 scale_brewer ColorBrewer 的连续、发散和定性色标
- R ggplot2 stat_ellipse 计算法行数据椭圆
- R ggplot2 stat_identity 保留数据原样
- R ggplot2 stat_summary_2d 以二维形式进行分类和汇总(矩形和六边形)
- R ggplot2 should_stop 在示例中用于说明何时应该发生错误。
- R ggplot2 stat_summary 总结唯一/分箱 x 处的 y 值
- R ggplot2 stat_sf_coordinates 从“sf”对象中提取坐标
- R ggplot2 stat_unique 删除重复项
注:本文由纯净天空筛选整理自Hadley Wickham等大神的英文原创作品 Continuous and binned colour scales。非经特殊声明,原始代码版权归原作者所有,本译文未经允许或授权,请勿转载或复制。
