本文簡要介紹 python 語言中 scipy.interpolate.splprep 的用法。
用法:
scipy.interpolate.splprep(x, w=None, u=None, ub=None, ue=None, k=3, task=0, s=None, t=None, full_output=0, nest=None, per=0, quiet=1)#找到N-D 曲線的B-spline 表示。
給定一個 N 階 1 數組 x(表示由 u 參數化的 N 維空間中的曲線)的列表,找到一條平滑的近似樣條曲線 g(u)。使用 FITPACK 中的 FORTRAN 例程 parcur。
- x: array_like
表示曲線的樣本向量數組列表。
- w: 數組,可選
嚴格為正的 rank-1 權重數組,其長度與x[0]。權重用於計算加權最小二乘樣條擬合。如果錯誤在x值具有由向量 d 給出的標準偏差,則w應該是 1/d。默認為
ones(len(x[0])).- u: 數組,可選
一組參數值。如果未給出,這些值將自動計算為
M = len(x[0]),其中v[0] = 0
v[i] = v[i-1] + distance(x[i], x[i-1])
u[i] = v[i] / v[M-1]
- ub, ue: 整數,可選
參數區間的端點。默認為 u[0] 和 u[-1]。
- k: 整數,可選
樣條曲線的度數。建議使用三次樣條。偶數的值k應避免使用小s-value。
1 <= k <= 5, 默認為 3。- task: 整數,可選
如果 task==0(默認),為給定的平滑因子 s 找到 t 和 c。如果 task==1,則為平滑因子 s 的另一個值找到 t 和 c。對於同一組數據,之前必須有一個 task=0 或 task=1 的調用。如果 task=-1 找到給定節點集 t 的加權最小二乘樣條。
- s: 浮點數,可選
平滑條件。通過滿足以下條件確定平滑度:
sum((w * (y - g))**2,axis=0) <= s,其中 g(x) 是 (x,y) 的平滑插值。用戶可以使用s來控製擬合的緊密度和平滑度之間的權衡。較大s意味著更平滑,而較小的值s表示平滑度較低。的推薦值s取決於權重,w。如果權重代表 y 的標準差的倒數,那麽一個好的s值應在範圍內找到(m-sqrt(2*m),m+sqrt(2*m)),其中 m 是 x、y 和 w 中的數據點數。- t: 數組,可選
task=-1所需的結。必須至少有2*k+2結。- full_output: 整數,可選
如果非零,則返回可選輸出。
- nest: 整數,可選
樣條的總結數的over-estimate,以幫助確定存儲空間。默認嵌套=m/2。總是足夠大的是nest=m+k+1。
- per: 整數,可選
如果非零,則將數據點視為周期為
x[m-1] - x[0]的周期性數據點,並返回平滑的周期性樣條近似。不使用y[m-1]和w[m-1]的值。- quiet: 整數,可選
非零抑製消息。
- tck: 元組
一個元組
(t,c,k)包含結向量、B-spline 係數和樣條曲線的階數。- u: 數組
參數值的數組。
- fp: 浮點數
樣條近似的殘差平方和的加權和。
- ier: int
關於 splrep 成功的整數標誌。如果 ier<=0,則表示成功。如果 ier 在 [1,2,3] 中發生錯誤但未引發錯誤。否則會引發錯誤。
- msg: str
與整數標誌 ier 對應的消息。
參數 ::
返回 ::
注意:
請參閱
splev以評估樣條及其導數。維數 N 必須小於 11。係數的個數c數組是
k+1小於結數,len(t).這與scipy.interpolate.splrep,其中 zero-pads 係數數組與節點數組具有相同的長度。這些附加係數被評估程序忽略,splev和scipy.interpolate.BSpline.參考:
[1]P. Dierckx,“用周期性和參數樣條曲線平滑數據的算法,計算機圖形學和圖像處理”,20 (1982) 171-184。
[2]P. Dierckx,“使用周期性和參數樣條曲線平滑數據的算法”,報告 tw55,計算機科學係,K.U.Leuven,1981 年。
[3]P. Dierckx,“用樣條擬合曲線和曲麵”,數值分析專著,牛津大學出版社,1993 年。
例子:
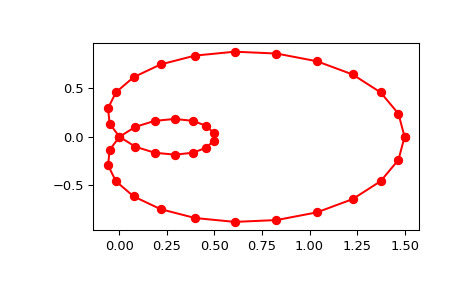
在極坐標中生成一個 limacon 曲線的離散化:
>>> import numpy as np
>>> phi = np.linspace(0, 2.*np.pi, 40)
>>> r = 0.5 + np.cos(phi)         # polar coords
>>> x, y = r * np.cos(phi), r * np.sin(phi)    # convert to cartesian
並插值:
>>> from scipy.interpolate import splprep, splev >>> tck, u = splprep([x, y], s=0) >>> new_points = splev(u, tck)請注意(i)我們通過使用強製插值s=0, (ii) 參數化,
u, 自動生成。現在繪製結果:>>> import matplotlib.pyplot as plt >>> fig, ax = plt.subplots() >>> ax.plot(x, y, 'ro') >>> ax.plot(new_points[0], new_points[1], 'r-') >>> plt.show()
相關用法
- Python SciPy interpolate.splder用法及代碼示例
- Python SciPy interpolate.splantider用法及代碼示例
- Python SciPy interpolate.splrep用法及代碼示例
- Python SciPy interpolate.sproot用法及代碼示例
- Python SciPy interpolate.make_interp_spline用法及代碼示例
- Python SciPy interpolate.krogh_interpolate用法及代碼示例
- Python SciPy interpolate.InterpolatedUnivariateSpline用法及代碼示例
- Python SciPy interpolate.BSpline用法及代碼示例
- Python SciPy interpolate.LSQSphereBivariateSpline用法及代碼示例
- Python SciPy interpolate.griddata用法及代碼示例
- Python SciPy interpolate.LinearNDInterpolator用法及代碼示例
- Python SciPy interpolate.PPoly用法及代碼示例
- Python SciPy interpolate.NdBSpline用法及代碼示例
- Python SciPy interpolate.pade用法及代碼示例
- Python SciPy interpolate.barycentric_interpolate用法及代碼示例
- Python SciPy interpolate.RegularGridInterpolator用法及代碼示例
- Python SciPy interpolate.NdPPoly用法及代碼示例
- Python SciPy interpolate.interp2d用法及代碼示例
- Python SciPy interpolate.approximate_taylor_polynomial用法及代碼示例
- Python SciPy interpolate.RectSphereBivariateSpline用法及代碼示例
- Python SciPy interpolate.CloughTocher2DInterpolator用法及代碼示例
- Python SciPy interpolate.interp1d用法及代碼示例
- Python SciPy interpolate.BPoly用法及代碼示例
- Python SciPy interpolate.BarycentricInterpolator用法及代碼示例
- Python SciPy interpolate.make_smoothing_spline用法及代碼示例
注:本文由純淨天空篩選整理自scipy.org大神的英文原創作品 scipy.interpolate.splprep。非經特殊聲明,原始代碼版權歸原作者所有,本譯文未經允許或授權,請勿轉載或複製。
