本文簡要介紹 python 語言中 scipy.interpolate.griddata 的用法。
用法:
scipy.interpolate.griddata(points, values, xi, method='linear', fill_value=nan, rescale=False)#插入非結構化D-D 數據。
- points: 具有形狀 (n, D) 的浮點數的二維 ndarray,或具有形狀 (n,) 的一維 ndarray 的長度 D 元組。
數據點坐標。
- values: 浮點數或複數的ndarray,形狀(n,)
數據值。
- xi: 具有形狀 (m, D) 或長度為 D 的 ndarray 元組的二維 ndarray 可廣播到相同形狀。
插入數據的點。
- method: {‘linear’, ‘nearest’, ‘cubic’},可選
插值方法。之一
nearest返回最接近插值點的數據點的值。有關詳細信息,請參閱
NearestNDInterpolator。linear將設置為 N-D 單純形的輸入點細分,並在每個單純形上進行線性插值。有關詳細信息,請參閱
LinearNDInterpolator。cubic(一維)返回從三次樣條確定的值。
cubic(二維)返回從分段三次、連續可微 (C1) 和近似 curvature-minimizing 多項式曲麵確定的值。有關詳細信息,請參閱
CloughTocher2DInterpolator。
- fill_value: 浮點數,可選
用於填充輸入點凸包之外的請求點的值。如果未提供,則默認值為
nan。此選項對‘nearest’ 方法無效。- rescale: 布爾型,可選
在執行插值之前將點重新縮放到單位立方體。如果某些輸入維度具有不可比較的單位並且相差許多數量級,這將很有用。
- ndarray
插值數組。
參數 ::
返回 ::
注意:
注意
對於常規網格上的數據,請改用
interpn。例子:
假設我們要對二維函數進行插值
>>> import numpy as np
>>> def func(x, y):
...     return x*(1-x)*np.cos(4*np.pi*x) * np.sin(4*np.pi*y**2)**2
在 [0, 1]x[0, 1] 的網格上
>>> grid_x, grid_y = np.mgrid[0:1:100j, 0:1:200j]但我們隻知道它在 1000 個數據點處的值:
>>> rng = np.random.default_rng()
>>> points = rng.random((1000, 2))
>>> values = func(points[:,0], points[:,1])
這可以使用
griddata來完成 - 下麵我們嘗試所有插值方法:>>> from scipy.interpolate import griddata >>> grid_z0 = griddata(points, values, (grid_x, grid_y), method='nearest') >>> grid_z1 = griddata(points, values, (grid_x, grid_y), method='linear') >>> grid_z2 = griddata(points, values, (grid_x, grid_y), method='cubic')可以看到,所有方法都在某種程度上重現了確切的結果,但是對於這個平滑函數,分段三次插值法給出了最好的結果:
>>> import matplotlib.pyplot as plt
>>> plt.subplot(221)
>>> plt.imshow(func(grid_x, grid_y).T, extent=(0,1,0,1), origin='lower')
>>> plt.plot(points[:,0], points[:,1], 'k.', ms=1)
>>> plt.title('Original')
>>> plt.subplot(222)
>>> plt.imshow(grid_z0.T, extent=(0,1,0,1), origin='lower')
>>> plt.title('Nearest')
>>> plt.subplot(223)
>>> plt.imshow(grid_z1.T, extent=(0,1,0,1), origin='lower')
>>> plt.title('Linear')
>>> plt.subplot(224)
>>> plt.imshow(grid_z2.T, extent=(0,1,0,1), origin='lower')
>>> plt.title('Cubic')
>>> plt.gcf().set_size_inches(6, 6)
>>> plt.show()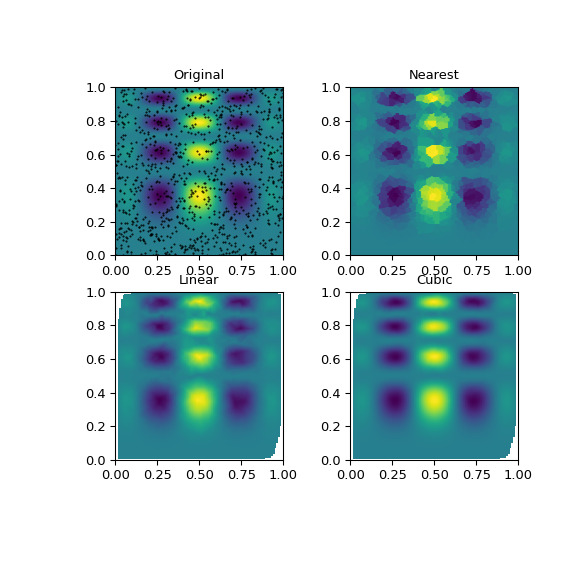
相關用法
- Python SciPy interpolate.make_interp_spline用法及代碼示例
- Python SciPy interpolate.krogh_interpolate用法及代碼示例
- Python SciPy interpolate.InterpolatedUnivariateSpline用法及代碼示例
- Python SciPy interpolate.BSpline用法及代碼示例
- Python SciPy interpolate.LSQSphereBivariateSpline用法及代碼示例
- Python SciPy interpolate.splder用法及代碼示例
- Python SciPy interpolate.LinearNDInterpolator用法及代碼示例
- Python SciPy interpolate.PPoly用法及代碼示例
- Python SciPy interpolate.NdBSpline用法及代碼示例
- Python SciPy interpolate.pade用法及代碼示例
- Python SciPy interpolate.barycentric_interpolate用法及代碼示例
- Python SciPy interpolate.RegularGridInterpolator用法及代碼示例
- Python SciPy interpolate.NdPPoly用法及代碼示例
- Python SciPy interpolate.interp2d用法及代碼示例
- Python SciPy interpolate.approximate_taylor_polynomial用法及代碼示例
- Python SciPy interpolate.RectSphereBivariateSpline用法及代碼示例
- Python SciPy interpolate.sproot用法及代碼示例
- Python SciPy interpolate.splantider用法及代碼示例
- Python SciPy interpolate.CloughTocher2DInterpolator用法及代碼示例
- Python SciPy interpolate.interp1d用法及代碼示例
- Python SciPy interpolate.BPoly用法及代碼示例
- Python SciPy interpolate.BarycentricInterpolator用法及代碼示例
- Python SciPy interpolate.splrep用法及代碼示例
- Python SciPy interpolate.make_smoothing_spline用法及代碼示例
- Python SciPy interpolate.Rbf用法及代碼示例
注:本文由純淨天空篩選整理自scipy.org大神的英文原創作品 scipy.interpolate.griddata。非經特殊聲明,原始代碼版權歸原作者所有,本譯文未經允許或授權,請勿轉載或複製。