本文簡要介紹 python 語言中 scipy.interpolate.krogh_interpolate 的用法。
用法:
scipy.interpolate.krogh_interpolate(xi, yi, x, der=0, axis=0)#多項式插值的便利函數。
有關詳細信息,請參閱
KroghInterpolator。- xi: array_like
插值點(已知 x 坐標)。
- yi: array_like
已知的 y 坐標,形狀為
(xi.size, R)。解釋為長度為 R 的向量,或者如果 R=1 則為標量。- x: array_like
評估導數的一個或多個點。
- der: int 或列表或無,可選
要評估多少個導數,或者對於所有潛在的非零導數為“無”(即,等於點數的數字),或者要評估的導數列表。該數字包括作為 ‘0th’ 導數的函數值。
- axis: 整數,可選
yi 數組中對應於 x 坐標值的軸。
- d: ndarray
如果插值器的值為R-D,則返回的數組將是N乘R的導數。如果x是標量,則中間維度將被刪除;如果 yi 是標量,那麽最後一個維度將被刪除。
參數 ::
返回 ::
注意:
構建插值多項式是一個相對昂貴的過程。如果您想重複評估它,請考慮使用KroghInterpolator 類(這是該函數使用的)。
例子:
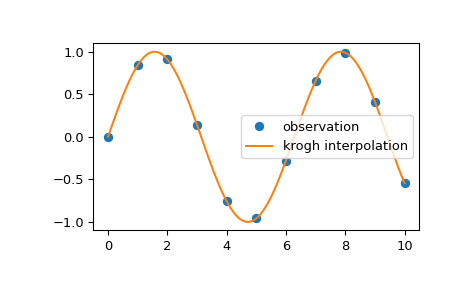
我們可以使用 Krogh 插值法對二維觀測數據進行插值:
>>> import numpy as np
>>> import matplotlib.pyplot as plt
>>> from scipy.interpolate import krogh_interpolate
>>> x_observed = np.linspace(0.0, 10.0, 11)
>>> y_observed = np.sin(x_observed)
>>> x = np.linspace(min(x_observed), max(x_observed), num=100)
>>> y = krogh_interpolate(x_observed, y_observed, x)
>>> plt.plot(x_observed, y_observed, "o", label="observation")
>>> plt.plot(x, y, label="krogh interpolation")
>>> plt.legend()
>>> plt.show()
相關用法
- Python SciPy interpolate.make_interp_spline用法及代碼示例
- Python SciPy interpolate.InterpolatedUnivariateSpline用法及代碼示例
- Python SciPy interpolate.BSpline用法及代碼示例
- Python SciPy interpolate.LSQSphereBivariateSpline用法及代碼示例
- Python SciPy interpolate.griddata用法及代碼示例
- Python SciPy interpolate.splder用法及代碼示例
- Python SciPy interpolate.LinearNDInterpolator用法及代碼示例
- Python SciPy interpolate.PPoly用法及代碼示例
- Python SciPy interpolate.NdBSpline用法及代碼示例
- Python SciPy interpolate.pade用法及代碼示例
- Python SciPy interpolate.barycentric_interpolate用法及代碼示例
- Python SciPy interpolate.RegularGridInterpolator用法及代碼示例
- Python SciPy interpolate.NdPPoly用法及代碼示例
- Python SciPy interpolate.interp2d用法及代碼示例
- Python SciPy interpolate.approximate_taylor_polynomial用法及代碼示例
- Python SciPy interpolate.RectSphereBivariateSpline用法及代碼示例
- Python SciPy interpolate.sproot用法及代碼示例
- Python SciPy interpolate.splantider用法及代碼示例
- Python SciPy interpolate.CloughTocher2DInterpolator用法及代碼示例
- Python SciPy interpolate.interp1d用法及代碼示例
- Python SciPy interpolate.BPoly用法及代碼示例
- Python SciPy interpolate.BarycentricInterpolator用法及代碼示例
- Python SciPy interpolate.splrep用法及代碼示例
- Python SciPy interpolate.make_smoothing_spline用法及代碼示例
- Python SciPy interpolate.Rbf用法及代碼示例
注:本文由純淨天空篩選整理自scipy.org大神的英文原創作品 scipy.interpolate.krogh_interpolate。非經特殊聲明,原始代碼版權歸原作者所有,本譯文未經允許或授權,請勿轉載或複製。
