本文簡要介紹 python 語言中 scipy.stats.bayes_mvs 的用法。
用法:
scipy.stats.bayes_mvs(data, alpha=0.9)#均值、var 和 std 的貝葉斯置信區間。
- data: array_like
輸入數據,如果是多維的,則通過
bayes_mvs展平為一維。需要 2 個或更多數據點。- alpha: 浮點數,可選
返回的置信區間包含真實參數的概率。
- mean_cntr, var_cntr, std_cntr: 元組
這三個結果分別是均值、方差和標準差。每個結果都是以下形式的元組:
(center, (lower, upper))和中央給定數據的值的條件 pdf 的平均值,以及(小寫大寫)以中位數為中心的置信區間,包含對概率的估計
alpha.
參數 ::
返回 ::
注意:
每個均值、方差和標準差估計元組表示(中心,(下,上)),中心是給定數據值的條件 pdf 的平均值,(下,上)是以中位數為中心的置信區間,包含對概率
alpha的估計。將數據轉換為一維數據並假設所有數據具有相同的均值和方差。對方差和標準使用 Jeffrey 的先驗。
相當於
tuple((x.mean(), x.interval(alpha)) for x in mvsdist(dat))參考:
T.E. Oliphant,“從數據中估計均值、方差和標準差的貝葉斯觀點”,https://scholarsarchive.byu.edu/facpub/278,2006 年。
例子:
首先是一個演示輸出的基本示例:
>>> from scipy import stats
>>> data = [6, 9, 12, 7, 8, 8, 13]
>>> mean, var, std = stats.bayes_mvs(data)
>>> mean
Mean(statistic=9.0, minmax=(7.103650222612533, 10.896349777387467))
>>> var
Variance(statistic=10.0, minmax=(3.176724206..., 24.45910382...))
>>> std
Std_dev(statistic=2.9724954732045084, minmax=(1.7823367265645143, 4.945614605014631))
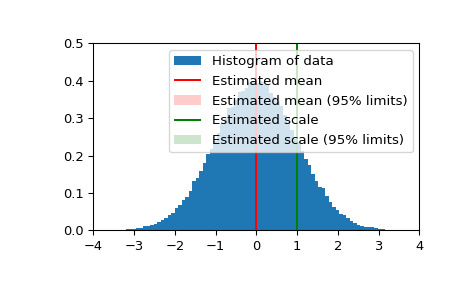
現在我們生成一些正態分布的隨機數據,並獲得這些估計的 95% 置信區間的均值和標準差估計值:
>>> n_samples = 100000
>>> data = stats.norm.rvs(size=n_samples)
>>> res_mean, res_var, res_std = stats.bayes_mvs(data, alpha=0.95)
>>> import matplotlib.pyplot as plt >>> fig = plt.figure() >>> ax = fig.add_subplot(111) >>> ax.hist(data, bins=100, density=True, label='Histogram of data') >>> ax.vlines(res_mean.statistic, 0, 0.5, colors='r', label='Estimated mean') >>> ax.axvspan(res_mean.minmax[0],res_mean.minmax[1], facecolor='r', ... alpha=0.2, label=r'Estimated mean (95% limits)') >>> ax.vlines(res_std.statistic, 0, 0.5, colors='g', label='Estimated scale') >>> ax.axvspan(res_std.minmax[0],res_std.minmax[1], facecolor='g', alpha=0.2, ... label=r'Estimated scale (95% limits)')>>> ax.legend(fontsize=10) >>> ax.set_xlim([-4, 4]) >>> ax.set_ylim([0, 0.5]) >>> plt.show()
相關用法
- Python SciPy stats.bartlett用法及代碼示例
- Python SciPy stats.barnard_exact用法及代碼示例
- Python SciPy stats.boltzmann用法及代碼示例
- Python SciPy stats.brunnermunzel用法及代碼示例
- Python SciPy stats.betaprime用法及代碼示例
- Python SciPy stats.betabinom用法及代碼示例
- Python SciPy stats.boxcox_normplot用法及代碼示例
- Python SciPy stats.boxcox用法及代碼示例
- Python SciPy stats.binned_statistic_2d用法及代碼示例
- Python SciPy stats.binned_statistic用法及代碼示例
- Python SciPy stats.boxcox_normmax用法及代碼示例
- Python SciPy stats.burr12用法及代碼示例
- Python SciPy stats.boschloo_exact用法及代碼示例
- Python SciPy stats.bootstrap用法及代碼示例
- Python SciPy stats.binom用法及代碼示例
- Python SciPy stats.burr用法及代碼示例
- Python SciPy stats.bws_test用法及代碼示例
- Python SciPy stats.beta用法及代碼示例
- Python SciPy stats.bradford用法及代碼示例
- Python SciPy stats.binomtest用法及代碼示例
- Python SciPy stats.binned_statistic_dd用法及代碼示例
- Python SciPy stats.boxcox_llf用法及代碼示例
- Python SciPy stats.binom_test用法及代碼示例
- Python SciPy stats.bernoulli用法及代碼示例
- Python SciPy stats.anderson用法及代碼示例
注:本文由純淨天空篩選整理自scipy.org大神的英文原創作品 scipy.stats.bayes_mvs。非經特殊聲明,原始代碼版權歸原作者所有,本譯文未經允許或授權,請勿轉載或複製。
