matplotlib 库的 axis 模块中的 XAxis.set_tick_params() 函数用于设置刻度、刻度标签和网格线的外观参数。
用法:XAxis.set_tick_params(self, which=’major’, reset=False, **kw)
参数:该方法接受以下参数。
- which:该参数用于将参数应用到哪个轴。
返回值:该方法不返回任何值。
下面的示例说明了 matplotlib.axis 中的 matplotlib.axis.XAxis.set_tick_params() 函数:
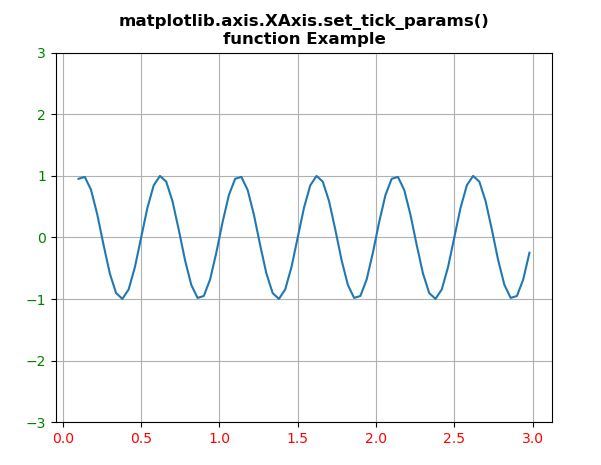
示例 1:
Python3
# Implementation of matplotlib function
import matplotlib.pyplot as plt
import numpy as np

t = np.arange(0.1, 3.0, 0.04)

fig, ax1 = plt.subplots()

ax1.plot(t, np.sin(4*np.pi * t))
ax1.grid(True)
ax1.set_ylim((-3, 3))

ax1.xaxis.set_tick_params(labelcolor='r')
ax1.yaxis.set_tick_params(labelcolor='g')

plt.title('matplotlib.axis.XAxis.set_tick_params() function Example',
          fontweight="bold")

plt.show()
输出:

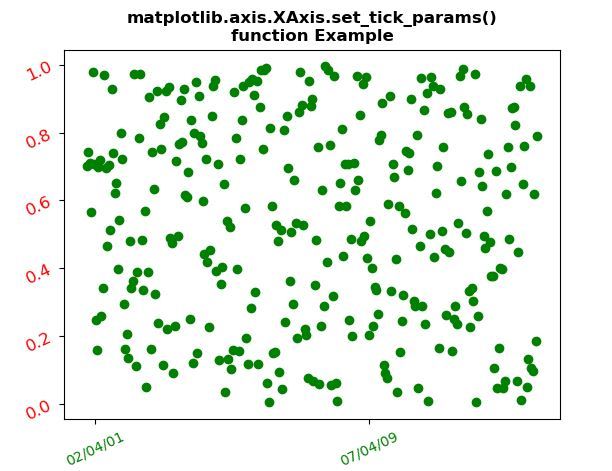
示例 2:
Python3
# Implementation of matplotlib function
import matplotlib.pyplot as plt
from matplotlib.dates import (YEARLY,
                              DateFormatter,
                              rrulewrapper,
                              RRuleLocator,
                              drange)
import numpy as np
import datetime

np.random.seed(19680801)

Val1 = rrulewrapper(YEARLY, byeaster=1, interval=5)
Val2 = RRuleLocator(Val1)

formatter = DateFormatter('%y/%m/%d')

date1 = datetime.date(2002, 2, 3)
date2 = datetime.date(2010, 5, 14)
delta = datetime.timedelta(days=10)

dates = drange(date1, date2, delta)
s = np.random.rand(len(dates))

fig, ax = plt.subplots()
plt.plot_date(dates, s, 'go')

ax.xaxis.set_major_locator(Val2)
ax.xaxis.set_major_formatter(formatter)
ax.xaxis.set_tick_params(rotation=25,
                         labelsize=10,
                         labelcolor="g")
ax.yaxis.set_tick_params(rotation=25,
                         labelsize=12,
                         labelcolor="r")

plt.title('matplotlib.axis.XAxis.set_tick_params()\n\
function Example', fontweight="bold")

plt.show()
输出:

相关用法
- Python Matplotlib.axis.XAxis.get_figure()用法及代码示例
- Python Matplotlib.axis.Axis.get_contains()用法及代码示例
- Python Matplotlib.axis.Axis.add_callback()用法及代码示例
- Python Matplotlib.axis.Axis.set_tick_params()用法及代码示例
- Python Matplotlib.axis.Tick.set_clip_path()用法及代码示例
- Python Matplotlib.axis.Tick.set_animated()用法及代码示例
- Python Matplotlib.axis.Axis.set_animated()用法及代码示例
- Python Matplotlib.axis.Tick.set_rasterized()用法及代码示例
- Python Matplotlib.axis.Axis.is_transform_set()用法及代码示例
- Python Matplotlib.axis.Axis.pickable()用法及代码示例
- Python Matplotlib.axis.Axis.properties()用法及代码示例
- Python Matplotlib.axis.Axis.set_major_locator()用法及代码示例
- Python Matplotlib.axis.Axis.set_figure()用法及代码示例
- Python Matplotlib.axis.Axis.set_gid()用法及代码示例
- Python Matplotlib.axis.Axis.set_contains()用法及代码示例
- Python Matplotlib.axis.Axis.set_clip_path()用法及代码示例
- Python Matplotlib.axis.Axis.set_clip_on()用法及代码示例
- Python Matplotlib.axis.Axis.set_clip_box()用法及代码示例
- Python Matplotlib.axis.Axis.set_alpha()用法及代码示例
- Python Matplotlib.axis.Axis.set()用法及代码示例
- Python Matplotlib.axis.Axis.remove()用法及代码示例
- Python Matplotlib.axis.Tick.get_window_extent()用法及代码示例
- Python Matplotlib.axis.Tick.get_zorder()用法及代码示例
- Python Matplotlib.axis.Tick.have_units()用法及代码示例
- Python Matplotlib.axis.Tick.is_transform_set()用法及代码示例
注:本文由纯净天空筛选整理自shivanisinghss2110大神的英文原创作品 Matplotlib.axis.XAxis.set_tick_params() in Python。非经特殊声明,原始代码版权归原作者所有,本译文未经允许或授权,请勿转载或复制。
