Matplotlib是Python中的一个库,它是数字的-NumPy库的数学扩展。它是Python中令人惊叹的可视化库,用于数组的2D图,并用于与更广泛的SciPy堆栈配合使用。
Matplotlib.axis.Axis.set()函数
matplotlib库的轴模块中的Axis.set()函数是属性批处理设置程序。传递kwarg设置属性。
用法: Axis.set(self, **kwargs)
参数:此方法不接受除** kwargs之外的任何参数。
返回值:此方法不返回任何值。
以下示例说明了matplotlib.axis中的matplotlib.axis.Axis.set()函数:
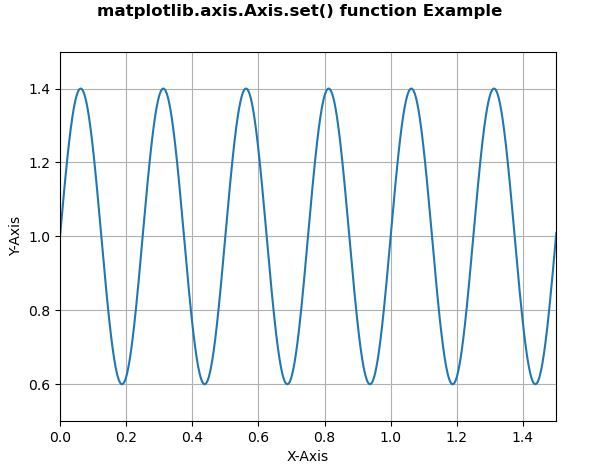
范例1:
Python3
# Implementation of matplotlib function
from matplotlib.axis import Axis
import matplotlib
import matplotlib.pyplot as plt
import numpy as np


t = np.arange(0.0, 2, 0.001)
s = 1 + np.sin(8 * np.pi * t)*0.4

fig, ax = plt.subplots()
ax.plot(t, s)

Axis.set(ax, xlabel ='X-Axis', ylabel ='Y-Axis',
    xlim =(0, 1.5), ylim =(0.5, 1.5))

ax.grid()

fig.suptitle('matplotlib.axis.Axis.set() \
function Example\n', fontweight ="bold")

plt.show()
输出:
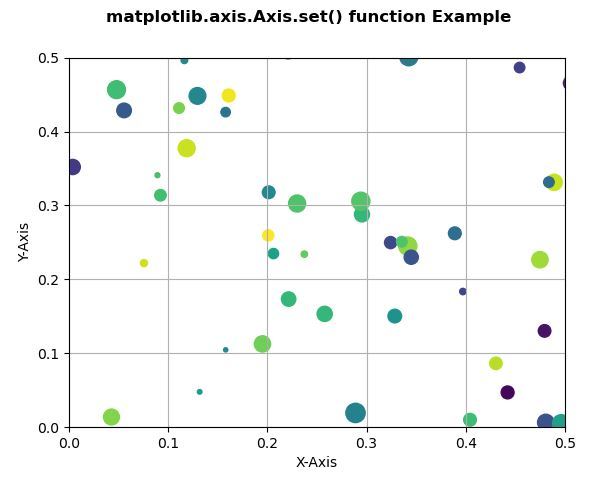
范例2:
Python3
# Implementation of matplotlib function
from matplotlib.axis import Axis
import numpy as np
import matplotlib.pyplot as plt
np.random.seed(19680801)


fig, ax = plt.subplots()

x, y, s, c = np.random.rand(4, 200)
s *= 200

ax.scatter(x, y, s, c)

Axis.set(ax, xlabel ='X-Axis', ylabel ='Y-Axis',
   xlim =(0, 0.5), ylim =(0, 0.5))

ax.grid()

fig.suptitle('matplotlib.axis.Axis.set() \
function Example\n', fontweight ="bold")

plt.show()
输出:
相关用法
- Python Wand function()用法及代码示例
- Python now()用法及代码示例
- Python map()用法及代码示例
- Python ord()用法及代码示例
- Python hex()用法及代码示例
- Python tell()用法及代码示例
- Python int()用法及代码示例
- Python oct()用法及代码示例
- Python id()用法及代码示例
- Python cmp()用法及代码示例
- Python str()用法及代码示例
- Python dir()用法及代码示例
- Python sum()用法及代码示例
- Python property()用法及代码示例
- Python format()用法及代码示例
- Python range()用法及代码示例
注:本文由纯净天空筛选整理自SHUBHAMSINGH10大神的英文原创作品 Matplotlib.axis.Axis.set() function in Python。非经特殊声明,原始代码版权归原作者所有,本译文未经允许或授权,请勿转载或复制。