Matplotlib是Python中的一个库,它是数字的-NumPy库的数学扩展。它是Python中令人惊叹的可视化库,用于数组的2D图,并用于与更广泛的SciPy堆栈配合使用。
matplotlib.axis.Axis.properties()函数
matplotlib库的axis模块中的Axis.properties()函数用于获取艺术家所有属性的字典。
用法: Axis.properties(self)
参数:此方法不接受任何参数。
返回值:此方法返回艺术家所有属性的字典。
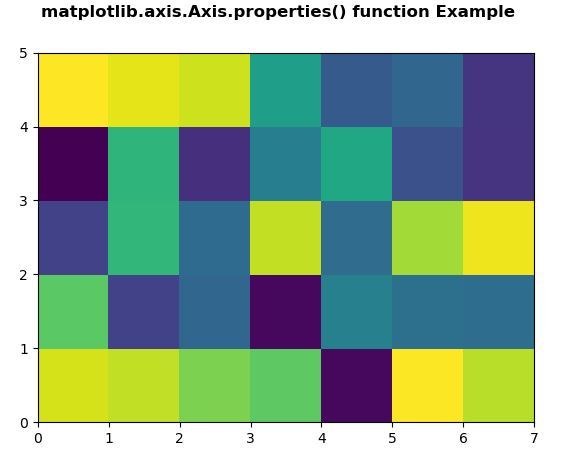
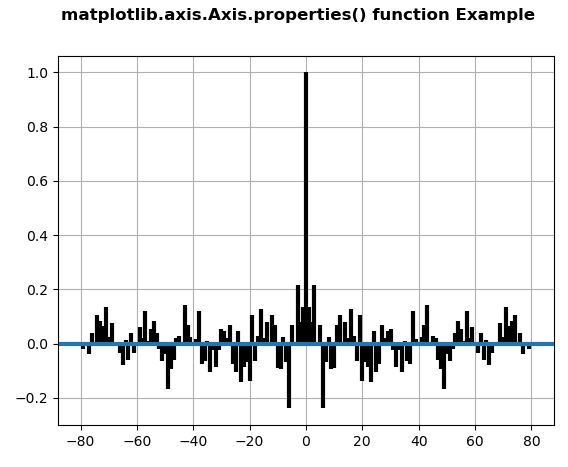
以下示例说明了matplotlib.axis中的matplotlib.axis.Axis.properties()函数:
范例1:
Python3
# Implementation of matplotlib function
from matplotlib.axis import Axis
import numpy as np
import matplotlib.pyplot as plt


xx = np.random.rand(5, 7)

fig, ax = plt.subplots()

m = ax.pcolor(xx)
m.set_zorder(2)

w = Axis.properties(ax)
print("Display all Properties\n")
for i in w:
    print(i, ":", w[i])

fig.suptitle('matplotlib.axis.Axis.properties() \
function Example\n', fontweight ="bold")

plt.show()
输出:

Display all Properties
adjustable:box
agg_filter:None
alpha:None
anchor:C
animated:False
aspect:auto
autoscale_on:True
autoscalex_on:True
autoscaley_on:True
axes_locator:None
axisbelow:line
children:[<matplotlib.collections.PolyCollection object at 0x098F9810>, <matplotlib.spines.Spine object at 0x087152B0>, <matplotlib.spines.Spine object at 0x08715350>, <matplotlib.spines.Spine object at 0x087153F0>, <matplotlib.spines.Spine object at 0x08715490>, <matplotlib.axis.XAxis object at 0x08715230>, <matplotlib.axis.YAxis object at 0x08715710>, Text(0.5, 1.0, ”), Text(0.0, 1.0, ”), Text(1.0, 1.0, ”), <matplotlib.patches.Rectangle object at 0x0873B150>]
clip_box:None
clip_on:True
clip_path:None
contains:None
data_ratio:0.7142857142857143
default_bbox_extra_artists:[<matplotlib.collections.PolyCollection object at 0x098F9810>, <matplotlib.spines.Spine object at 0x087152B0>,<matplotlib.spines.Spine object at 0x08715350>, <matplotlib.spines.Spine object at 0x087153F0>, <matplotlib.spines.Spine object at 0x08715490>, <matplotlib.axis.XAxis object at 0x08715230>, <matplotlib.axis.YAxis object at 0x08715710>, Text(0.5, 1.0, ”), Text(0.0, 1.0, ”), Text(1.0, 1.0, ”), <matplotlib.patches.Rectangle object at 0x0873B150>]
facecolor:(1.0, 1.0, 1.0, 1.0)
fc:(1.0, 1.0, 1.0, 1.0)
figure:Figure(640×480)
frame_on:True
geometry:(1, 1, 1)
gid:None
gridspec:GridSpec(1, 1)
images:<a list of 0 AxesImage objects>
in_layout:True
label:
legend:None
legend_handles_labels:([], [])
lines:<a list of 0 Line2D objects>
navigate:True
navigate_mode:None
path_effects:[]
picker:None
position:Bbox(x0=0.125, y0=0.10999999999999999, x1=0.9, y1=0.88)
rasterization_zorder:None
rasterized:None
renderer_cache:None
shared_x_axes:<matplotlib.cbook.Grouper object at 0x085CE210>
shared_y_axes:<matplotlib.cbook.Grouper object at 0x085CE270>
sketch_params:None
snap:None
subplotspec:<matplotlib.gridspec.SubplotSpec object at 0x079122B0>
title:
transform:IdentityTransform()
transformed_clip_path_and_affine:(None, None)
url:None
visible:True
window_extent:TransformedBbox(
Bbox(x0=0.125, y0=0.10999999999999999, x1=0.9, y1=0.88),
BboxTransformTo(
TransformedBbox(
Bbox(x0=0.0, y0=0.0, x1=6.4, y1=4.8),
Affine2D(
[[100. 0. 0.]
[ 0. 100. 0.]
[ 0. 0. 1.]]))))
xaxis:XAxis(80.0,52.8)
xaxis_transform:BlendedGenericTransform(
CompositeGenericTransform(
TransformWrapper(
BlendedAffine2D(
IdentityTransform(),
IdentityTransform())),
CompositeGenericTransform(
BboxTransformFrom(
TransformedBbox(
Bbox(x0=0.0, y0=0.0, x1=7.0, y1=5.0),
TransformWrapper(
BlendedAffine2D(
IdentityTransform(),
IdentityTransform())))),
BboxTransformTo(
TransformedBbox(
Bbox(x0=0.125, y0=0.10999999999999999, x1=0.9, y1=0.88),
BboxTransformTo(
TransformedBbox(
Bbox(x0=0.0, y0=0.0, x1=6.4, y1=4.8),
Affine2D(
[[100. 0. 0.]
[ 0. 100. 0.]
[ 0. 0. 1.]]))))))),
BboxTransformTo(
TransformedBbox(
Bbox(x0=0.125, y0=0.10999999999999999, x1=0.9, y1=0.88),
BboxTransformTo(
TransformedBbox(
Bbox(x0=0.0, y0=0.0, x1=6.4, y1=4.8),
Affine2D(
[[100. 0. 0.]
[ 0. 100. 0.]
[ 0. 0. 1.]]))))))
xbound:(0.0, 7.0)
xgridlines:<a list of 8 Line2D gridline objects>
xlabel:
xlim:(0.0, 7.0)
xmajorticklabels:<a list of 8 Text major ticklabel objects>
xminorticklabels:<a list of 0 Text minor ticklabel objects>
xscale:linear
xticklabels:<a list of 8 Text major ticklabel objects>
xticklines:<a list of 16 Line2D ticklines objects>
xticks:[0. 1. 2. 3. 4. 5. 6. 7.]
yaxis:YAxis(80.0,52.8)
yaxis_transform:BlendedGenericTransform(
BboxTransformTo(
TransformedBbox(
Bbox(x0=0.125, y0=0.10999999999999999, x1=0.9, y1=0.88),
BboxTransformTo(
TransformedBbox(
Bbox(x0=0.0, y0=0.0, x1=6.4, y1=4.8),
Affine2D(
[[100. 0. 0.]
[ 0. 100. 0.]
[ 0. 0. 1.]]))))),
CompositeGenericTransform(
TransformWrapper(
BlendedAffine2D(
IdentityTransform(),
IdentityTransform())),
CompositeGenericTransform(
BboxTransformFrom(
TransformedBbox(
Bbox(x0=0.0, y0=0.0, x1=7.0, y1=5.0),
TransformWrapper(
BlendedAffine2D(
IdentityTransform(),
IdentityTransform())))),
BboxTransformTo(
TransformedBbox(
Bbox(x0=0.125, y0=0.10999999999999999, x1=0.9, y1=0.88),
BboxTransformTo(
TransformedBbox(
Bbox(x0=0.0, y0=0.0, x1=6.4, y1=4.8),
Affine2D(
[[100. 0. 0.]
[ 0. 100. 0.]
[ 0. 0. 1.]]))))))))
ybound:(0.0, 5.0)
ygridlines:<a list of 6 Line2D gridline objects>
ylabel:
ylim:(0.0, 5.0)
ymajorticklabels:<a list of 6 Text major ticklabel objects>
yminorticklabels:<a list of 0 Text minor ticklabel objects>
yscale:linear
yticklabels:<a list of 6 Text major ticklabel objects>
yticklines:<a list of 12 Line2D ticklines objects>
yticks:[0. 1. 2. 3. 4. 5.]
zorder:0
范例2:
Python3
# Implementation of matplotlib function
from matplotlib.axis import Axis
import matplotlib.pyplot as plt
import numpy as np


np.random.seed(10**7)
geeks = np.random.randn(100)

fig, ax = plt.subplots()
ax.acorr(geeks, usevlines = True,
         normed = True,
         maxlags = 80, lw = 3)

ax.grid(True)

w = Axis.properties(ax)
print("Display all Properties\n")
for i in w:
    print(i, ":", w[i])

fig.suptitle('matplotlib.axis.Axis.properties() \
function Example\n', fontweight ="bold")

plt.show()
输出:

Display all Properties
adjustable:box
agg_filter:None
alpha:None
anchor:C
animated:False
aspect:auto
autoscale_on:True
autoscalex_on:True
autoscaley_on:True
axes_locator:None
axisbelow:line
children:[<matplotlib.collections.LineCollection object at 0x0AAFA810>, <matplotlib.lines.Line2D object at 0x0AAFA7F0>, <matplotlib.spines.Spine object at 0x081762D0>, <matplotlib.spines.Spine object at 0x08176370>, <matplotlib.spines.Spine object at 0x08176410>, <matplotlib.spines.Spine object at 0x081764B0>, <matplotlib.axis.XAxis object at 0x08176250>, <matplotlib.axis.YAxis object at 0x081766F0>, Text(0.5, 1.0, ”), Text(0.0, 1.0, ”), Text(1.0, 1.0, ”), <matplotlib.patches.Rectangle object at 0x0819D130>]
clip_box:None
clip_on:True
clip_path:None
contains:None
data_ratio:0.007741698372824119
default_bbox_extra_artists:[<matplotlib.collections.LineCollection object at 0x0AAFA810>, <matplotlib.lines.Line2D object at 0x0AAFA7F0>, <matplotlib.spines.Spine object at 0x081762D0>, <matplotlib.spines.Spine object at 0x08176370>, <matplotlib.spines.Spine object at 0x08176410>, <matplotlib.spines.Spine object at 0x081764B0>, <matplotlib.axis.XAxis object at 0x08176250>, <matplotlib.axis.YAxis object at 0x081766F0>, Text(0.5, 1.0, ”), Text(0.0, 1.0, ”), Text(1.0, 1.0, ”), <matplotlib.patches.Rectangle object at 0x0819D130>]
facecolor:(1.0, 1.0, 1.0, 1.0)
fc:(1.0, 1.0, 1.0, 1.0)
figure:Figure(640×480)
frame_on:True
geometry:(1, 1, 1)
gid:None
gridspec:GridSpec(1, 1)
images:<a list of 0 AxesImage objects>
in_layout:True
label:
legend:None
legend_handles_labels:([], [])
lines:<a list of 1 Line2D objects>
navigate:True
navigate_mode:None
path_effects:[]
picker:None
position:Bbox(x0=0.125, y0=0.10999999999999999, x1=0.9, y1=0.88)
rasterization_zorder:None
rasterized:None
renderer_cache:None
shared_x_axes:<matplotlib.cbook.Grouper object at 0x0802E210>
shared_y_axes:<matplotlib.cbook.Grouper object at 0x0802E270>
sketch_params:None
snap:None
subplotspec:<matplotlib.gridspec.SubplotSpec object at 0x073722F0>
title:
transform:IdentityTransform()
transformed_clip_path_and_affine:(None, None)
url:None
visible:True
window_extent:TransformedBbox(
Bbox(x0=0.125, y0=0.10999999999999999, x1=0.9, y1=0.88),
BboxTransformTo(
TransformedBbox(
Bbox(x0=0.0, y0=0.0, x1=6.4, y1=4.8),
Affine2D(
[[100. 0. 0.]
[ 0. 100. 0.]
[ 0. 0. 1.]]))))
xaxis:XAxis(80.0,52.8)
xaxis_transform:BlendedGenericTransform(
CompositeGenericTransform(
TransformWrapper(
BlendedAffine2D(
IdentityTransform(),
IdentityTransform())),
CompositeGenericTransform(
BboxTransformFrom(
TransformedBbox(
Bbox(x0=-88.0, y0=-0.300605326634452, x1=88.0, y1=1.061933586982593),
TransformWrapper(
BlendedAffine2D(
IdentityTransform(),
IdentityTransform())))),
BboxTransformTo(
TransformedBbox(
Bbox(x0=0.125, y0=0.10999999999999999, x1=0.9, y1=0.88),
BboxTransformTo(
TransformedBbox(
Bbox(x0=0.0, y0=0.0, x1=6.4, y1=4.8),
Affine2D(
[[100. 0. 0.]
[ 0. 100. 0.]
[ 0. 0. 1.]]))))))),
BboxTransformTo(
TransformedBbox(
Bbox(x0=0.125, y0=0.10999999999999999, x1=0.9, y1=0.88),
BboxTransformTo(
TransformedBbox(
Bbox(x0=0.0, y0=0.0, x1=6.4, y1=4.8),
Affine2D(
[[100. 0. 0.]
[ 0. 100. 0.]
[ 0. 0. 1.]]))))))
xbound:(-88.0, 88.0)
xgridlines:<a list of 11 Line2D gridline objects>
xlabel:
xlim:(-88.0, 88.0)
xmajorticklabels:<a list of 11 Text major ticklabel objects>
xminorticklabels:<a list of 0 Text minor ticklabel objects>
xscale:linear
xticklabels:<a list of 11 Text major ticklabel objects>
xticklines:<a list of 22 Line2D ticklines objects>
xticks:[-100. -80. -60. -40. -20. 0. 20. 40. 60. 80. 100.]
yaxis:YAxis(80.0,52.8)
yaxis_transform:BlendedGenericTransform(
BboxTransformTo(
TransformedBbox(
Bbox(x0=0.125, y0=0.10999999999999999, x1=0.9, y1=0.88),
BboxTransformTo(
TransformedBbox(
Bbox(x0=0.0, y0=0.0, x1=6.4, y1=4.8),
Affine2D(
[[100. 0. 0.]
[ 0. 100. 0.]
[ 0. 0. 1.]]))))),
CompositeGenericTransform(
TransformWrapper(
BlendedAffine2D(
IdentityTransform(),
IdentityTransform())),
CompositeGenericTransform(
BboxTransformFrom(
TransformedBbox(
Bbox(x0=-88.0, y0=-0.300605326634452, x1=88.0, y1=1.061933586982593),
TransformWrapper(
BlendedAffine2D(
IdentityTransform(),
IdentityTransform())))),
BboxTransformTo(
TransformedBbox(
Bbox(x0=0.125, y0=0.10999999999999999, x1=0.9, y1=0.88),
BboxTransformTo(
TransformedBbox(
Bbox(x0=0.0, y0=0.0, x1=6.4, y1=4.8),
Affine2D(
[[100. 0. 0.]
[ 0. 100. 0.]
[ 0. 0. 1.]]))))))))
ybound:(-0.300605326634452, 1.061933586982593)
ygridlines:<a list of 9 Line2D gridline objects>
ylabel:
ylim:(-0.300605326634452, 1.061933586982593)
ymajorticklabels:<a list of 9 Text major ticklabel objects>
yminorticklabels:<a list of 0 Text minor ticklabel objects>
yscale:linear
yticklabels:<a list of 9 Text major ticklabel objects>
yticklines:<a list of 18 Line2D ticklines objects>
yticks:[-0.4 -0.2 0. 0.2 0.4 0.6 0.8 1. 1.2]
zorder:0
相关用法
- Python Wand function()用法及代码示例
- Python oct()用法及代码示例
- Python now()用法及代码示例
- Python cmp()用法及代码示例
- Python dir()用法及代码示例
- Python hex()用法及代码示例
- Python id()用法及代码示例
- Python sum()用法及代码示例
- Python ord()用法及代码示例
- Python map()用法及代码示例
- Python int()用法及代码示例
- Python str()用法及代码示例
- Python tell()用法及代码示例
- Python __import__()用法及代码示例
- Python numpy.cov()用法及代码示例
- Python Wand arc()用法及代码示例
注:本文由纯净天空筛选整理自SHUBHAMSINGH10大神的英文原创作品 Matplotlib.axis.Axis.properties() function in Python。非经特殊声明,原始代码版权归原作者所有,本译文未经允许或授权,请勿转载或复制。
