本文簡要介紹 python 語言中 scipy.stats.shapiro 的用法。
用法:
scipy.stats.shapiro(x)#執行Shapiro-Wilk 正態性檢驗。
Shapiro-Wilk 檢驗檢驗數據來自正態分布的原假設。
- x: array_like
樣本數據數組。
- statistic: 浮點數
檢驗統計量。
- p-value: 浮點數
假設檢驗的 p 值。
參數 ::
返回 ::
注意:
所使用的算法在[4]中進行了說明,但所說明的審查參數並未實現。對於 N > 5000,W 檢驗統計量準確,但 p 值可能不準確。
參考:
[2] (1,2)Shapiro, S. S. & Wilk, M.B,“正態性方差檢驗分析(完整樣本)”,Biometrika,1965 年,第 1 卷。 52,第 591-611 頁,DOI:10.2307/2333709
[3]Razali, N. M. 和 Wah, Y. B.,“Shapiro-Wilk、Kolmogorov-Smirnov、Lilliefors 和 Anderson-Darling 測試的功效比較”,《統計建模與分析雜誌》,2011 年,第 1 卷。 2,第 21-33 頁。
[4]Royston P.,“備注 AS R94:對算法 AS 181 的備注:正態性的 W-test”,1995 年,應用統計學,卷。 44、DOI:10.2307/2986146
[5]Phipson B. 和 Smyth, G. K.,“排列 P 值不應該為零:隨機繪製排列時計算精確的 P 值”,遺傳學和分子生物學中的統計應用,2010 年,第 9 卷,DOI:10.2202/1544-6115.1585
[6]Panagiotakos, D. B.,“p 值在生物醫學研究中的值”,開放心血管醫學雜誌,2008 年,第 2 卷,第 97-99 頁,DOI:10.2174/1874192400802010097
例子:
假設我們希望從測量中推斷醫學研究中成年男性的體重是否不服從正態分布 [2]。重量(磅)記錄在下麵的數組
x中。>>> import numpy as np >>> x = np.array([148, 154, 158, 160, 161, 162, 166, 170, 182, 195, 236])[1] 和 [2] 的正態性檢驗首先根據觀測值與正態分布的預期階統計量之間的關係計算統計量。
>>> from scipy import stats
>>> res = stats.shapiro(x)
>>> res.statistic
0.7888147830963135
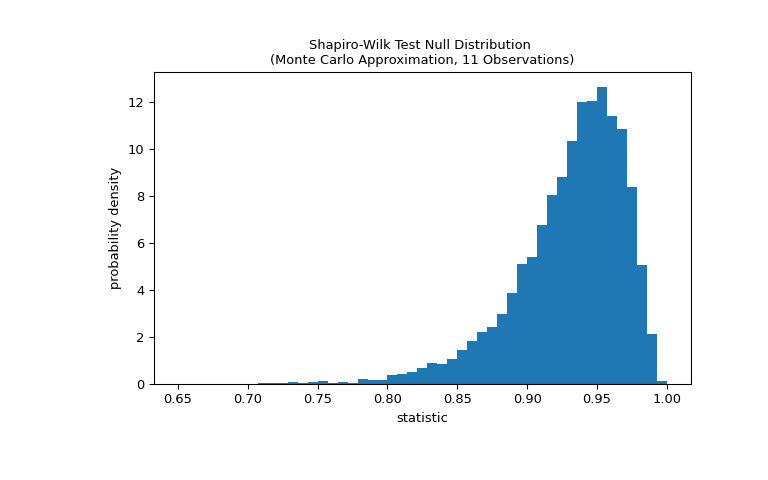
對於從正態分布中抽取的樣本,此統計量的值往往較高(接近 1)。
通過將統計量的觀察值與零分布進行比較來執行檢驗:零分布是在權重從正態分布中得出的零假設下形成的統計值的分布。對於這種正態性檢驗,零分布不容易準確計算,因此通常采用蒙特卡羅方法來近似,即從正態分布中抽取許多與
x大小相同的樣本並計算統計量的值對於每個。>>> def statistic(x): ... # Get only the `shapiro` statistic; ignore its p-value ... return stats.shapiro(x).statistic >>> ref = stats.monte_carlo_test(x, stats.norm.rvs, statistic, ... alternative='less') >>> import matplotlib.pyplot as plt >>> fig, ax = plt.subplots(figsize=(8, 5)) >>> bins = np.linspace(0.65, 1, 50) >>> def plot(ax): # we'll re-use this ... ax.hist(ref.null_distribution, density=True, bins=bins) ... ax.set_title("Shapiro-Wilk Test Null Distribution \n" ... "(Monte Carlo Approximation, 11 Observations)") ... ax.set_xlabel("statistic") ... ax.set_ylabel("probability density") >>> plot(ax) >>> plt.show()
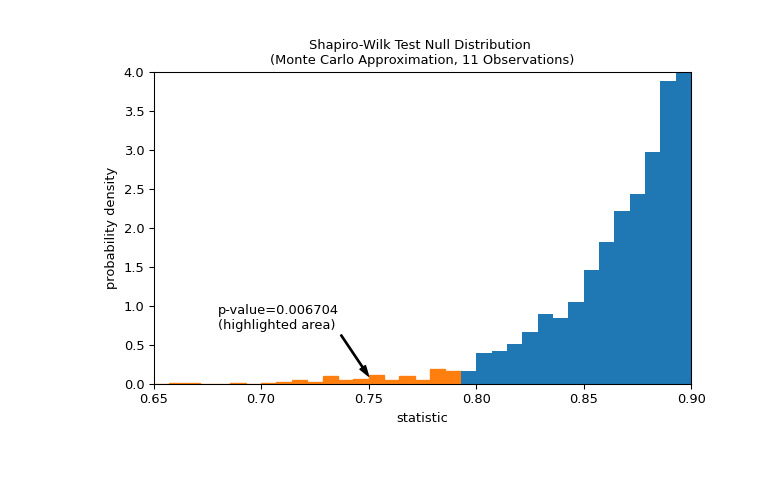
比較通過 p 值進行量化:零分布中小於或等於統計觀測值的值的比例。
>>> fig, ax = plt.subplots(figsize=(8, 5))
>>> plot(ax)
>>> annotation = (f'p-value={res.pvalue:.6f}\n(highlighted area)')
>>> props = dict(facecolor='black', width=1, headwidth=5, headlength=8)
>>> _ = ax.annotate(annotation, (0.75, 0.1), (0.68, 0.7), arrowprops=props)
>>> i_extreme = np.where(bins <= res.statistic)[0]
>>> for i in i_extreme:
...     ax.patches[i].set_color('C1')
>>> plt.xlim(0.65, 0.9)
>>> plt.ylim(0, 4)
>>> plt.show
>>> res.pvalue
0.006703833118081093
如果 p 值為 “small” - 也就是說,如果從正態分布總體中采樣數據產生統計數據的極值的概率較低 - 這可以作為反對零假設的證據另一種選擇:權重不是從正態分布中得出的。注意:
反之則不成立;也就是說,檢驗不用於為原假設提供證據。
將被視為 “small” 的值的閾值是在分析數據之前應做出的選擇 [5],同時考慮誤報(錯誤地拒絕原假設)和漏報(未能拒絕假設)的風險。錯誤的原假設)。

相關用法
- Python SciPy stats.skewnorm用法及代碼示例
- Python SciPy stats.semicircular用法及代碼示例
- Python SciPy stats.skellam用法及代碼示例
- Python scipy.stats.somersd用法及代碼示例
- Python SciPy stats.sem用法及代碼示例
- Python SciPy stats.siegelslopes用法及代碼示例
- Python SciPy stats.skewcauchy用法及代碼示例
- Python SciPy stats.scoreatpercentile用法及代碼示例
- Python SciPy stats.skew用法及代碼示例
- Python SciPy stats.spearmanr用法及代碼示例
- Python SciPy stats.studentized_range用法及代碼示例
- Python SciPy stats.sigmaclip用法及代碼示例
- Python SciPy stats.skewtest用法及代碼示例
- Python SciPy stats.special_ortho_group用法及代碼示例
- Python SciPy stats.sobol_indices用法及代碼示例
- Python SciPy stats.anderson用法及代碼示例
- Python SciPy stats.iqr用法及代碼示例
- Python SciPy stats.genpareto用法及代碼示例
- Python SciPy stats.cosine用法及代碼示例
- Python SciPy stats.norminvgauss用法及代碼示例
- Python SciPy stats.directional_stats用法及代碼示例
- Python SciPy stats.invwishart用法及代碼示例
- Python SciPy stats.bartlett用法及代碼示例
- Python SciPy stats.levy_stable用法及代碼示例
- Python SciPy stats.page_trend_test用法及代碼示例
注:本文由純淨天空篩選整理自scipy.org大神的英文原創作品 scipy.stats.shapiro。非經特殊聲明,原始代碼版權歸原作者所有,本譯文未經允許或授權,請勿轉載或複製。
