本文简要介绍 python 语言中 scipy.stats.gaussian_kde 的用法。
用法:
class scipy.stats.gaussian_kde(dataset, bw_method=None, weights=None)#使用高斯核表示 kernel-density 估计。
核密度估计是一种以非参数方式估计随机变量的概率密度函数(PDF)的方法。
gaussian_kde适用于 uni-variate 和 multi-variate 数据。它包括自动带宽确定。该估计最适合单峰分布;双峰或 multi-modal 分布往往会过度平滑。- dataset: array_like
要估计的数据点。在单变量数据的情况下,这是一个一维数组,否则是一个具有形状(# of dims,# of data)的二维数组。
- bw_method: str,标量或可调用,可选
用于计算估计器带宽的方法。这可以是‘scott’, ‘silverman’、标量常量或可调用对象。如果是标量,这将直接用作kde.factor.如果是可调用的,它应该需要一个
gaussian_kde实例作为唯一参数并返回一个标量。如果无(默认),则使用‘scott’。有关详细信息,请参阅注释。- weights: 数组,可选
数据点的权重。这必须与数据集的形状相同。如果 None (默认),则假定样本的权重相同
参数 ::
注意:
带宽选择强烈影响从 KDE 获得的估计(比内核的实际形状影响更大)。带宽选择可以通过“rule of thumb”、交叉验证、“插件方法”或其他方式来完成;评论见[3]、[4]。
gaussian_kde使用经验法则,默认为斯科特规则。斯科特规则 [1],实现为
scotts_factor,是:n**(-1./(d+4)),n是数据点的数量,d是维度的数量。在权重不相等的点的情况下,scotts_factor变为:neff**(-1./(d+4)),neff为有效数据点数量。西尔弗曼规则 [2],实现为silverman_factor,是:(n * (d + 2) / 4.)**(-1. / (d + 4)).或者在权重不相等的情况下:
(neff * (d + 2) / 4.)**(-1. / (d + 4)).核密度估计的一般说明可以在 [1] 和 [2] 中找到,这种多维实现的数学可以在 [1] 中找到。
使用一组加权样本,数据点
neff的有效数量由下式定义:neff = sum(weights)^2 / sum(weights^2)详见[5]。
gaussian_kde当前不支持位于其表达空间的 lower-dimensional 子空间中的数据。对于此类数据,请考虑执行主成分分析/降维并对转换后的数据使用gaussian_kde。参考:
[1] (1,2,3)D.W. Scott,“多元密度估计:理论、实践和可视化”,John Wiley & Sons,纽约,奇斯特,1992 年。
[2] (1,2)BW西尔弗曼,“统计和数据分析的密度估计”,卷。 26,统计和应用概率专着,查普曼和霍尔,伦敦,1986 年。
[3]学士学位Turlach,“核密度估计中的带宽选择:回顾”,CORE 和 Institut de Statistique,Vol。 19,第 1-33 页,1993 年。
[4]D.M.巴什坦尼克和 R.J. Hyndman,“核条件密度估计的带宽选择”,计算统计与数据分析,卷。 36,第 279-298 页,2001 年。
[5]Gray P.G.,1969 年,皇家统计学会杂志。系列 A(一般)、132、272
例子:
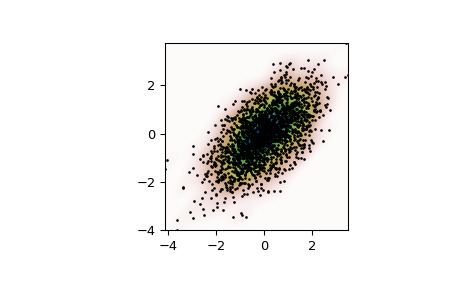
生成一些随机的二维数据:
>>> import numpy as np
>>> from scipy import stats
>>> def measure(n):
...     "Measurement model, return two coupled measurements."
...     m1 = np.random.normal(size=n)
...     m2 = np.random.normal(scale=0.5, size=n)
...     return m1+m2, m1-m2
>>> m1, m2 = measure(2000) >>> xmin = m1.min() >>> xmax = m1.max() >>> ymin = m2.min() >>> ymax = m2.max()对数据执行核密度估计:
>>> X, Y = np.mgrid[xmin:xmax:100j, ymin:ymax:100j]
>>> positions = np.vstack([X.ravel(), Y.ravel()])
>>> values = np.vstack([m1, m2])
>>> kernel = stats.gaussian_kde(values)
>>> Z = np.reshape(kernel(positions).T, X.shape)
绘制结果:
>>> import matplotlib.pyplot as plt
>>> fig, ax = plt.subplots()
>>> ax.imshow(np.rot90(Z), cmap=plt.cm.gist_earth_r,
...           extent=[xmin, xmax, ymin, ymax])
>>> ax.plot(m1, m2, 'k.', markersize=2)
>>> ax.set_xlim([xmin, xmax])
>>> ax.set_ylim([ymin, ymax])
>>> plt.show()
- dataset: ndarray
用于初始化
gaussian_kde的数据集。- d: int
维数。
- n: int
数据点的数量。
- neff: int
有效数据点数。
- factor: 浮点数
带宽因子,从 kde.covariance_factor 获得。 kde.factor的平方乘以kde估计中数据的协方差矩阵。
- covariance: ndarray
数据集的协方差矩阵,按计算的带宽 (kde.factor) 缩放。
- inv_cov: ndarray
协方差的倒数。
属性 ::
相关用法
- Python SciPy stats.gausshyper用法及代码示例
- Python SciPy stats.gamma用法及代码示例
- Python SciPy stats.genpareto用法及代码示例
- Python SciPy stats.gumbel_l用法及代码示例
- Python SciPy stats.gzscore用法及代码示例
- Python SciPy stats.gompertz用法及代码示例
- Python SciPy stats.genlogistic用法及代码示例
- Python SciPy stats.gennorm用法及代码示例
- Python SciPy stats.gibrat用法及代码示例
- Python SciPy stats.genhalflogistic用法及代码示例
- Python SciPy stats.gmean用法及代码示例
- Python scipy.stats.gilbrat用法及代码示例
- Python SciPy stats.geom用法及代码示例
- Python SciPy stats.genexpon用法及代码示例
- Python SciPy stats.gstd用法及代码示例
- Python SciPy stats.genhyperbolic用法及代码示例
- Python SciPy stats.gumbel_r用法及代码示例
- Python SciPy stats.gengamma用法及代码示例
- Python SciPy stats.goodness_of_fit用法及代码示例
- Python SciPy stats.genextreme用法及代码示例
- Python SciPy stats.geninvgauss用法及代码示例
- Python SciPy stats.anderson用法及代码示例
- Python SciPy stats.iqr用法及代码示例
- Python SciPy stats.skewnorm用法及代码示例
- Python SciPy stats.cosine用法及代码示例
注:本文由纯净天空筛选整理自scipy.org大神的英文原创作品 scipy.stats.gaussian_kde。非经特殊声明,原始代码版权归原作者所有,本译文未经允许或授权,请勿转载或复制。
