本文简要介绍 python 语言中 scipy.stats.gzscore 的用法。
用法:
scipy.stats.gzscore(a, *, axis=0, ddof=0, nan_policy='propagate')#计算几何标准分数。
计算样本中每个严格正值的几何 z 分数,相对于几何平均值和标准差。在数学上,几何 z 分数可以评估为:
gzscore = log(a/gmu) / log(gsigma)其中
gmu(resp.gsigma) 是几何平均值 (resp. 标准差)。- a: array_like
样本数据。
- axis: int 或无,可选
操作的轴。默认值为 0。如果没有,则计算整个数组 a。
- ddof: 整数,可选
计算标准偏差时的自由度校正。默认值为 0。
- nan_policy: {‘propagate’, ‘raise’, ‘omit’},可选
定义当输入包含 nan 时如何处理。 ‘propagate’ 返回 nan,‘raise’ 引发错误,‘omit’ 执行忽略 nan 值的计算。默认为‘propagate’。请注意,当值为 ‘omit’ 时,输入中的 nan 也会传播到输出,但它们不会影响为非 nan 值计算的几何 z 分数。
- gzscore: array_like
几何 z 分数,由输入数组 a 的几何平均值和几何标准差标准化。
参数 ::
返回 ::
注意:
此函数保留 ndarray 子类,也适用于矩阵和掩码数组(它使用
asanyarray而不是asarray作为参数)。参考:
[1]“Geometric standard score”,维基百科,https://en.wikipedia.org/wiki/Geometric_standard_deviation#Geometric_standard_score.
例子:
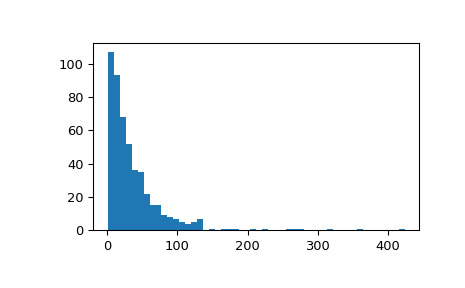
从 log-normal 分布中抽取样本:
>>> import numpy as np
>>> from scipy.stats import zscore, gzscore
>>> import matplotlib.pyplot as plt
>>> rng = np.random.default_rng() >>> mu, sigma = 3., 1. # mean and standard deviation >>> x = rng.lognormal(mu, sigma, size=500)显示样本的直方图:
>>> fig, ax = plt.subplots()
>>> ax.hist(x, 50)
>>> plt.show()
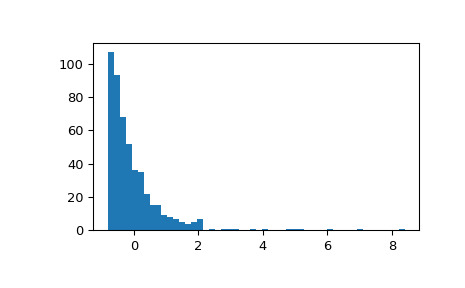
显示由经典 zscore 标准化的样本的直方图。分布被重新调整,但其形状保持不变。
>>> fig, ax = plt.subplots()
>>> ax.hist(zscore(x), 50)
>>> plt.show()
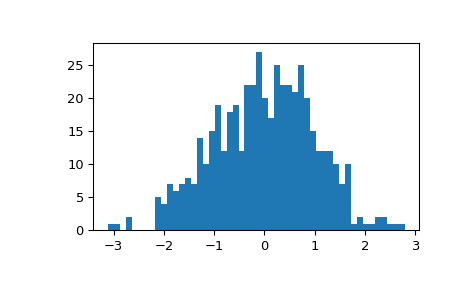
证明几何 zscores 的分布是重新缩放和准正态分布的:
>>> fig, ax = plt.subplots()
>>> ax.hist(gzscore(x), 50)
>>> plt.show()
相关用法
- Python SciPy stats.genpareto用法及代码示例
- Python SciPy stats.gumbel_l用法及代码示例
- Python SciPy stats.gompertz用法及代码示例
- Python SciPy stats.genlogistic用法及代码示例
- Python SciPy stats.gennorm用法及代码示例
- Python SciPy stats.gibrat用法及代码示例
- Python SciPy stats.genhalflogistic用法及代码示例
- Python SciPy stats.gmean用法及代码示例
- Python SciPy stats.gamma用法及代码示例
- Python scipy.stats.gilbrat用法及代码示例
- Python SciPy stats.geom用法及代码示例
- Python SciPy stats.genexpon用法及代码示例
- Python SciPy stats.gstd用法及代码示例
- Python SciPy stats.genhyperbolic用法及代码示例
- Python SciPy stats.gaussian_kde用法及代码示例
- Python SciPy stats.gumbel_r用法及代码示例
- Python SciPy stats.gausshyper用法及代码示例
- Python SciPy stats.gengamma用法及代码示例
- Python SciPy stats.goodness_of_fit用法及代码示例
- Python SciPy stats.genextreme用法及代码示例
- Python SciPy stats.geninvgauss用法及代码示例
- Python SciPy stats.anderson用法及代码示例
- Python SciPy stats.iqr用法及代码示例
- Python SciPy stats.skewnorm用法及代码示例
- Python SciPy stats.cosine用法及代码示例
注:本文由纯净天空筛选整理自scipy.org大神的英文原创作品 scipy.stats.gzscore。非经特殊声明,原始代码版权归原作者所有,本译文未经允许或授权,请勿转载或复制。
