躲避會在調整水平位置時保留幾何圖形的垂直位置。 position_dodge() 要求在全局或geom_* 層中指定分組變量。與 position_dodge() 不同,position_dodge2() 在層中無需分組變量即可工作。 position_dodge2() 適用於條形圖和矩形,但對於排列寬度可變的箱線圖特別有用。
用法
position_dodge(width = NULL, preserve = "total")

position_dodge2(
  width = NULL,
  preserve = "total",
  padding = 0.1,
  reverse = FALSE
)
參數
- width
-
當與單個元素的寬度不同時,躲避寬度。當您想要將狹窄的幾何圖形與較寬的幾何圖形對齊時,這非常有用。請參閱示例。
- preserve
-
躲避應該保留某個位置上所有元素的
"total"寬度,還是"single"元素的寬度? - padding
-
同一位置的元素之間的填充。元素按此比例縮小,以在它們之間留出空間。默認為 0.1。
- reverse
-
如果是
TRUE,將反轉默認的堆疊順序。如果您要旋轉繪圖和圖例,這非常有用。
也可以看看
其他位置調整:position_identity()、position_jitterdodge()、position_jitter()、position_nudge()、position_stack()
例子
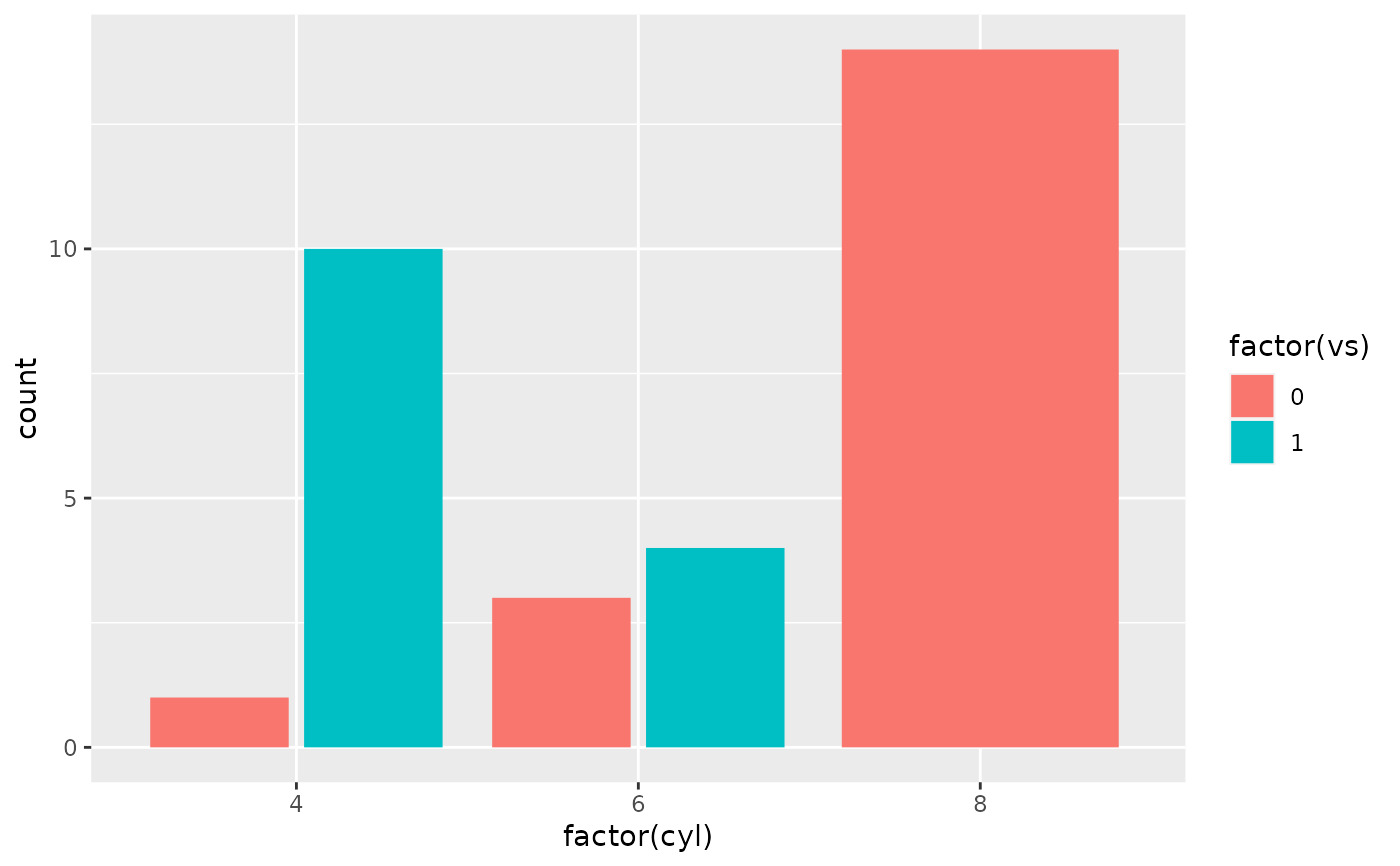
ggplot(mtcars, aes(factor(cyl), fill = factor(vs))) +
geom_bar(position = "dodge2")
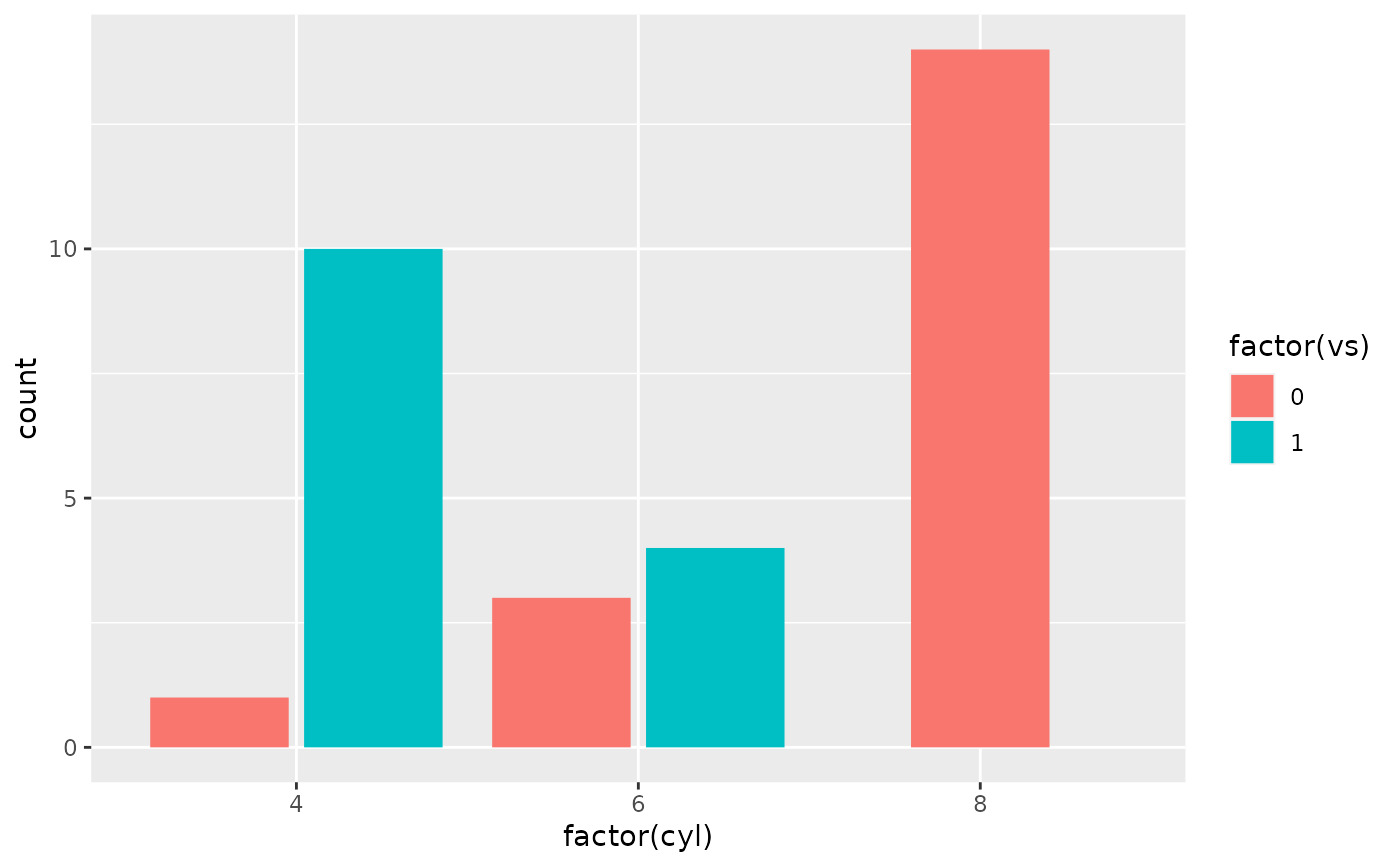
 # By default, dodging with `position_dodge2()` preserves the total width of
# the elements. You can choose to preserve the width of each element with:
ggplot(mtcars, aes(factor(cyl), fill = factor(vs))) +
geom_bar(position = position_dodge2(preserve = "single"))
# By default, dodging with `position_dodge2()` preserves the total width of
# the elements. You can choose to preserve the width of each element with:
ggplot(mtcars, aes(factor(cyl), fill = factor(vs))) +
geom_bar(position = position_dodge2(preserve = "single"))
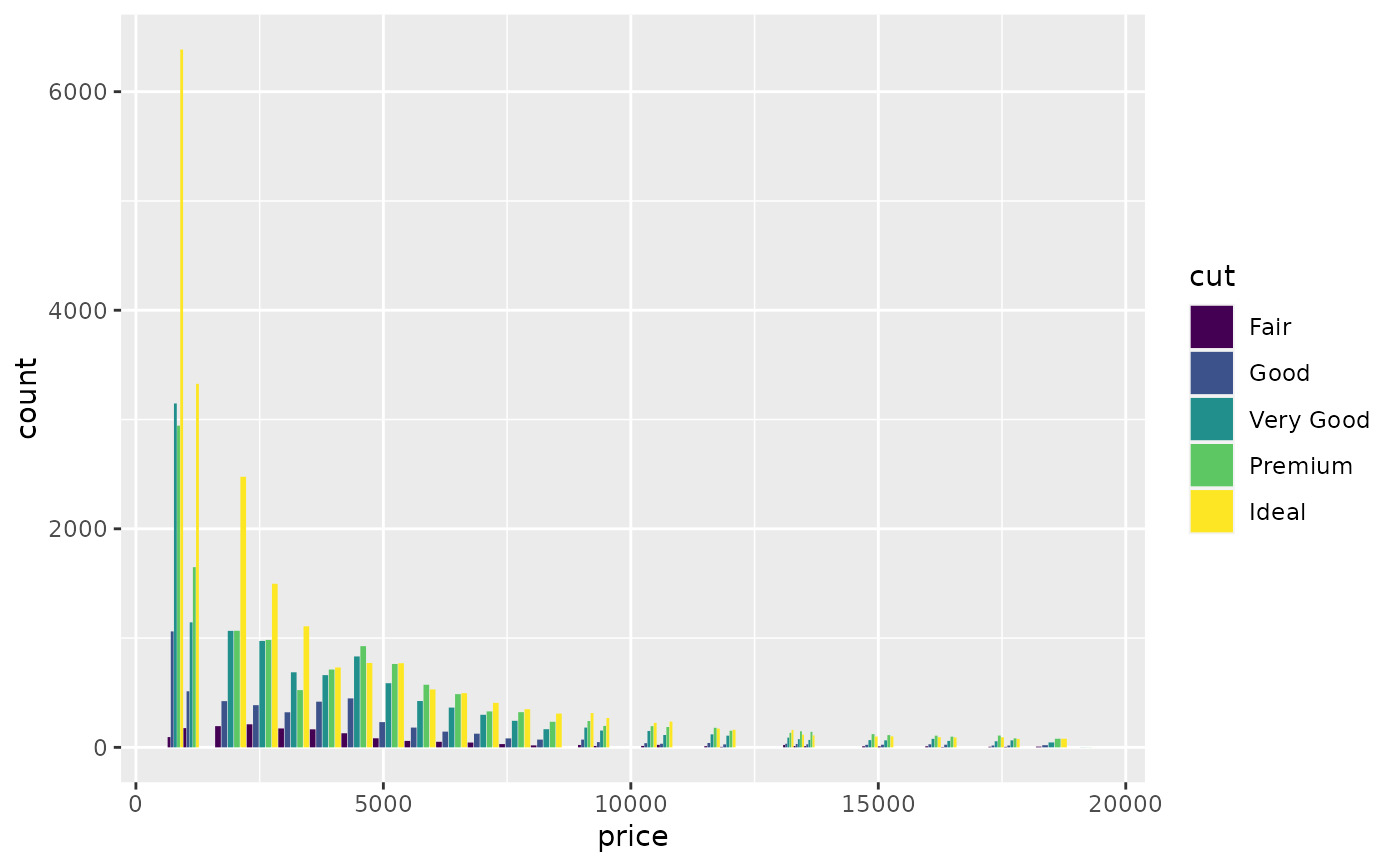
 # \donttest{
ggplot(diamonds, aes(price, fill = cut)) +
geom_histogram(position="dodge2")
#> `stat_bin()` using `bins = 30`. Pick better value with `binwidth`.
# \donttest{
ggplot(diamonds, aes(price, fill = cut)) +
geom_histogram(position="dodge2")
#> `stat_bin()` using `bins = 30`. Pick better value with `binwidth`.
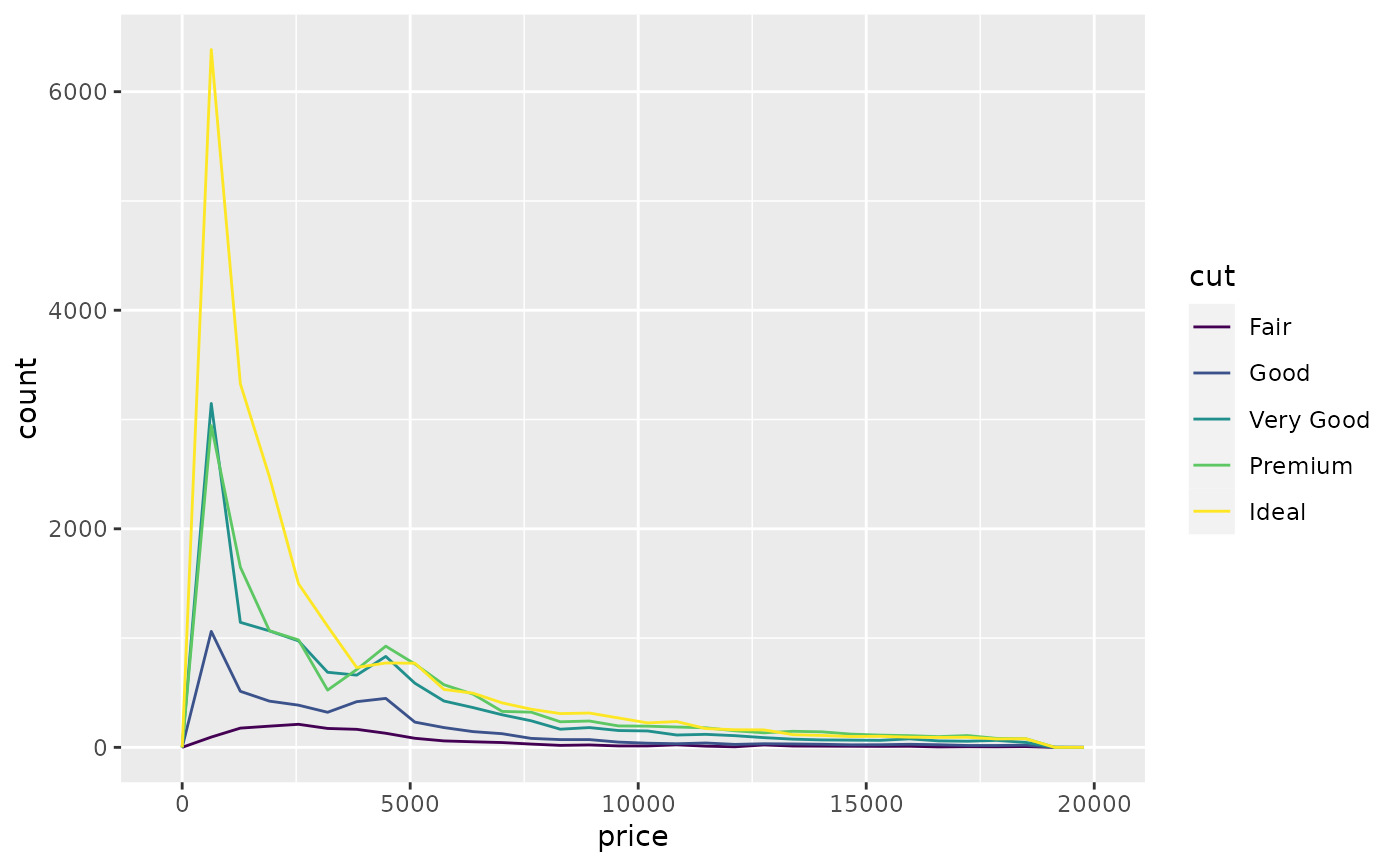
 # see ?geom_bar for more examples
# In this case a frequency polygon is probably a better choice
ggplot(diamonds, aes(price, colour = cut)) +
geom_freqpoly()
#> `stat_bin()` using `bins = 30`. Pick better value with `binwidth`.
# see ?geom_bar for more examples
# In this case a frequency polygon is probably a better choice
ggplot(diamonds, aes(price, colour = cut)) +
geom_freqpoly()
#> `stat_bin()` using `bins = 30`. Pick better value with `binwidth`.
 # }
# Dodging with various widths -------------------------------------
# To dodge items with different widths, you need to be explicit
df <- data.frame(
x = c("a","a","b","b"),
y = 2:5,
g = rep(1:2, 2)
)
p <- ggplot(df, aes(x, y, group = g)) +
geom_col(position = "dodge", fill = "grey50", colour = "black")
p
# }
# Dodging with various widths -------------------------------------
# To dodge items with different widths, you need to be explicit
df <- data.frame(
x = c("a","a","b","b"),
y = 2:5,
g = rep(1:2, 2)
)
p <- ggplot(df, aes(x, y, group = g)) +
geom_col(position = "dodge", fill = "grey50", colour = "black")
p
 # A line range has no width:
p + geom_linerange(aes(ymin = y - 1, ymax = y + 1), position = "dodge")
#> Warning: Width not defined
#> ℹ Set with `position_dodge(width = ...)`
# A line range has no width:
p + geom_linerange(aes(ymin = y - 1, ymax = y + 1), position = "dodge")
#> Warning: Width not defined
#> ℹ Set with `position_dodge(width = ...)`
 # So you must explicitly specify the width
p + geom_linerange(
aes(ymin = y - 1, ymax = y + 1),
position = position_dodge(width = 0.9)
)
# So you must explicitly specify the width
p + geom_linerange(
aes(ymin = y - 1, ymax = y + 1),
position = position_dodge(width = 0.9)
)
 # The same principle applies to error bars, which are usually
# narrower than the bars
p + geom_errorbar(
aes(ymin = y - 1, ymax = y + 1),
width = 0.2,
position = "dodge"
)
# The same principle applies to error bars, which are usually
# narrower than the bars
p + geom_errorbar(
aes(ymin = y - 1, ymax = y + 1),
width = 0.2,
position = "dodge"
)
 p + geom_errorbar(
aes(ymin = y - 1, ymax = y + 1),
width = 0.2,
position = position_dodge(width = 0.9)
)
p + geom_errorbar(
aes(ymin = y - 1, ymax = y + 1),
width = 0.2,
position = position_dodge(width = 0.9)
)
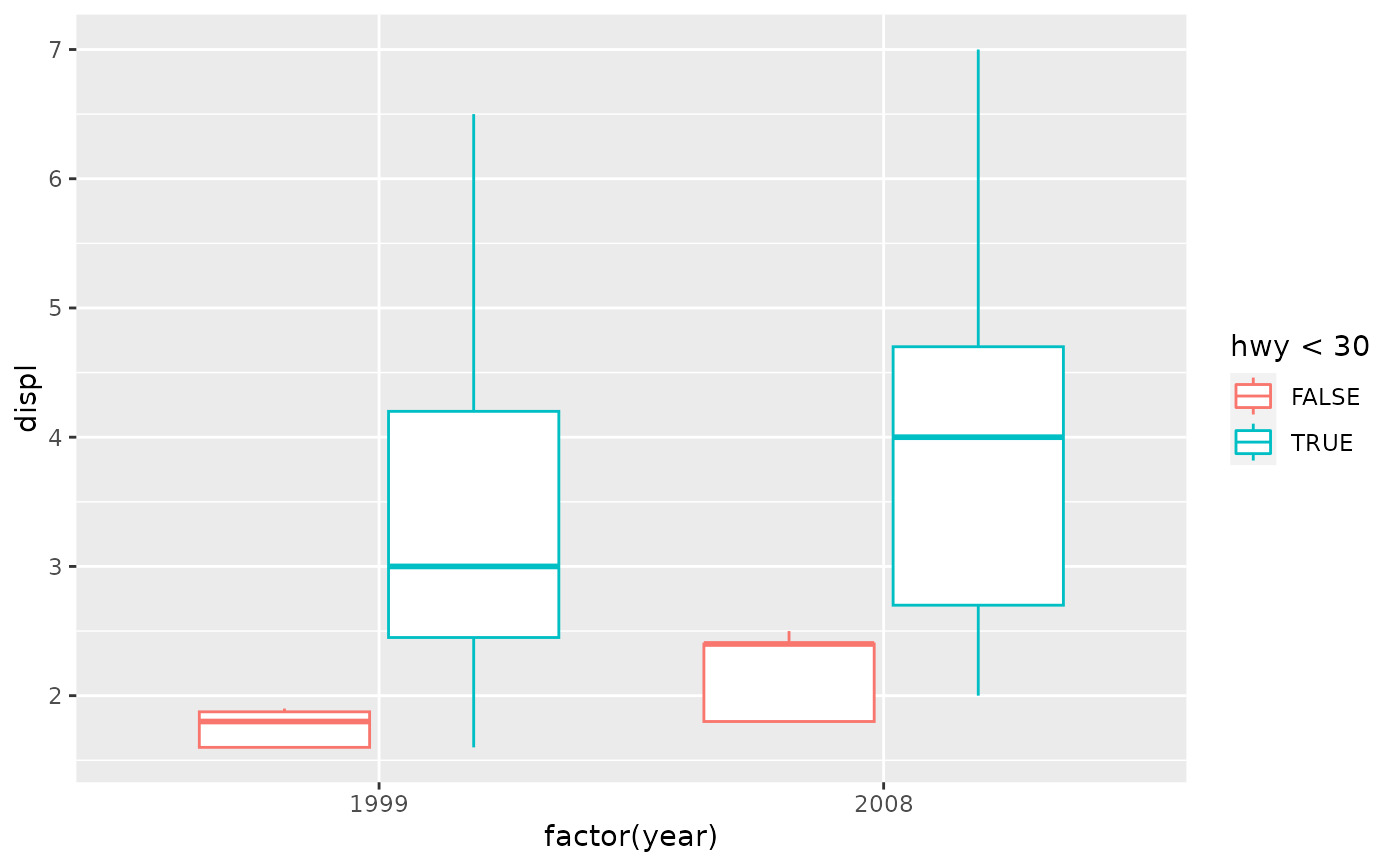
 # Box plots use position_dodge2 by default, and bars can use it too
ggplot(mpg, aes(factor(year), displ)) +
geom_boxplot(aes(colour = hwy < 30))
# Box plots use position_dodge2 by default, and bars can use it too
ggplot(mpg, aes(factor(year), displ)) +
geom_boxplot(aes(colour = hwy < 30))
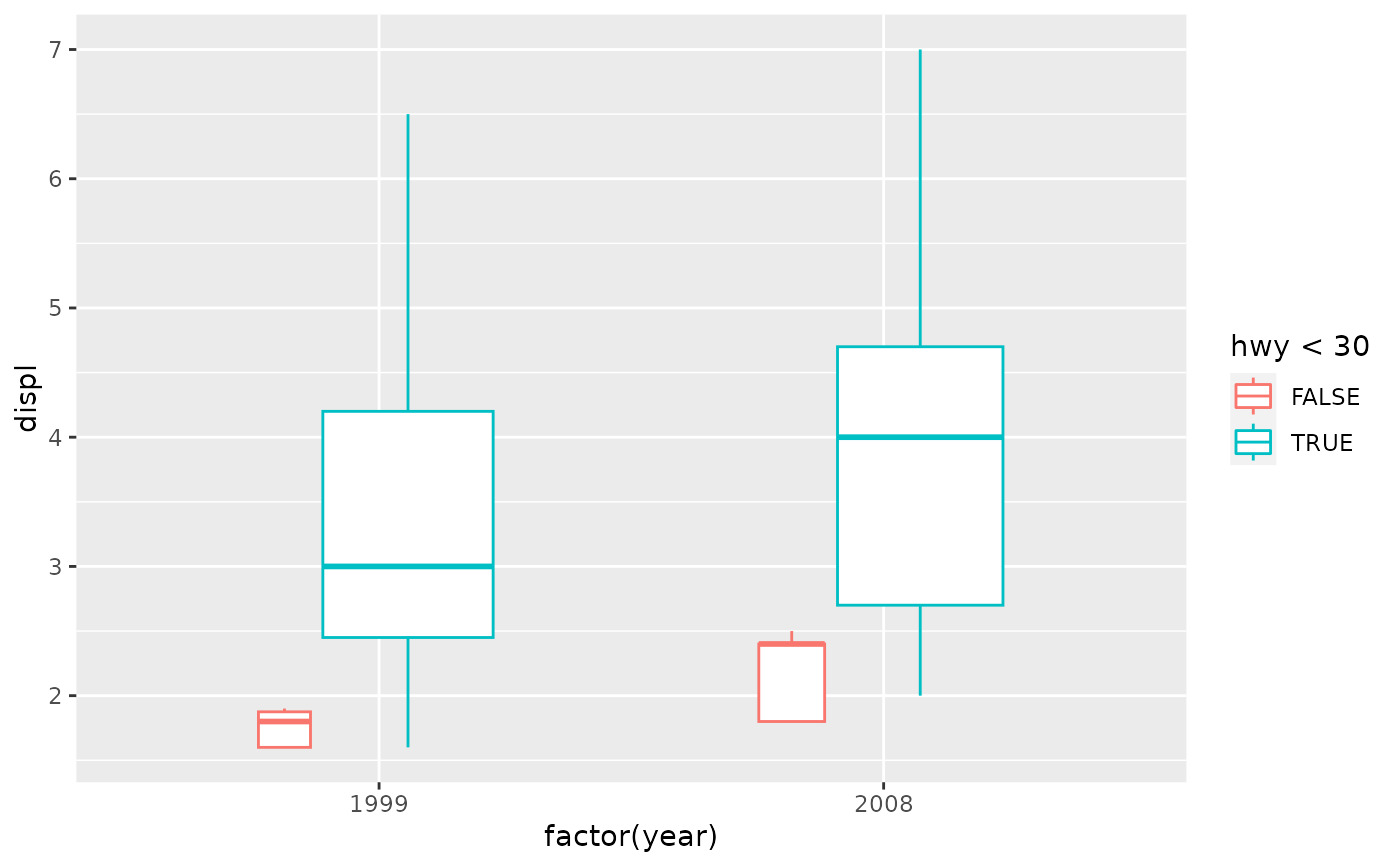
 ggplot(mpg, aes(factor(year), displ)) +
geom_boxplot(aes(colour = hwy < 30), varwidth = TRUE)
ggplot(mpg, aes(factor(year), displ)) +
geom_boxplot(aes(colour = hwy < 30), varwidth = TRUE)
 ggplot(mtcars, aes(factor(cyl), fill = factor(vs))) +
geom_bar(position = position_dodge2(preserve = "single"))
ggplot(mtcars, aes(factor(cyl), fill = factor(vs))) +
geom_bar(position = position_dodge2(preserve = "single"))
 ggplot(mtcars, aes(factor(cyl), fill = factor(vs))) +
geom_bar(position = position_dodge2(preserve = "total"))
ggplot(mtcars, aes(factor(cyl), fill = factor(vs))) +
geom_bar(position = position_dodge2(preserve = "total"))

相關用法
- R ggplot2 position_stack 將重疊的對象堆疊在一起
- R ggplot2 position_nudge 將點微移固定距離
- R ggplot2 position_jitter 抖動點以避免過度繪製
- R ggplot2 position_jitterdodge 同時閃避和抖動
- R ggplot2 print.ggplot 明確繪製情節
- R ggplot2 print.ggproto 格式化或打印 ggproto 對象
- R ggplot2 annotation_logticks 注釋:記錄刻度線
- R ggplot2 vars 引用分麵變量
- R ggplot2 geom_qq 分位數-分位數圖
- R ggplot2 geom_spoke 由位置、方向和距離參數化的線段
- R ggplot2 geom_quantile 分位數回歸
- R ggplot2 geom_text 文本
- R ggplot2 get_alt_text 從繪圖中提取替代文本
- R ggplot2 annotation_custom 注釋:自定義grob
- R ggplot2 geom_ribbon 函數區和麵積圖
- R ggplot2 stat_ellipse 計算法行數據橢圓
- R ggplot2 resolution 計算數值向量的“分辨率”
- R ggplot2 geom_boxplot 盒須圖(Tukey 風格)
- R ggplot2 lims 設置規模限製
- R ggplot2 geom_hex 二維箱計數的六邊形熱圖
- R ggplot2 scale_gradient 漸變色階
- R ggplot2 scale_shape 形狀比例,又稱字形
- R ggplot2 geom_bar 條形圖
- R ggplot2 draw_key 圖例的關鍵字形
- R ggplot2 annotate 創建注釋層
注:本文由純淨天空篩選整理自Hadley Wickham等大神的英文原創作品 Dodge overlapping objects side-to-side。非經特殊聲明,原始代碼版權歸原作者所有,本譯文未經允許或授權,請勿轉載或複製。